
Towards Short Test Sequences for Performance Assessment of Elastic
Cloud-based Systems
Michel Albonico and Paulo Varela
Federal Technological University - Paran
´
a, Francisco Beltr
˜
ao, Brazil
Keywords:
Cloud Computing, Elasticity, Combinatorial Testing, Small Test Sequences, Performance Testing.
Abstract:
Elasticity is one of the main features of cloud-based systems (CBS), helping them to meet performance re-
quirements under a varying workload. Given the great number of combinations among workload and elastic
adaptation parameters, assessing their effect on CBS performance may be prohibitive. Existing systematic
combinatorial testing approaches can help to reduce such combinations, though most of them only consider
conventional software architectures. In the literature, we only find a single work on elastic CBS combinatorial
testing, presented by some of the authors. However, the paper only presents experimental results on 2-wise
elasticity parameter interactions and shallowly explores the performance issue causes. In this paper, we lead a
further experiment by using our previous approach to generate performance test cases that cover three elasticity
parameter interactions (i. e., 3-wise), one interaction longer than on the previous paper. Despite the significant
increase in execution time and cost, new experimental results do not reveal any new critical performance issue
by 3-wise, which enforces the acceptance of 2-wise elasticity parameter interactions.
1 INTRODUCTION
In cloud computing, elasticity is a system property to
adapt itself in response to workload variation (Herbst
et al., 2013). The main goal of elasticity is for the
cloud-based system (CBS) to meet the current work-
load demand as closely as possible, which guaran-
tees an acceptable performance experience to the user.
Adaptations (i.e., dynamic changes) in the CBS struc-
ture and its operational parameters help it to achieve
elasticity when leading with computational resource
variation.
Inadequate adaptations can result in CBS perfor-
mance degradation, and consequently an unsatisfac-
tory service to the user. Therefore, testers must assess
CBS performance by testing their elasticity. A typ-
ical strategy to do so consists in varying the work-
load in a way the CBS adapts itself and assessing
whether such adaptations lead to significant degra-
dation in performance. However, the number of in-
teractions between possible workload variations and
CBS adaptations can be very large, where testing all
of them can be exhaustive and expensive. Therefore,
we must reduce the number of interactions, while still
being possible to find performance degradation.
Some of the authors previous work (Albonico
et al., 2017a) presents an approach based on Combi-
natorial Interaction Testing (CIT) to reduce the num-
ber of elasticity parameter interactions. The approach
allows generating test configurations by combining a
different number of elasticity parameters up to all pa-
rameter combination (N-wise). However, in the pre-
vious paper, we do not go further than two elastic-
ity parameter combination (2-wise). In this paper, we
focus on the impact of another elasticity parameter
combination for the performance assessment of CBS
systems.
Aiming at discovering an effective parameter cov-
erage for performance assessment of elastic CBSs,
we conduct two systematic experiments on a shard-
ing deployment of MongoDB document database
1
,
this paper CBS case study: 1) the CBS was exposed
to test sequences that cover 2 interactions (2-wise)
among elasticity parameters; 2) we increase the num-
ber of parameters interactions by one, generating test
sequences with 3 parameter interaction (3-wise), and
then exposed the CBS to them.
Experimental results enforce it is acceptable to
generate test sequences by covering 2-wise interac-
tions among elasticity parameters. Compared with 3-
wise, 2-wise experiment reveals most of the elasticity-
related performance issues, including the major ones,
1
MongoDB web site: https://www.mongodb.com/
Albonico, M. and Varela, P.
Towards Short Test Sequences for Performance Assessment of Elastic Cloud-based Systems.
DOI: 10.5220/0007758501650175
In Proceedings of the 9th International Conference on Cloud Computing and Services Science (CLOSER 2019), pages 165-175
ISBN: 978-989-758-365-0
Copyright
c
2019 by SCITEPRESS – Science and Technology Publications, Lda. All rights reserved
165
for our case study. Furthermore, both experiments re-
veal the same problematic re-configuration (transition
between two test configurations) pattern.
The remainder of this paper is organized as fol-
lows. Section 2 gives us a short introduction of cloud
computing, its states and combinatorial testing. Sec-
tion 3 presents the combinatorial-based test genera-
tion approach used in this paper. Section 4 describes
the experiments and discusses the results. Section 5
discusses the related work. Finally, Section 6 con-
cludes and lists future perspectives.
2 BACKGROUND
In this section, we describe the main aspects of elastic
CBS and combinatorial interaction testing.
2.1 CBS Elasticity
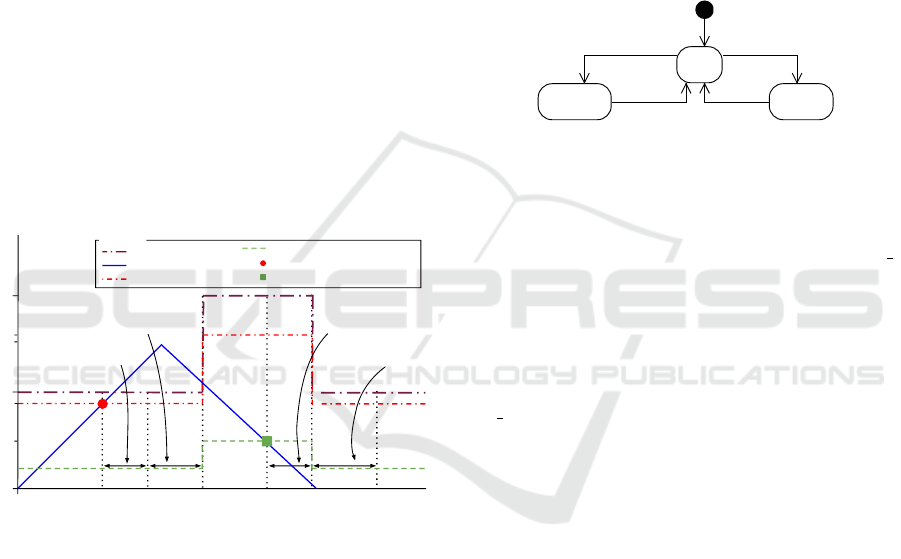
Figure 1 presents an example of CBS exposition to
cloud computing infrastructure elasticity (Albonico
et al., 2017b).
1.5
Resource Allocation
Resource Demand
Scale-out Threshold
Scale-in Threshold
Scale-out Threshold Breaching
Scale-in Threshold Breaching
Time (s)
Resource
(Processors)
2
1
0.4
0.8
1.6
scale-out reaction time
scale-out time
scale-in reaction time
scale-in time
Legend
Figure 1: Typical Elastic Behavior.
The graph reports a resource demand (y-axis) ex-
pressed over time (x-axis) as a percentage of the cur-
rently allocated resources. Fancifully, the demand in-
creases linearly, from 0 to 1.5, and then goes back to
0. Note that a resource demand equal to 1.5 means
that the application demands 50 % more resources
than the currently allocated ones.
If the resource demand exceeds the scale-out
threshold (as a percentage of currently allocated re-
sources, e.g. 80%) for the scale-out reaction time, the
cloud elasticity controller instantiates a new resource,
which becomes available after a scale-out time (the
time for the cloud infrastructure to allocate it). Once
the resource is available, the scale-in and scale-out
threshold values are updated accordingly. In a sim-
ilar way, if the resource demand becomes lower than
the scale-in threshold (as a percentage of currently
allocated resources, e.g. 20%) for the scale-in reac-
tion time, the cloud elasticity controller releases a re-
source. Note that, even if the infrastructure needs a
scale-in time to actually release the resource, the re-
source is no longer available and the threshold values
are updated as soon as the scale-in begins.
Cloud infrastructures can vary the number of com-
putational resources according to demand, i. e., elas-
ticity. In response to the cloud computing elastic-
ity, the CBS adapts itself, transiting through three
main states: scaling-in, scaling-out, and ready. Fig-
ure 2 depicts the transition between CBS elasticity
states (Albonico et al., 2017b).
Deallocated/
SI_t breaching[a>m]/a-- SO_t breaching/a++
Allocated/
Create/a=i
scaling-inscaling-out
ready
Figure 2: Elasticity State Transitions.
At the beginning, the CBS is launched (event cre-
ate), and enters into the ready state, when the amount
of allocated resource (a = i) is steady. When the re-
source demand breaches the scale-out threshold (SO t
breaching for a while (scale-out reaction time) and
a new resource is already added (a++), the CBS en-
ters into the scaling-out state, and remains there until
reacting to the allocated resource. After a scaling-
out, the CBS returns to the ready state. Then, when
the resource demand breaches the scale-in threshold
(SI t breaching), and a resource is being deallocated
(a–), the CBS enters into the scaling-in state. Note
that the scaling-out state, the scaling-in state begins
during the resource deallocation process since it is no
longer. Finally, it returns to tge ready state.
2.2 Combinatorial Testing
In complex cloud computing systems, the elastic be-
havior is determined by a large number of parameters,
such as workload thresholds, virtual machine type,
and system topology The interaction between some of
these parameters may be the cause of system failures
or performance degradation at runtime. Exhaustively
testing all possible combinations of parameter values,
i.e., all possible configurations, is often computation-
ally too expensive, because the total number of com-
binations of parameter values quickly increases as the
system size grows.
Several techniques have been proposed over the
years to address the intractability of exhaustive testing
by selecting a smaller representative set of configura-
tions. Among those, Combinatorial Interaction Test-
CLOSER 2019 - 9th International Conference on Cloud Computing and Services Science
166

ing (CIT) is a strategy that consists of testing all T-
wise combinations of the parameters of a system (Nie
and Leung, 2011). This means that when consider-
ing n parameter values T-wise combinatorial testing
investigates only 2
T
·
n
T
configurations compared to
the n! required for exhaustive testing. Kuhn et al.
show that 2-wise (pairwise) coverage of parameters
is adequate to detect more than 90 % of failures in
many software systems, while 6-wise coverage is the
maximum that is needed for practical purposes (Kuhn
et al., 2004).
In this paper, we use the tool Testona (previ-
ously known as CTE-XL) (Lehmann and Wegener,
2000) to generate CBS configurations. Testona im-
plements the Classification Tree Method, a strategy
for CIT. The method consists of tree steps: i) iden-
tify system relevant aspects, and their correspond-
ing values; ii) model a classification tree, where as-
pects are branches (classifications), and values are the
leaves (classes); iii) combine classes from classifica-
tions into test cases (or configurations), covering dif-
ferent T-wise combinations.
3 RE-USED TEST GENERATION
APPROACH
In this section, we re-present the three-steps
combinatorial-based approach to generate test se-
quences for elastic CBS (Albonico et al., 2017b)
given its complexity.
3.1 Elasticity Modeling
We model the elasticity parameters that can be con-
trolled during the test on a Classification Tree Model
(CTM) (Figure 4). The root of the CTM is the elas-
ticity, i. e., the CBS characteristic we want to investi-
gate. We decompose it into two main compositions,
namely cloud infrastructure, which encompasses the
parameters for the CBS deployment into the Cloud,
and benchmark, which models the workload. These
compositions are then decomposed into classifica-
tions. Additionally, the cloud infrastructure has the
sub-composition threshold that implements the scale-
out (scale out cpu t) and scale-in (scale in cpu t), set
on the Cloud.
The cloud infrastructure composition is decom-
posed into the elasticity state classification, which
classes represent the possible CBS states (see Fig-
ure 2). The scale
out cpu t and scale in cpu t classi-
fications receive three different values (classes) each,
where for the scale out cpu t the value range is from
0 to 50, while for the scale in cpu t it is from 50 to
100. Note that for avoiding bias, for each classifi-
cation, we use values which are equally spaced. The
benchmark composition is decomposed into the work-
load type and workload intensity classifications. In
particular, workload type classes represent the three
basic workload profiles found in benchmark tools:
read, write and read and write operations. The work-
load intensity implements two workload intensities to
drive the CBS through a scaling-out state: attempting
to exhaust the allocated resource (overloading), and
a fear workload, which never stresses the CBS (non-
overloading)(Gambi et al., 2013b).
3.2 Test Configuration Generation
A test configuration is a set C of classes which are
atomic values of classifications (leaves in the classifi-
cation tree). For example, a test configuration conf i
is a configuration with the first class of each classifi-
cation shown in the CTM of Figure 4:
conf i = {ready, 60%, 10%, read, overloading}
Based on the CTM, we can create 162 (= 3
4
· 2
1
)
configurations, where four classification has three
classes, while one has two.
Each test configuration should also satisfy addi-
tional cross-tree constraints, which model particular
aspects of the domain of testing CBS. For instance,
we specify that a configuration in the ready or scaling-
in state cannot have an overloading workload inten-
sity since this can unexpectedly trigger a resource
scale-out. Considering this constraint, for instance,
the conf i is an invalid configuration since it combines
both, the ready and overloading classes.
T-wise Combination
We use Combinatorial Interaction Testing (Nie and
Leung, 2011) to test only T-wise combinations of
elasticity parameters. This reduces the number of
test configurations while ensuring variety in the CTM
classes (Hervieu et al., 2011; Sen et al., 2015), where
the number of configurations and their variety in-
crease with the value of T. Considering the CTM of
Figure 4, the value of T could range from 2 to 5 (the
number of classifications in the CTM), while this test
generation methodology is independent of the value
of T.
Table 1 lists the twelve 2-wise test configurations,
while Table 2 lists the forty 3-wise configurations,
where we can see a high variance. In these tables,
each column represents a CTM classification, while
the rows are their values (classes).
Table 1 lists all the configurations generated sat-
isfying pairwise interactions of elasticity parameters
Towards Short Test Sequences for Performance Assessment of Elastic Cloud-based Systems
167

Step 1
Elasticity
Modeling
Elasticity
Parameters
Classification
Tree
Model
Step 2
Generation of
Test
Configuration
List of
T-wise Test
Configurations
Step 3
Generation of
Test Sequences
Test
Sequences
T-wise
parameter
Step
Intermediate output data
parameter
Scalability
parameter
Constraints
Elasticity State
Machine
Legend:
Figure 3: 3-Steps Approach (Albonico et al., 2017b).
Table 1: The 12 Pairwise Test Configurations (Albonico
et al., 2017b).
scale scale
elasticity out in workload workload
state cpu cpu type intensity
t t
2w-conf 0 scaling in 90% 40% read write not overloading
2w-conf 1 scaling out 90% 25% write overloading
2w-conf 2 scaling out 75% 10% read not overloading
2w-conf 3 ready 60% 25% write not overloading
2w-conf 4 scaling out 60% 40% read overloading
2w-conf 5 scaling out 60% 10% read write overloading
2w-conf 6 scaling in 75% 25% read write not overloading
2w-conf 7 scaling in 60% 10% write not overloading
2w-conf 8 ready 90% 10% read write not overloading
2w-conf 9 ready 75% 40% read not overloading
2w-conf 10 scaling in 90% 25% read not overloading
2w-conf 11 scaling out 75% 40% write overloading
and the constraints. Note that only considering pair-
wise interactions, the number of test configurations
is reduced from 162 (to cover all-wise interactions of
elasticity parameters) to 12.
3.3 Test Sequence Generation
In general, a test sequence is an ordered list of con-
figurations covering all the possible re-configurations,
i. e., transitions between configurations. Creating an
optimal sequence that covers all the re-configurations
without repeating them would require the use of a
backtrack algorithm, facing an NP-complete prob-
lem. Therefore, we choose to create several se-
quences, each one covering a subset of unique re-
configurations, and then we select several sequences
covering together all the re-configurations.
Generation of a List of Re-configurations
The re-configurations should model the elasticity
state transitions (see Figure 2), where scaling-out and
scaling-in states are always preceded or followed by a
ready state. Among others, this allows CBS to stabi-
lize itself after a resource change.
There are 54 re-configurations between 2-wise
test configurations, which are partially shown in Ta-
ble 3. Table last column reports the change in the
amount of resource related to the next configura-
tion. For instance, 2w-recon f 0 and 2w-recon f 3 are
re-configurations towards a ready state (2w-con f 3),
Table 2: The 40 3-wise Test Configurations.
scale scale
elasticity out in workload workload
state cpu cpu type intensity
t t
3w-conf 0 scaling in 90% 40% read write not overloading
3w-conf 1 scaling in 75% 25% write not overloading
3w-conf 2 scaling in 60% 10% read not overloading
3w-conf 3 scaling out 90% 40% write overloading
3w-conf 4 scaling out 90% 25% read not overloading
3w-conf 5 scaling out 75% 25% read write overloading
3w-conf 6 ready 90% 10% write not overloading
3w-conf 7 ready 75% 40% read not overloading
3w-conf 8 ready 60% 25% read write not overloading
3w-conf 9 scaling out 60% 10% write overloading
3w-conf 10 scaling out 60% 40% read overloading
3w-conf 11 ready 60% 40% write not overloading
3w-conf 12 scaling in 75% 10% read write not overloading
3w-conf 13 scaling out 60% 40% read write not overloading
3w-conf 14 scaling out 75% 10% read not overloading
3w-conf 15 scaling out 90% 10% read write overloading
3w-conf 16 scaling out 60% 25% write not overloading
3w-conf 17 scaling out 75% 40% write overloading
3w-conf 18 scaling in 60% 25% read write not overloading
3w-conf 19 ready 90% 25% read not overloading
3w-conf 20 scaling in 90% 10% write not overloading
3w-conf 21 scaling in 90% 25% read not overloading
3w-conf 22 ready 75% 25% write not overloading
3w-conf 23 ready 75% 10% read write not overloading
3w-conf 24 scaling out 90% 25% write overloading
3w-conf 25 ready 90% 10% read not overloading
3w-conf 26 ready 75% 40% read write not overloading
3w-conf 27 scaling out 75% 10% write overloading
3w-conf 28 scaling in 75% 25% read not overloading
3w-conf 29 scaling in 90% 40% read not overloading
3w-conf 30 ready 60% 10% read write not overloading
3w-conf 31 ready 90% 25% read write not overloading
3w-conf 32 ready 60% 25% read not overloading
3w-conf 33 scaling out 60% 40% read write overloading
3w-conf 34 scaling out 75% 25% read overloading
3w-conf 35 scaling out 90% 10% read overloading
3w-conf 36 scaling in 60% 40% write not overloading
3w-conf 37 ready 90% 40% read write not overloading
3w-conf 38 scaling in 75% 40% read write not overloading
3w-conf 39 scaling out 60% 25% read write overloading
Table 3: Excerpt of the 2-wise Re-configurations.
previous next changes in the
configuration configuration amount of resource
2w-reconf 0 2w-conf 0 2w-conf 3 0
... ... ... ...
2w-reconf 3 2w-conf 1 2w-conf 3 0
... ... ... ...
2w-reconf 9 2w-conf 3 2w-conf 0 -1
2w-reconf 10 2w-conf 3 2w-conf 1 +1
2w-reconf 11 2w-conf 3 2w-conf 2 +1
... ... ... ...
when the number of resources is not changed (=0),
while 2w-recon f 9 is a reconfiguration towards a
scaling-in state (2w-con f 0), when a resource is re-
moved (−1).
CLOSER 2019 - 9th International Conference on Cloud Computing and Services Science
168

elasticity
threshold
cloud_infrastructure
benchmark
workload_type workload_intensity
scale_out_cpu_t scale_in_cpu_t
60% 75%
90% 10% 25% 40%
read write
elasticity_state
ready scaling_out scaling_in
read_write
overloading
non-overloading
Figure 4: Elasticity Parameters CTM (Albonico et al., 2017b).
Generation of Test Sequences
From the set of re-configurations we can gener-
ate test sequences of any length by chaining re-
configurations. Figure 5 illustrates this concept using
an example graph that considers an excerpt of the re-
configurations listed in Table 3.
The nodes of the graph are test configurations,
while the edges are re-configurations. Each edge is
annotated the value from the last column of Table 3.
In this way, a test sequence can be seen as a path over
this re-configurations graph.
Re-configurations are associated to changes in re-
source allocation, and hence, particular paths over the
graph could lead to either continuous de-allocation of
resources or allocate too many resources. In this pa-
per, we bound the amount of resources (a) according
to Figure 2, which avoids scalability bias: the initial
number of resource (i), the minimum number of re-
sources (Min), and the maximum number of resources
(Max).
To reduce the length of test sequences, we avoid
to use the same reconfiguration several times by
transforming the re-configuration graph into a tree.
The tree root can be any configuration associated
to the ready state. The other nodes are configu-
rations reached through a sequence of unique re-
configurations, respecting resource amount bounds.
In this paper, we consider the values i = 1 and 1 ≤
a ≤ 2.
Figure 6 illustrates an example of a re-
configuration tree from the graph of Figure 5. The
test configuration 2w-con f 3, associated to the ready
state, is the root node. Only 2w-con f 1 and 2w-
con f 2 can occur at the first level (diamonds 1 and 2)
since 2w-con f 0 would lead to an amount of resource
lower than the minimum allowed. Test configurations
2w-con f 1 and 2w-con f 2 are not allowed at the third
2w-conf_3
2w-conf_2
2w-conf_1
2w-conf_0
0
+1
-1
0
0
+1
Figure 5: Excerpt of 2-wise Re-configuration Graph.
2w-conf_3
2w-conf_22w-conf_1
2w-conf_3 2w-conf_3
2w-conf_0 2w-conf_0
2w-conf_3 2w-conf_3
2w-conf_2 2w-conf_1
2w-conf_32w-conf_3
1 2
3
4 5
1
2
2
1
1
2
2
2
2
1
1
2
2
config-
uration
#allocated
resource
x : comment
Legend:
Figure 6: Reconfiguration Tree.
level of the left branch (diamond 3) since they would
push the amount of resources over the maximum. Fi-
nally, at the lower level (diamonds 4 and 5), no new
re-configuration is possible.
4 EXPERIMENTS
In this section, we present the experiment we con-
ducted to investigate the necessary elasticity parame-
ters coverage to find performance degradation into an
elastic CBS. We generate two sets of test sequences,
one by using 2-wise coverage, and another by using
3-wise coverage os elasticity parameters. Avoiding
interference from not modeled parameters such as,
bandwidth or concurrency, both sets of test sequences
are re-executed 10 times. The number of repetitions
respects financial constraints, once the experiments
by using 3-wise result in a high cost.
4.1 CBS Case Study
We use the document database MongoDB as a CBS,
which is deployed as a sharding cluster
2
: a config-
uration server, a mongos instance, and several shard
instances. Cluster sharding is useful when you need to
distribute instances across several nodes. In the clus-
ter, the configuration server stores meta-data, while
the mongos instance works as a coordinator and a load
balancer that routes queries and writes operations to
shards. Finally, shard instances store and process the
data in a distributed manner.
2
MongoDB Website: https://www.mongodb.org/
Towards Short Test Sequences for Performance Assessment of Elastic Cloud-based Systems
169

4.2 Software Deployment
Figure 7 illustrates the deployment of both, Mon-
goDB components and workload generation artifacts.
We deploy all the software artifacts on Amazon EC2
all purpose virtual machines described in Table 4. We
deploy the mongos and the configuration server on
the same virtual machine (t2.medium type) (MongoS
node), and the shard instance on a dedicated virtual
machine (t2.small type) (MongoD node). The initial
MongoDB configuration consists of only one shard
instance, where additional instances are manually al-
located/deallocated during execution by respecting
the threshold classes in the test configurations. In an-
other virtual machine (t2.large type) (Workload Gen-
erator Node), we deploy the workload generation ar-
tifacts, i. e., the Yahoo Cloud Serving Benchmark
(YCSB) (Cooper et al., 2010) as a benchmark tool,
and the workload controller. During the experiment,
the workload controller dynamically drives the bench-
mark tool according to the parameters in the test con-
figurations.
Workload
Controller
Benchmark
Tool
Config
Server
MongoS
Shard
Workload Generator Node
MongoD Node
MongoS Node
1..n
workload to
1
1 1...*
Figure 7: Software Components Deployment.
Table 4: Virtual Machine Configurations
3
.
Machine Type CPU Memory Disk Price/Hour
t2.small 1 vCPU (3.3 GHz) 2 GB 10 GB $0.0232
t2.medium 2 vCPUs (3.3 GHz) 4 GB 20 GB $0.0464
t2.large 2 vCPUs (3.0 GHz) 8 GB 20 GB $0.0928
4.3 Test Sequences Execution
Each test sequence is independently executed, and
at each execution we (re-)deploy the CBS, avoiding
any trash from previous executions. For each test se-
quence, we execute test configurations sequentially,
respecting their parameters. We first set up the thresh-
old on the cloud according to threshold value in the
test configuration, then we generate the workload.
The transition between configurations is determined
by the ending of the elasticity state associated with
the test configuration (see Section 2.1).
3
https://aws.amazon.com/ec2/instance-types/.
To generate the workload, we control the bench-
mark tool and parameterize it with the workload type
and intensity specified by the test configuration pa-
rameters workload type, workload intensity, thresh-
olds (scale out cpu t and scale in cpu t), and elas-
ticity state. The workload type is the native profile
of the benchmark tool. The workload intensity is
steady throughout each test configuration and varies
only when the configuration ends.
The workload intensity is calculated as our previ-
ous work (Albonico et al., 2016): (1) we profile the
resource usage of a workload type, and (2) we esti-
mate the number of request (workload intensity) to
lead the CBS to the target elasticity state.
Due to the cross-tree constraints explained in
Section 3.2, the elasticity
state ready and scaling-in
can only be associated to a non-overloading work-
load intensity. When the elasticity state is scaling in,
we set a workload intensity that breaches the scale-
in threshold. When the elasticity state is ready, we
set a workload intensity that keeps the resource usage
just below the scale-out threshold. For the elastic-
ity state scaling-out, we can have both types of work-
load intensity, i. e., overloading and non-overloading.
When the workload intensity is non-overloading, we
set a value that just breaches the scale-out threshold.
When the intensity is overloading, we set a value that
should use 100 % of CPU.
4.4 Performance Test Oracle
Ensuring a more reliable experimental validation, we
repeat the same test sequence multiple times measur-
ing the performance in the number of answered oper-
ations per second (i. e., throughput). Then, for each
configuration c
i
, we calculate its median throughput
(t
i
) over the executions, which is a parameter of the
test oracle.
Figure 8 illustrates both, workload (dashed line)
and configuration median throughput (solid line) vari-
ations, over the 3-wise test sequence (TS-0) execu-
tions. In the figure, we see several throughput drops
(negative different compared to the workload), such
as the ones after index 10, which are easy to see.
Nevertheless, other drops are less evident, such as
the ones before the index 5. This illustrates different
severity levels among throughput drops, which im-
pacts on the consumers is difficult to estimate. Allow-
ing testers to decide which is a critical level for their
CBS, the performance test oracle enables a severity
level setting.
The test oracle assigns performance testing ver-
dicts by using post-execution scripts. For each config-
uration c
i
, we calculate the percentage deviation (d
i
)
CLOSER 2019 - 9th International Conference on Cloud Computing and Services Science
170
0
500
1000
1500
2000
2500
3000
3500
4000
4500
5 10 15 20 25 30 35 40 45
Operations per sec. (ops/sec)
Test Sequence Index
Average Performance
Workload
Figure 8: Performance Variation for 3-wise Test
SequenceTS-0.
compared to the workload w
i
, defined as d
i
=
t
i
−w
i
w
i
.
Note that, if a configuration is repeated in a test se-
quence, we consider a distinct performance deviation
for each of its occurrences.
For each configuration c
i
in a test sequence, the
test oracle compares the expected performance (i. e.,
workload w
i
), to the absolute value of the perfor-
mance deviation (
|
d
i
|
). Avoiding false positives due
to light performance deviations, the test oracle sup-
ports several tolerance levels (L), where the higher is
the tolerance, the higher is the performance deviation.
Then, the test oracle assigns a verdict v
i
to each con-
figuration c
i
as following:
v
i
(
pass if
|
d
i
|
≤ L
fail if
|
d
i
|
> L
If the absolute value of the performance deviation is
less than or equal to the tolerance level, then the ver-
dict is pass. Otherwise, the verdict is fail.
4.5 Experimental Results
In this section, we first present the experiment results,
and discuss them later, in Section 4.5.5.
4.5.1 Execution Time and Cost
Both measurements, execution time and cost, are im-
portant for testers to decide whether a test is pro-
hibitive or not. Therefore, we present these measure-
ments for 2-wise and 3-wise experiments.
Two-wise configurations result in 97 re-
configurations. Executing them takes ≈6 h (≈3.8 s
per configuration) on the Amazon EC2, while repeat-
ing them 10 times takes ≈60 h, costing US$ ≈20.88:
(2L + M + 5S)∗ T (1)
where L, M and S are the costs per hour of dedicated
t2.large, t2.medium and t2.small instances on Ama-
zon EC2, and T is the execution time in hours. The
L cost is multiplied the number of t2.large instances
during the experiment, which is constant, while S is
multiplied by the number of t2.small instances within
one hour. Note that, on Amazon EC2, the shortest
instance fee time is one hour. Therefore, the total
of t2.small instances comes from the ≈ 3.7 minutes
per configuration, resulting in ≈ 16 configurations per
hour, where only 4 scale-out states in an additional
instance. Nonetheless, two large and one medium in-
stances live during the entire experiment, and there-
fore, only counts once in an hour.
The 3-wise re-configurations are 2675, i. e., 27 ×
longer than for 2-wise. Executing these once
takes ≈170 h, and re-executing them 10 times takes
≈1900 h, i. e., ≈2.4 months. By executing them in
parallel, one could reduce the execution time, how-
ever, it would still cost U S$ ≈661.2.
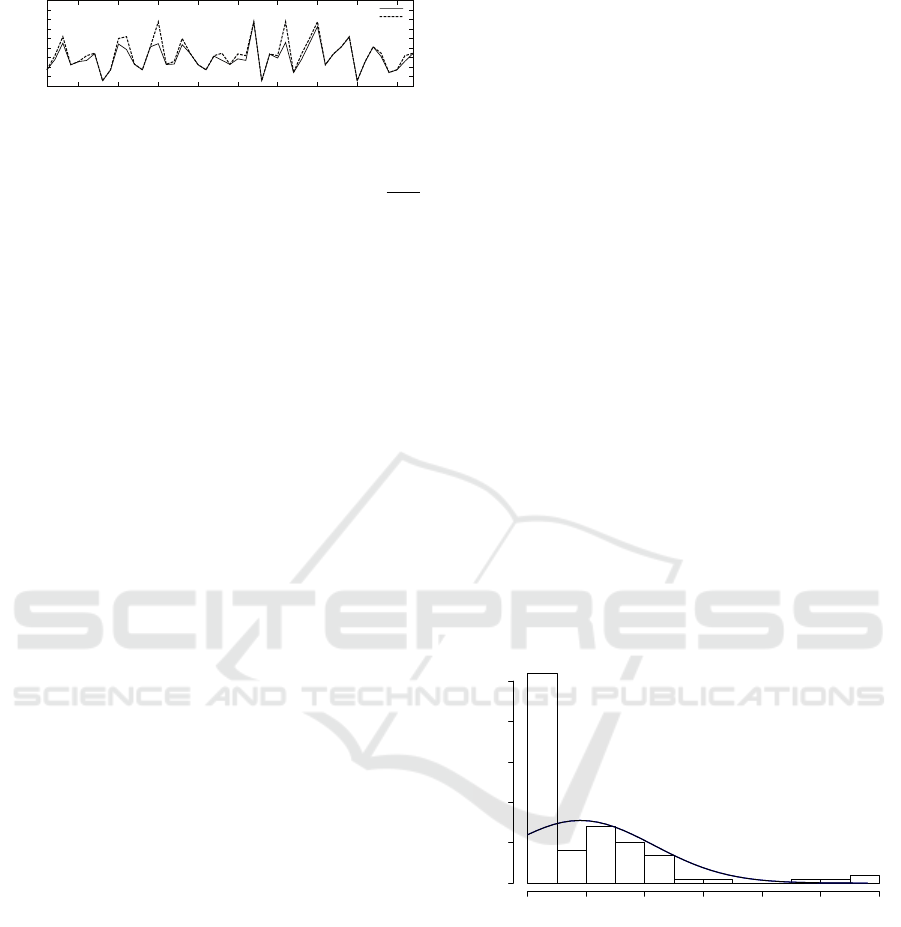
4.5.2 Severity of Performance Issues
Aiming at investigating the statistical difference be-
tween 2-wise and 3-wise test sequences, we illustrate
the distribution of their performance issue severity.
As a performance issue severity, we consider the dif-
ference in operations per second between the work-
load and the measured performance, where higher is
the difference, more severe is the performance issue.
Figure 9 illustrates the performance issue severity
for 2-wise test sequences. We see most of the perfor-
mance issues with a severity value less than 600 ops,
where the higher frequency is for severity values be-
tween 0 and 100 ops.
Performance Drop Value
Frequency
0 200 400 600 800 1000 1200
0 10 20 30 40 50
Figure 9: Distribution of the 2-wise Performance Issues.
Figure 10 illustrates the performance issue sever-
ity for 3-wise test sequences. In the figure, most of
the performance issues lie below 800ops, which is a
little higher than in 2-wise test sequences, and as well
as for 2-wise the higher frequency is also for sever-
ity values between 0 and 100. We also see that most
of the performance issues are lower than 1500, ex-
cept for some outliers that lie between 1500 and 2000.
Note that the difference on the frequency axis labels
of Figures 10 and 10 match the proportion in number
of test re-configurations, i. e., 97 for 2-wise and 2675
for 3-wise.
Towards Short Test Sequences for Performance Assessment of Elastic Cloud-based Systems
171
Performance Drop Value
Frequency
0 500 1000 1500 2000 2500
0 500 1000 1500
Figure 10: Distribution of the 3-wise Performance Issues.
4.5.3 Problematic Test Configurations
We use the test oracle (Section 4.4) to assess the
performance of test configurations during the exper-
iment. Considering different tolerance levels it re-
sults in fail verdicts in a range of 100 % (0.05) to 0 %
(0.35). Despite the tolerance levels in this paper are
realistic and could be used in industry, here we do not
discuss which is the better level for performance test-
ing of CBSs. We let it for testers to decide how they
affect consumers.
In both experiments, with 2-wise or 3-wise cov-
erage, we notice that 100% of the verdicts are fail
when the tolerance is at lowest level (no tolerance),
Therefore, no configuration c
i
achieves the ideal per-
formance (d
i
= 0) in the experiment, which is com-
prehensible since we are testing a distributed system
under a massive sequence of re-configurations.
Table 5 groups by tolerance level 2-wise and 3-
wise test configurations failing the test, which we call
unstable configurations.
Table 5: Unstable Configurations.
Tolerance Unstable Configurations
0.30−0.15 2w-conf 8, 2w-conf 9, 3w-conf 6,
3w-conf 7, 3w-conf 19, 3w-conf 22,
3w-conf 23, 3w-conf 25, 3w-conf 26,
3w-conf 31, 3w-conf 37
0.10−0.05 2w-conf 3, 3w-conf 8, 3w-conf 11,
2w-conf 30, 3w-conf 32
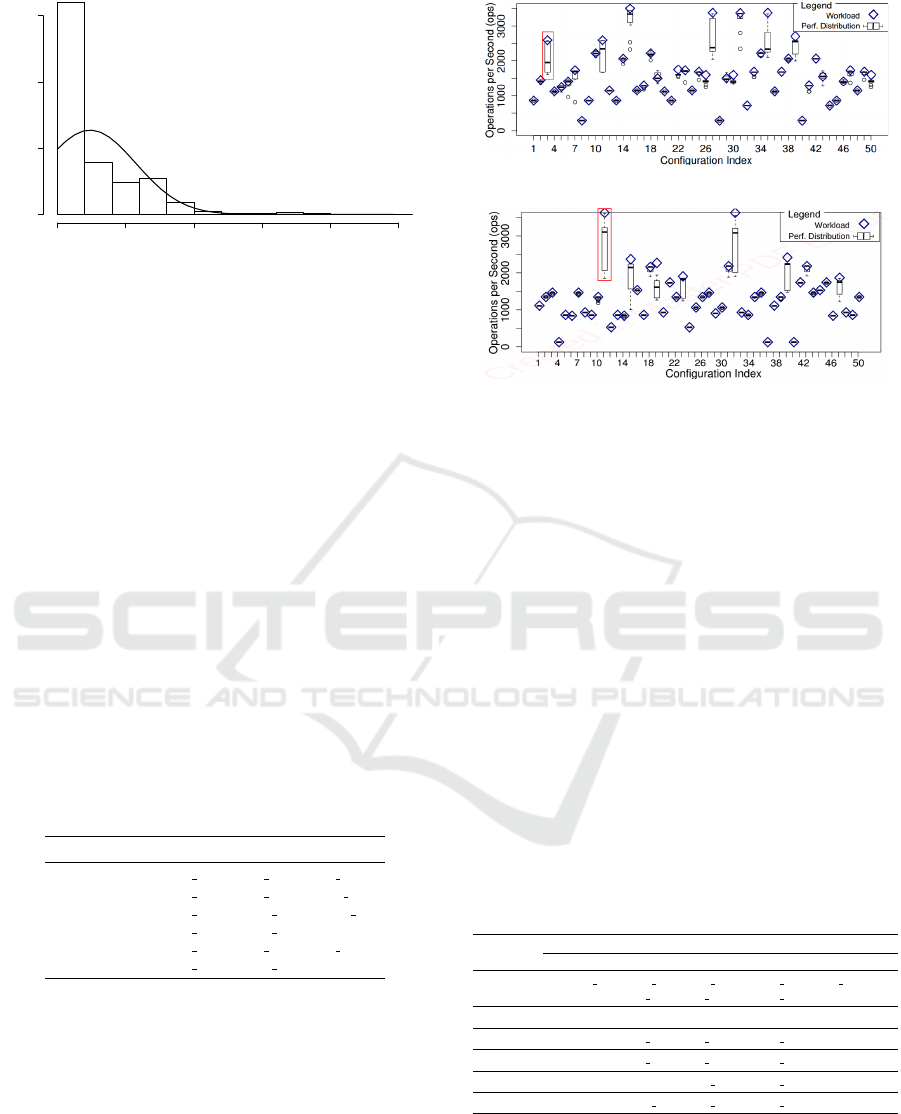
Figure 11 illustrates such configurations.
In the figures, diamonds represent the workload,
while box-and-whisker plots represent the distribu-
tion of each configuration throughput over 10 execu-
tions. At some configurations, such as at the index 3
in Figure 11a and at the index 11 in Figure 11b, the
performance variation is very high. We see that such
configurations have their medium values distant from
the workload, what mean they are unstable. Those
configurations match those listed in Table 5 with tol-
erance level between 0.30 and 0.15. Other configura-
(a) 2-wise Test Sequence TS-0
(b) 3-wise Test Sequence TS-0
Figure 11: Throughput Variation.
tions are less problematic, such as the ones at index
7 and at the index 23 in Figure 11b, which match to
the test configurations in Table 5 with tolerance level
between 0.10 and 0.05.
4.5.4 Problematic Re-configurations
By traversing the test sequences executed in the ex-
periments, we figured out the re-configurations that
result in the unstable configurations listed in Table 5,
which we call problematic re-configurations. For il-
lustration reasons, Table 6 only depicts an excerpt of
2-wise problematic re-configurations. Note that, for
each tolerance level, we only show new unstable re-
configurations not revealed by higher levels. There-
fore, each level of tolerance includes the performance
failures of the higher level, where tolerance 0.05 cor-
responds to all the re-configurations.
Table 6: Unstable Re-configurations by Tolerance.
Reconfiguration
Tolerance Previous Configurations Problematic Configurations
0.30
2w-conf 1, 2w-conf 2, 2w-conf 4 2w-conf 8, 2w-conf 9
2w-conf 5, 2w-conf 11 2w-conf 8
0.25 – –
0.20 2w-conf 5, 2w-conf 11 2w-conf 9
0.15 2w-conf 4, 2w-conf 11 2w-conf 3
0.10 2w-conf 5 2w-conf 3
0.05
2w-conf 1, 2w-conf 2 2w-conf 3
In the table, all of the previous test configurations
are associated with the scaling-out elasticity state, and
all of the test configurations associated with a scaling-
out elasticity state proceed at least a problematic con-
figuration. As previously stated, the problematic con-
CLOSER 2019 - 9th International Conference on Cloud Computing and Services Science
172

figurations are all associated with the ready elasticity
state. This same pattern is found for both, 2-wise and
3-wise test sequences.
We also see that the severity of problematic con-
figurations is linked to their workload intensity pa-
rameter, where the higher is the workload intensity,
the more severe is the performance failure. For the
highest tolerance level (0.30-0.20), we have test con-
figurations associated with ready state and high work-
load intensity. For the lowest tolerance levels (0.15-
0.05), we have test configurations associated with
ready state and low workload intensity. Both are pro-
ceeded by a scale-out state.
4.5.5 Discussion
Before discussing the presented results, let us high-
light that, during the experiment execution, we pre-
vent resource exhaustion and unbalanced data be-
tween instances to avoid any interference to the elas-
ticity parameters.
By comparing 2-wise and 3-wise experimental re-
sults, we see that grater parameter coverage is typi-
cally cost- and time-consuming. For instance, exe-
cuting 3-wise test sequences (only one combination
grater than 2-wise) once takes ≈170 h on the Amazon
EC2, ≈28 times more than 2-wise. One could argue
that this can be solved by executing the test sequences
in parallel. However, this does not reduce the execu-
tion cost, which for 3-wise test sequences is also ≈28
more expensive.
Even though 3-wise test sequences is more plural
in therms of test configurations, we do not see any
relevant difference in their performance issue severity
distributions (Figures 9 and 10). This indicates the
CBS behaves alike for both.
For the MongoDB case study, 2-wise test se-
quences reveal the same pattern among problematic
test re-configurations. Given the expensiveness of 3-
wise test sequences execution, we expected more se-
vere performance degradation, which is not revealed
in the experiment. We do not plan to execute test
sequences with larger combination of elasticity pa-
rameters since the cost and execution time are pro-
hibitive. However, one could re-execute the experi-
ment by considering different or further elasticity pa-
rameters.
About the performance degradation found, we no-
tice that they occur due to MongoDB load balanc-
ing problems. Right after being added during the
scaling-out state that precedes unstable configura-
tions,the newest shard node does not receive as many
requests as the existing one (oldest shard). Then, dur-
ing a ready state that follows a scaling-out state, the
oldest shard is exhausted. That explains why only
ready states with high intensity have severe perfor-
mance degradation.
4.5.6 Threats to Validity
In this study, we consider that a reconfiguration can
only occur by changing the elasticity states. One can
argue that during an elasticity state the other parame-
ters could be changed. It is right but useless in most
situations. For instance, when the system is in a scal-
ing in state, it is useless to change the threshold or the
workload intensity parameters. Furthermore, as far as
we experimented, we did not see major impact due to
workload type changes. In this paper, we only con-
sider the elasticity performance issue, then the most
interesting parameters is elasticity state, whereas we
are interested in measuring the impact of the other pa-
rameters when elasticity state is changed.
We choose to have each reconfiguration only once
per test sequence. Therefore, we need several se-
quences to cover all the re-configurations. An alter-
native would be to create an unique sequence with
all the re-configurations. However, to satisfy all
the constraints, we would need to duplicate the re-
configurations in the sequence. This solution could
be employed in real life, but in this paper, to get ex-
ecutions that can be compared each other, we prefer
to generate several sequences with unique reconfigu-
ration in each one of them.
We restrict the list of elasticity parameters in our
classification tree. More parameters result in test se-
quences longer than the ones we use in the experi-
ments. We could set a wider range of scale-out thresh-
olds. In particular, this would help us identifying
which is the exact limitation of MongoDB at ready
states. However, the paper focus on proposing an ap-
proach for elasticity testing of cloud systems, wherein
the set parameters are enough to answer the research
questions.
5 RELATED WORK
Gambi et al. (Gambi et al., 2013b) and model elas-
tic systems as a sequence of elasticity states (ES)
called elastic transition sequence (ETS). Given an in-
put workload they verify if the elasticity transition se-
quence executes as expected. However, the ETS does
not consider scaling states (scale in/out) and ignores
testing requirements such as coverage of workload
or coverage of all possible sequences. The authors
also present AUToCLES (Gambi et al., 2013a), a test-
as-a-service (TaaS) tool. Their resource management
(elasticity control) allows customized reuse of virtual
Towards Short Test Sequences for Performance Assessment of Elastic Cloud-based Systems
173

machines and resource sharing, in contrast to usual
Infrastructure-as-a-Service (IaaS). The elastic opera-
tions (add or remove virtual machines) we consider in
this paper respect the infrastructure constraints. None
of their work considers a strategy to soften the com-
plexity of elasticity testing.
There are several research efforts on elasticity
control, which is peripheral to the subject of our work.
Our goal is to test a cloud application covering various
elasticity states and workloads rather than develop au-
tonomous control algorithms for elasticity of a CBS.
We briefly mention work on elasticity control to give
the reader an overview of a related area. Copil et al.
discuss Sybl a language to control elasticity (Copil
et al., 2013), Han et al. present a lightweight ap-
proach for resource scaling (Han et al., 2012), and
Malkowski et al. use empirical models of workloads
for controlling elasticity (Malkowski et al., 2011). Al-
bonico et al. (Albonico et al., 2016) present elastic-
ity control of the specific case of web applications on
the cloud. Finally, Truong et al. (Truong et al., 2014)
present a platform as a service for elasticity control,
and Dupont et al. do experimental analysis on auto-
nomic elastic control strategies (Dupont et al., 2015).
Finally, Islam et al. present metrics for measuring
elasticity on a cloud platform (Islam et al., 2012).
In contrast, our work measures the performance of a
cloud application upon workload and elasticity states
variations.
Systematic testing of a CBS for performance un-
der elastic conditions (Brebner, 2012) is essential to
guarantee service level agreements and be reliable un-
der varying workloads. Our work is based on previous
work on modeling (Lehmann and Wegener, 2000) and
generating test cases (Perrouin et al., 2010; Perrouin
et al., 2012) for CIT. In a recent work, Sen et al. (Sen
et al., 2015) goes one step further and generates se-
quences of re-configurations to evaluate reconfigura-
tion impact in self-adaptive software systems. In our
previous work (Albonico et al., 2017b), we propose
an approach to select re-configurations that represent
realistic elasticity. However, we do not go further than
test configurations that cover 2-wise elasticity param-
eters.
6 CONCLUSION
In this paper, we parameterize a combinatorial-based
approach to create 2-wise and 3-wise test sequences
for elasticity testing. The approach is applied to as-
sess the performance of a CBS case study, the Mon-
goDB.
In the experiments, shortest test sequences, i. e.,
2-wise, reveal most of the performance degradation.
It also allows us to identify a pattern for unstable
re-configurations. Given the promising experimental
results, and the large adoption of 2-wise in standard
software testing, we claim it is also an adequate cov-
erage in the case of combinatorial test case generation
for elastic CBS performance assessment. This is en-
forced by the presented high cost and long executions
of 3-wise or longer test sequences, which may make
their executions impractical.
This work is our second step towards short test se-
quence generation for CBS performance assessment.
The presented results enforce 2-wise combinatorial
testing as a combinatorial testing strategy. However,
one cloud compare other methods, as well as fur-
ther elasticity parameters, case studies, and scalabil-
ity (more than two nodes). As future work, we plan to
compare this paper CIT to further test case generation
strategies. We also plan to conduct a deeper evalua-
tion of elasticity parameters, scalability and case stud-
ies.
REFERENCES
Albonico, M., Alesio, S. D., Mottu, J., Sen, S., and Suny
´
e,
G. (2017a). Generating Test Sequences to Assess the
Performance of Elastic Cloud-Based Systems. In 2017
IEEE 10th International Conference on Cloud Com-
puting (CLOUD), pages 383–390.
Albonico, M., Di Alesio, S., Mottu, J., Sen, S., and Suny
´
e,
G. (2017b). Generating test sequences to assess the
performance of elastic cloud-based systems. In 2017
IEEE 10th International Conference on Cloud Com-
puting (CLOUD), Honolulu, HI, USA, June 25-30,
2017, pages 383–390.
Albonico, M., Mottu, J.-M., and Suny
´
e, G. (2016). Control-
ling the elasticity of web applications on cloud com-
puting. In Proceedings of the 31st Annual ACM Sym-
posium on Applied Computing, Pisa, Italy, April 4-8,
2016, pages 816–819.
Brebner, P. C. (2012). Is your cloud elastic enough?: per-
formance modelling the elasticity of infrastructure as
a service (iaas) cloud applications. In Proceedings of
the 3rd ACM/SPEC International Conference on Per-
formance Engineering, pages 263–266. ACM.
Cooper, B. F., Silberstein, A., Tam, E., Ramakrishnan, R.,
and Sears, R. (2010). Benchmarking Cloud Serving
Systems with YCSB. In Proceedings of SoCC’10,
New York, NY, USA. ACM.
Copil, G., Moldovan, D., Truong, H.-L., and Dustdar, S.
(2013). Sybl: An extensible language for controlling
elasticity in cloud applications. In Cluster, Cloud and
Grid Computing (CCGrid), 2013 13th IEEE/ACM In-
ternational Symposium on, pages 112–119. IEEE.
Dupont, S., Lejeune, J., Alvares, F., and Ledoux, T. (2015).
Experimental Analysis on Autonomic Strategies for
Cloud Elasticity.
CLOSER 2019 - 9th International Conference on Cloud Computing and Services Science
174

Gambi, A., Hummer, W., and Dustdar, S. (2013a). Auto-
mated testing of cloud-based elastic systems with AU-
ToCLES. In The proceedings of ASE’13, pages 714–
717. IEEE/ACM.
Gambi, A., Hummer, W., and Dustdar, S. (2013b). Test-
ing elastic systems with surrogate models. In 2013
1st International Workshop on Combining Modelling
and Search-Based Software Engineering (CMSBSE),
pages 8–11. IEEE.
Han, R., Guo, L., Ghanem, M. M., and Guo, Y. (2012).
Lightweight resource scaling for cloud applications.
In Cluster, Cloud and Grid Computing (CCGrid),
2012 12th IEEE/ACM International Symposium on,
pages 644–651. IEEE.
Herbst, N. R., Kounev, S., and Reussner, R. (2013). Elas-
ticity in Cloud Computing: What It Is, and What It Is
Not. ICAC.
Hervieu, A., Baudry, B., and Gotlieb, A. (2011). PACO-
GEN: Automatic Generation of Pairwise Test Config-
urations from Feature Models. In 2011 IEEE 22nd
International Symposium on Software Reliability En-
gineering (ISSRE), pages 120–129.
Islam, S., Lee, K., Fekete, A., and Liu, A. (2012). How a
consumer can measure elasticity for cloud platforms.
In Proceedings of ICPE’12, page 85, New York, New
York, USA. ACM Press.
Kuhn, D. R., Wallace, D. R., and Gallo Jr, A. M. (2004).
Software fault interactions and implications for soft-
ware testing. Software Engineering, IEEE Transac-
tions on, 30(6):418–421.
Lehmann, E. and Wegener, J. (2000). Test Case by Means
of the CTE XL. EuroSTAR 2000.
Malkowski, S. J., Hedwig, M., Li, J., Pu, C., and Neumann,
D. (2011). Automated control for elastic n-tier work-
loads based on empirical modeling. In Proceedings of
the 8th ACM international conference on Autonomic
computing - ICAC ’11, page 131, New York, New
York, USA. ACM Press.
Nie, C. and Leung, H. (2011). A Survey of Combinatorial
Testing. ACM Comput. Surv., 43(2).
Perrouin, G., Oster, S., Sen, S., Klein, J., Baudry, B., and
Traon, Y. (2012). Pairwise Testing for Software Prod-
uct Lines: Comparison of Two Approaches. Software
Quality Journal, 20(3-4):605–643.
Perrouin, G., Sen, S., Klein, J., Baudry, B., and Le Traon,
Y. (2010). Automated and scalable t-wise test case
generation strategies for software product lines. In
Software Testing, Verification and Validation (ICST),
2010 Third International Conference on, pages 459–
468. IEEE.
Sen, S., Alesio, S. D., Marijan, D., and Sarkar, A. (2015).
Evaluating Reconfiguration Impact in Self-Adaptive
Systems – An Approach Based on Combinatorial In-
teraction Testing. In 2015 41st Euromicro Conference
on Software Engineering and Advanced Applications,
pages 250–254.
Truong, H. L., Dustdar, S., Copil, G., Gambi, A., Hummer,
W., Le, D. H., and Moldovan, D. (2014). CoMoT - A
Platform-as-a-Service for Elasticity in the Cloud. In
Proceedings of IC2E.
Towards Short Test Sequences for Performance Assessment of Elastic Cloud-based Systems
175
