
Using Developer-tool-Interactions to Expand Tracing Capabilities
Dennis Ziegenhagen
1,2
, Andreas Speck
1
and Elke Pulverm
¨
uller
2
1
Department of Computer Science, Christian-Albrechts-University Kiel, 24098 Kiel, Germany
2
Institute for Computer Science, Osnabrueck University, Postfach 4469, 49069 Osnabr
¨
uck, Germany
Keywords:
Traceability, Tracing Data Generation, Tool Integration, Developer-tool-Interaction.
Abstract:
Expanding current software traceability methodologies offers opportunities to significantly support develop-
ment activities. State-of-the-art traceability frameworks use tracing data at specific points in time. This data
includes information about development artefacts and their relations, which may be used for analysis, visuali-
sation and similar purposes. In between those points in time, developers create, modify or delete requirements,
diagrams, source code and other relevant artefacts. We propose to capture such artefact interactions in order to
enrich the tracing data. By applying existing approaches in the field of developer-tool interaction analysis to
the enriched data, we aim at supporting the developer’s work. In this paper, we present the overall approach,
along with our development of a modular framework which may be used to capture the desired data from
various tools, manage it and finally enable the execution of developer-interaction analyses.
1 INTRODUCTION
Applying traceability methodologies to software de-
velopment allows project members to gain insights
into the involved processes and results. Depending
on the goals of the traceability implementation, infor-
mation about various types of requirements, source
code, test cases and other artefacts is collected in a
structured way. Identifying, managing and updating
their relations throughout the development is a core
task in order to create the desired trace links. For a
basic application, these steps may be done manually.
Additionally, (semi-) automated approaches are avail-
able, e.g. by utilising information retrieval for recov-
ering traceability links. Yet traceability is not broadly
used and current analyses state necessary researches
and problem areas (Cleland-Huang et al., 2014).
Since software development involves various tools
for particular tasks, the approach which we present
here tries to take advantage of this. A number of them
offer interfaces, e.g. APIs, that can be used to access
the contents which the user creates using the tools.
Furthermore, these interfaces may not only provide
data, but also enable the execution of internal func-
tionalities. As an example, many IDEs are extensi-
ble via plug-in mechanisms along with correspond-
ing APIs. We utilise such possibilities in order to re-
ceive information about interactions which influence
traced artefacts. Thus, we enrich tracing data with
details on how they are changed during development.
In our approach, changing an artefact leads to an auto-
mated updating of the respective tracing data. For this
reason, we call this enrichment dynamic tracing data
as opposed to “static tracing”. Of course, in current
traceability applications the data also changes over
time (and thus is not completely static), but we use
this denomination to emphasise the fundamental idea
of combining artefacts, their relations and developer-
tool-interactions which influence them.
Capturing this data allows to integrate various ex-
isting approaches and findings on the interactions be-
tween developers and their tools. Amongst others,
these include supporting the developer by providing
helpful information for accomplishing a specific task
(Maalej and Sahm, 2010) and suggesting error solv-
ing solutions (Hartmann et al., 2010). Besides an ex-
tension of traceability features, the goal is to use the
combined dynamic and static data in order to enable
further analysis, research, and finally assist the users.
An example usage is the detection of correlating prop-
erties across tool boundaries, e.g. interdependent real-
time constraints which are modelled using different
tools (Noyer et al., 2017).
In this paper, we motivate the idea of capturing
interaction events to enrich current traceability data.
For this, related work in the fields of traceability and
interaction analysis is considered. In order to intro-
duce our approach, the overall goals and general, ini-
518
Ziegenhagen, D., Speck, A. and Pulvermüller, E.
Using Developer-tool-Interactions to Expand Tracing Capabilities.
DOI: 10.5220/0007762905180525
In Proceedings of the 14th International Conference on Evaluation of Novel Approaches to Software Engineering (ENASE 2019), pages 518-525
ISBN: 978-989-758-375-9
Copyright
c
2019 by SCITEPRESS – Science and Technology Publications, Lda. All rights reserved

tial thoughts are summarised. They form the basis
for presenting our environment for capturing and us-
ing the combined data. Briefly summarised, it is a
modular solution to enable a flexible bridging of both
areas: software traceability and developer-tool inter-
action analysis. An example scenario is provided to
illustrate the framework and its intended application.
2 RELATED WORK
Considering available traceability solutions, those
containing an automated tracing data generation are
most important for us. For example, (Neum
¨
uller and
Gr
¨
unbacher, 2006) present lessons learned from de-
veloping and introducing a specialised traceability
framework in a small company. Because the avail-
able traceability environments didn’t suit the intended
purposes, they built a custom solution with a fo-
cus on automated trace acquisition. Amongst oth-
ers, the authors motivate the success of their project
with smoothly integrating existing development tools.
Also, they preferred automating selected features in-
stead of adopting a commercial product with many
probably unused functions.
An overview of retrospective and prospective soft-
ware traceability is provided by the work of (Asun-
cion et al., 2010). The authors combine these tech-
niques by applying topic modelling to tracing data
which is recorded using various tool adapters. A dif-
ference to our approach can be found in the way work-
ing with multiple projects is integrated. While Asun-
cion et al. aim at separating the tracing data of each
project from other projects, we instead use it to iden-
tify cross-project relations and e.g. to provide devel-
opers with problem solutions from other projects.
“SAT Analyzer” (Palihawadana et al., 2017) is an
example for traceability management environments.
It supports predetermined artefact types. By including
DevOps practices, it is able to track artefact changes
between builds and to create tracing data based on
these changes semi-automatically.
Extending traceability with a developer action has
been realised by (Mahmoud and Niu, 2013). The au-
thors analyse the impact various types of refactoring
have on the traceability of a software project. De-
pending on the type, they observed both, positive
and negative effects during refactoring. This con-
firms our assumption that considering developer in-
teractions may be a valuable extension to the tracing
methodologies.
Research on developer-interaction-analysis can
roughly be divided into “offline” methodologies, i.e.
understanding the developer’s work by analysing us-
age data, and “online” approaches which directly
monitor interactions when they occur. Examples for
the first type can be found at (Snipes et al., 2015) and
(Damevski et al., 2017), who utilise data collected by
IDEs. (Roehm and Maalej, 2012) show an example
for the second type. The authors, along with others,
also present an application to support developers by
using the monitored data (Roehm et al., 2013).
An interesting approach of considering the mo-
mentary used set of tools and artefacts as a context
for performing a task is presented by (Maalej and
Sahm, 2010). Thus, the developer’s work is struc-
tured into tasks for which the involved artefacts are
captured in a history-like manner. This idea has been
carried further to analyse the suiting of traceability
methods for specific tasks contexts by (Li and Maalej,
2012). Though focusing on visualisation techniques,
their findings also provide insights in how developers
interact with artefacts in various tasks, e.g. design,
implementation and testing.
3 CURRENT STATE OF
TRACEABILITY
The term traceability is used in many areas and thus
may include different scopes and methodologies, de-
pending on the actual purpose of its usage. For ex-
ample, requirements traceability usually puts the life-
cycle of a project’s requirements into focus and en-
ables forward and backward tracing of these (Go-
tel and Finkelstein, 1994). This aims at answer-
ing higher, project-related questions, e.g. whether
all specified requirements have been implemented or
which requirements are affected by an erroneous soft-
ware module. Regarding model-driven development
as another example, the view on traceability is a
bit more general and emphases the tracing of gener-
ated artefacts, e.g. created during model transforma-
tion (Walderhaug et al., 2006) (Haouam and Meslati,
2016).
Due to these varying aspects, first of all, it is
necessary to define the term traceability itself and
its scope. Our approach considers various roles
of project members and their work during different
phases of software development. To enable this, we
use a broad definition of the term, which for example
Aizenbud-Reshef et al. propose: “We regard trace-
ability as any relationship that exists between arti-
facts involved in the software-engineering life cycle”
(Aizenbud-Reshef et al., 2006).
By considering existing traceability frameworks
and approaches, common proceedings can be found.
Examples are the “AMPLE Traceability Framework”
Using Developer-tool-Interactions to Expand Tracing Capabilities
519

(Anquetil et al., 2010), the previously mentioned
“SAT Analyzer” (Palihawadana et al., 2017) and the
tool presented by (Wijesinghe et al., 2014). We iden-
tify and summarise the following steps which trace-
ability frameworks perform and which are relevant to
our approach:
• Extract artefact data from the actual project con-
tents (e.g. requirement documents or source
code).
• Data equalisation, i.e. transforming the various
artefact data models to a common traceability data
model.
• Dependency detection, i.e. generation of candi-
dates for artefact link.
• Supervision by the user, e.g. correction of the au-
tomatically generated data.
• Usage of the corrected data, e.g. analysing it with
the purpose of assessing coverage aspects, execut-
ing trace queries or applying visualisation tech-
niques.
We use these findings in our approach to show the re-
lations to current state-of-the-art traceability methods.
4 APPROACH
The tools and frameworks described in the previ-
ous section create, manage and use a set of artefacts
and their relationships. These tasks are performed at
specific points in time during development and are
usually started manually. They may also be inte-
grated into a workflow to be performed automatically
or at least semi-automatically. The SAT Analyzer,
for example, provides a Jenkins integration which
asks the user to start the tool after a successful build
(Palihawadana et al., 2017). Throughout a project’s
progress, performing these tasks create a momentary
view on the artefacts and their relations. We consider
this as some kind of snapshot and thus call it static
tracing data. In between two snapshots, a number
of changes occurs, e.g. artefacts are added, deleted
or modified, with corresponding impact on their rela-
tions. From all the actually performed changes, only a
limited number can be extracted from comparing two
snapshots. Our assumption is, that this limitation ab-
stracts from more detailed developer actions and thus
may miss valuable information. An example for this
are decisions and experiences a developer makes with
trying out multiple variations of an implementation.
Capturing the involved code changes and information
about which other artefacts were used while perform-
ing this task may help to understand and reproduce
the developer’s work later on. The static snapshot
only covers the results and probably some documen-
tation about it. But the intermediate states are not
captured. Our approach builds upon these consider-
ations and observations by extending current trace-
ability with the “missing” dynamic aspects which in-
fluence them. In the following, we present details
and backgrounds of this extension, along with an il-
lustrating scenario which interprets developer-tool-
interactions as dynamic traceability data that is added
to the static data.
4.1 Goals and Initial Considerations
An intended purpose of our approach is to help en-
abling and improving methodologies which support
and assist project members throughout their work.
Thus, we have a look at typical ways the involved de-
velopment tools are utilised.
First of all, we consider tools to be used differently
throughout the various phases of the software devel-
opment life-cycle, depending on the actual task the
user wants to accomplish. Generally, our approach
should be applicable at all phases in which artefacts
are created or used. As a common assumption, early
project stages may involve a frequent creation and
change of requirement artefacts, while subsequent
work focuses on design artefacts. When software de-
sign is implemented, requirements probably undergo
less changes than source code artefacts. Thus, for
most artefact types, project phases exist in which they
are either frequently or rarely changed.
Another varying in the amount of interactions can
be found by looking at particular interaction types.
We take implementation as an example: Writing code
includes many low-level editor input events, espe-
cially key strokes. Additionally, higher IDE function-
alities may be used, e.g. refactoring or code genera-
tion. Compared to the editor input events, these func-
tionalities are expected to be executed less frequently.
This can be continued using interactions with version
control systems or continuous integration systems.
Having these characteristics of possible user in-
teractions in mind, there has to be a trade-off between
the level of detail in which interactions are captured,
and the amount of data which is necessary for analy-
ses and for providing assistance. Thus, at the current
state, our approach does neither limit nor prescribe a
specific level of detail for capturing interactions. Fur-
thermore, we aim at getting insights in order to find
reasonable trade-offs for various levels of assistance.
Another discussion of user interaction data granular-
ity for monitoring purposes can be found at (Roehm
et al., 2013).
ENASE 2019 - 14th International Conference on Evaluation of Novel Approaches to Software Engineering
520
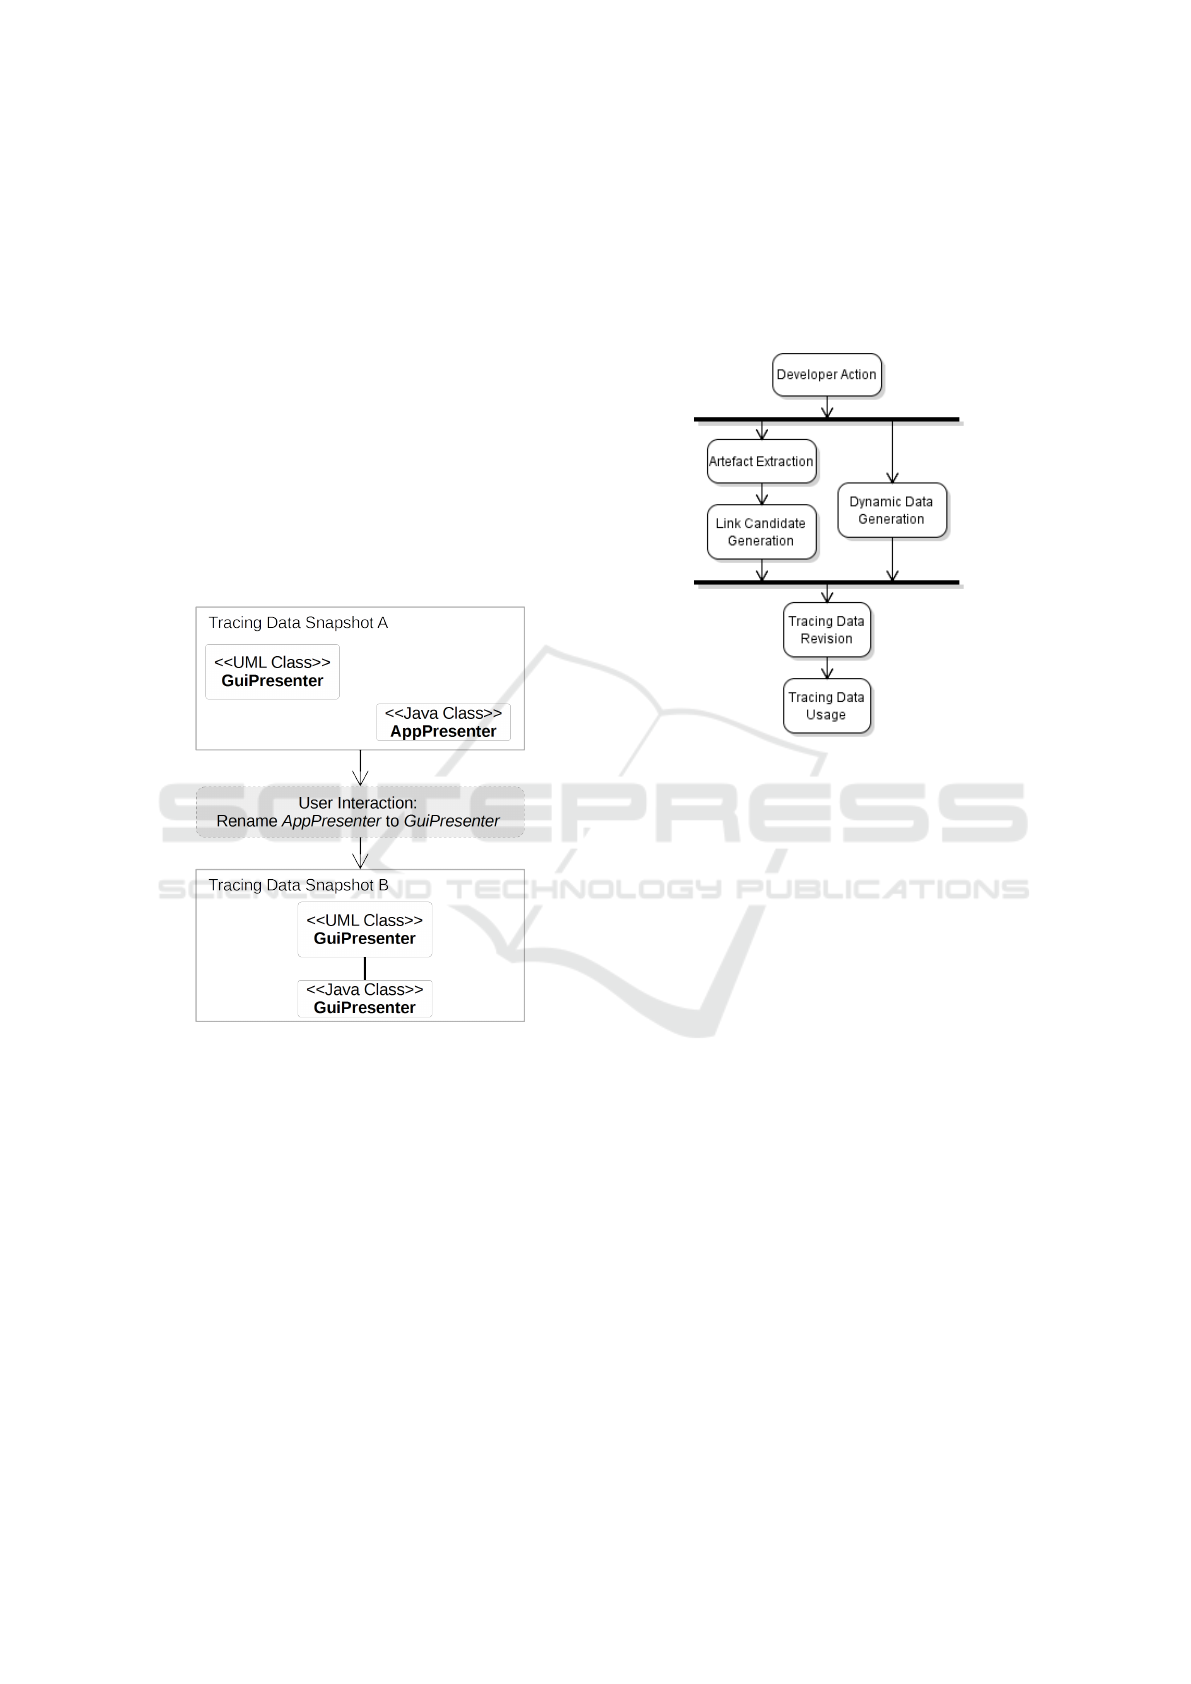
Each developer-tool interaction may result in a
change of the tracing data. For example, adding a
new class to a software implementation also creates
a corresponding artefact in the tracing data. Addi-
tionally, the traceability link extractors may produce
link candidates. A simple example would be creating
source code for a Java class which is named similar
to an element of an UML diagram. An appropriate al-
gorithm for recovering diagram to source code trace-
ability links could detect the matching names and thus
propose a link between the corresponding artefacts.
Figure 1 visualises this idea. The example illustrates
the correlation of static tracing data “snapshots” and
the developer-tool-interactions which our approach is
based on. It also shows that tracing the developer
interactions in our case not only builds upon current
traceability methodology, but furthermore requires it.
Figure 1: Developer-tool interactions transform a static
snapshot to a new one. In this example, the interaction re-
sulted in a trace link between a UML class and a Java class.
4.2 Scenario Description
The basic idea is capturing the static tracing data
along with information about events which influence
it, e.g. developer-tool-interactions. For this, we ac-
cess the tools via the interfaces they provide. These
are used to extract artefact data from the tool con-
tents and to monitor their modifications during tool
runtime. When such changes, i.e. creation, modifica-
tion and deletion, are detected, algorithms for gen-
erating link candidates are automatically executed.
Additionally, information about the interaction which
caused the data change is collected and assigned to
the affected artefact(s). The collected data may be
revised, corrected and completed, if necessary. Af-
terwards further usage of the combined static and dy-
namic tracing data is possible, e.g. for analysis and
visualisation purposes. The overall process is sum-
marised in Figure 2 using a simplified UML activity
diagram.
Figure 2: Simplified UML Activity Diagram of the Involved
Processes from Tracing Data Generation to its Usage.
By using the tool interfaces for gathering arte-
facts, our tracing data enables a technical connec-
tion to their sources, the tools and the actual arte-
facts. Furthermore, the tracing data may refer to ob-
jects which the tools provide during their runtime, e.g.
in-memory content which is not saved in files. This
has the advantage of enabling traceability beyond files
and file contents, but may also induce volatile refer-
ences. A main characteristic of the framework is to
store information about the artefacts and interactions,
which can be seen as meta-data. The actual artefact
contents are not stored, but may be accessed using the
retained references.
Regarding the tracing data granularity, our ap-
proach does not limit the possibilities at this point,
i.e. we don’t prescribe a fixed meta model. In fact,
a basic meta model is implicitly given by the applied
extraction algorithms and tools which create the trac-
ing data. The user is free to extend and adjust the
model or to even use any other meta model. This how-
ever would require some form of additional data and
model transformation. A rule engine and other tools
are provided by the framework to support the user in
this task and to automate it. In the following, we begin
with explaining the static tracing approach and extend
it using dynamic aspects in section 4.2.2.
Using Developer-tool-Interactions to Expand Tracing Capabilities
521
4.2.1 Starting Point: Static Tracing
As we build up upon state-of-the-art tracing method-
ologies, the infrastructure for generating, manag-
ing and using traceability data resembles the ones
of existing approaches. Similar to (Neum
¨
uller and
Gr
¨
unbacher, 2006), we prefer developing a custom
solution with a specialised set of features, instead of
adapting an existing one. Nevertheless, interfacing
the available, more comprehensive traceability envi-
ronments or transferring our approach to these could
be possible in the future.
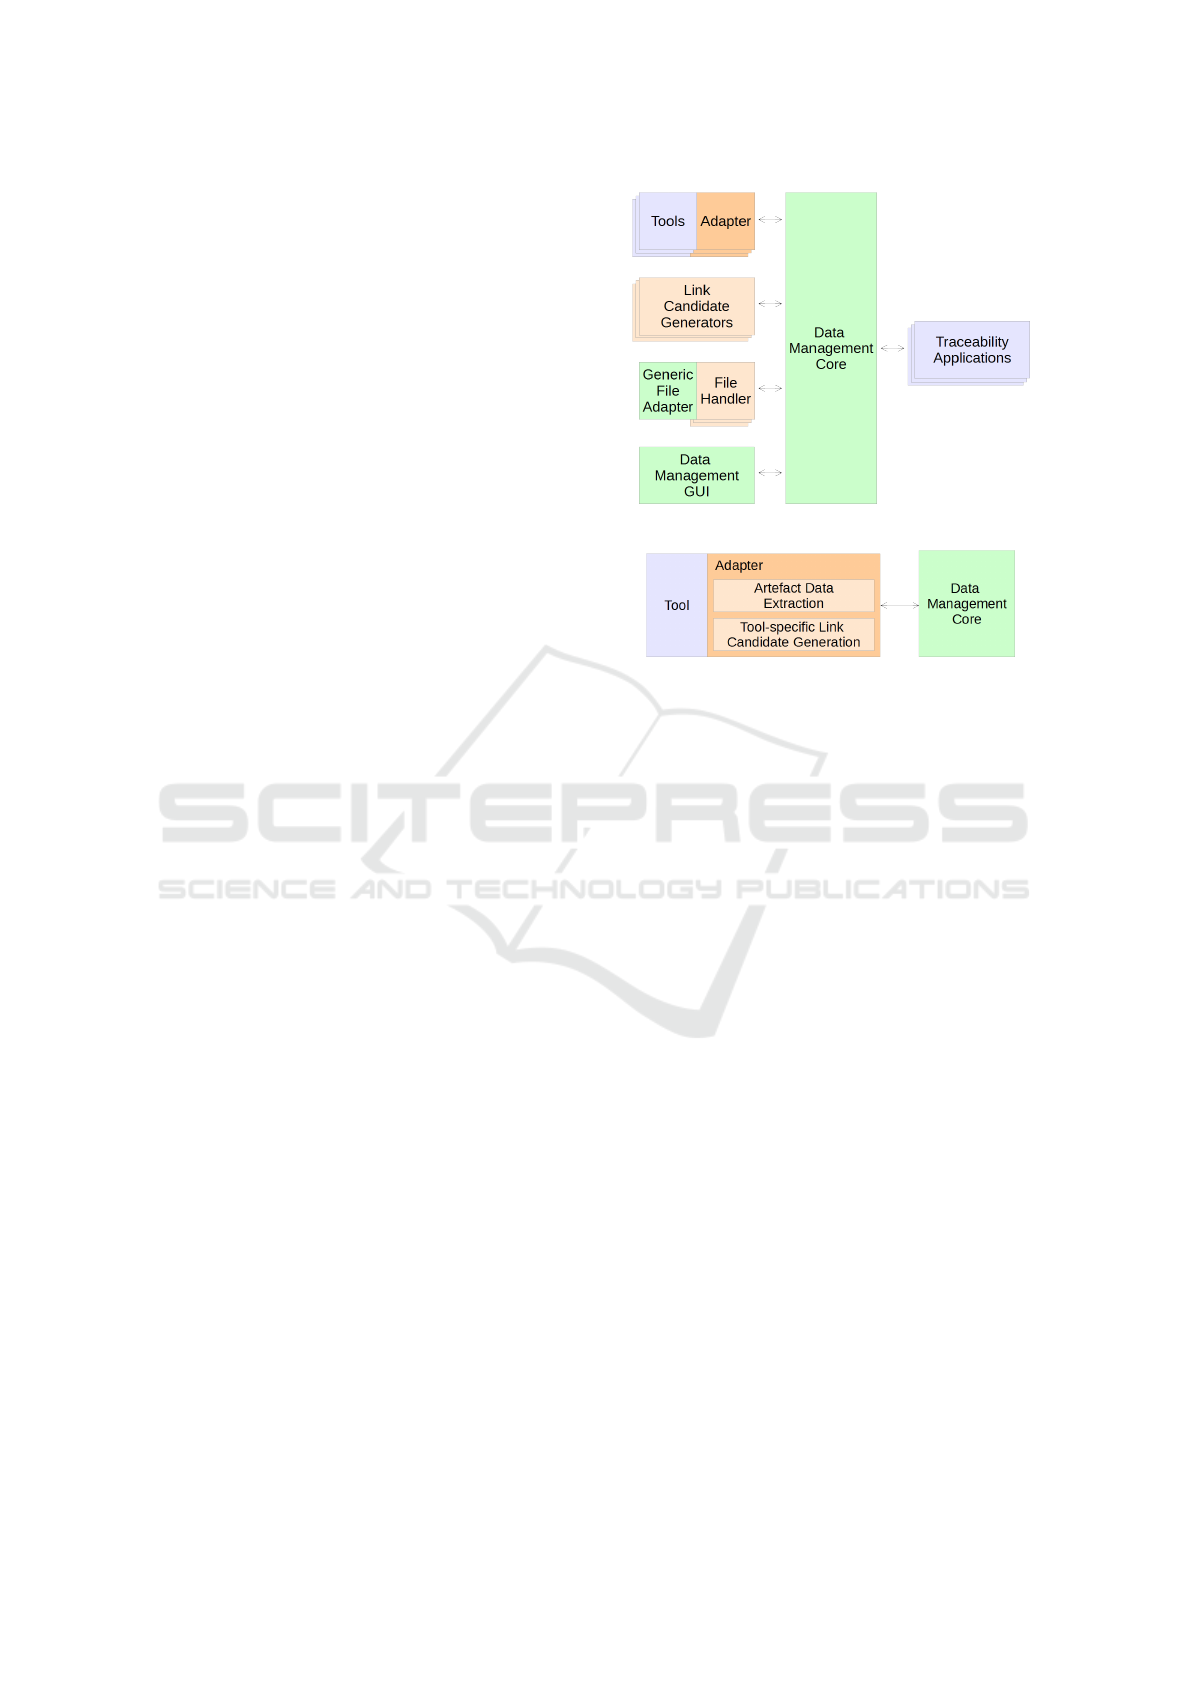
Our framework is designed to enable the steps de-
scribed in section 3 as a basis, which is shown in Fig-
ure 3. The underlying architecture forms a distributed
system, so each arrow in the figure indicates commu-
nications between distributed components. The sub-
sequent explanations of the framework and its ele-
ments follow the order of activities depicted in Fig-
ure 2.
By focusing on the work of the project mem-
bers and their tools, most of the tracing data is ex-
tracted at points where artefacts are directly accessi-
ble. Adapters are used to a) technically integrate the
respective extraction algorithms and b) perform data
transformations if necessary, e.g. equalisation. Ex-
tracted data is assigned to a project and stored using
a central Data Management Core component. Based
on the extracted data, Link Candidate Generators for
creating relation and dependency link suggestions are
executed. A Data Management GUI is provided to
let the user supervise these processes, e.g. by re-
moving undesired link candidates. Additionally, the
user is able to use this component for configuring the
extraction and generation algorithms per project, for
example by adjusting parameters for information re-
trieval methods. Finally, the Data Management Core
provides interfaces to access to the refined traceabil-
ity data for further usage in Traceability Applications,
e.g. for getting comprehensive insights via appropri-
ate data visualisations or for analysing purposes.
Two types of link candidate generators are ap-
plied. At first, tool-specific ones are executed, which
are part of the adapter as shown in Figure 4. Thus,
these algorithms are able to use the tool’s interface in
order to retrieve further information beyond the col-
lected artefact data. Secondly, cross-tool link genera-
tors are used that process artefact data which has been
extracted from multiple tools. For example, this can
be a retrieval method for requirement-to-code links,
using artefacts extracted from an office tool and an
IDE. This second type of link generation is steered by
the Data Management Core. As these generators are
utilised to work in a more global way, they may not
Figure 3: Simplified Architecture Overview.
Figure 4: General Architecture and Context of the Tool-
Adapters.
have an immediate access to the tool interfaces like
the tool-specific ones. Thus, they have to include cus-
tom methods for obtaining additional data from the
artefacts. For example, the mentioned requirement-
to-code link generator may use information retrieval
methods, for which the parsing of requirement docu-
ments is necessary.
In case a tool does not provide a suitable interface
for connecting an adapter, we consider the file system
as a fall-back solution. Files inside project directories,
along with their states, are monitored using a Generic
File Adapter. When the creation or a modification of
a relevant file is detected, two ways for an automated
proceeding are available:
1. basic handling; the file is interpreted as a single
artefact,
2. specialised handling; artefact data is extracted
from the file contents.
While basic handling is available for all file types, a
specialised treatment requires an appropriate extrac-
tor that is capable of parsing and understanding the
file contents.
The user’s tracing data adjustments which are per-
formed via the GUI are executed in the core com-
ponent and, furthermore, also tracked. Otherwise,
the automatically executed generators could re-create
links which the user previously removed. Saving the
user’s decision not only prevents the link re-creation,
it also enables the user to review and possibly change
his/her decision later on. Thus, a removed link is
ENASE 2019 - 14th International Conference on Evaluation of Novel Approaches to Software Engineering
522

rather temporarily hidden from the user than effec-
tively deleted.
The framework is designed in a modular way in
order to enable a simple adaptation for various devel-
opment environments and usages. In Figure 3, these
modular, exchangeable elements are indicated by us-
ing layered boxes. Components like the Link Candi-
date Generators can be added to and removed from
the system in order to fulfil particular requirements.
The green coloured components in the figure form the
framework’s main part and provide interfaces and ex-
tension points to achieve modularity.
To provide an explaining example, we will use
a simple software project development. It consists
of requirement specifications, UML class diagrams
which are designed to meet them and finally Java
classes which implement the UML designs. Devel-
opers create and modify these artefacts using specific
development tools: an office application for writing
requirement documents, a UML diagramming tool
and a Java IDE for implementing the designed sys-
tem. While the UML and Java tools are adapted using
their plugin APIs, the office application does not pro-
vide any suitable interface. Thus, we use the generic
file adapter, along with a specialised handler for re-
quirement files. It is able to parse the documents and
to extract requirement artefacts. The tool adapters,
as well as the file handler, also generate tool-specific
artefact links. Amongst others, these are dependen-
cies between requirements, object-oriented associa-
tions in the diagrams and explicitly implemented us-
ages, e.g. a class instantiating another one. Addi-
tionally, generators for recovering the cross-tool arte-
fact link types requirement-to-diagram and diagram-
to-code are used. The generated tracing data is stored
by the data management core and may, for example,
be accessed to interactively visualise the artefacts and
their relations.
4.2.2 Extension: Dynamic Tracing
Every time an artefact change is detected, e.g. by
capturing a developer-tool interaction, the process
of extracting and generating tracing data (previously
shown in Figure 2) is executed. Thus, the framework
traces what the developers did, which artefacts are af-
fected and how this influenced the tracing data. As the
tool interfaces enable to gain the relevant information
about interactions, this task is performed by the inter-
connecting adapters. Similar to the static tracing data,
the results are sent to and stored in the core compo-
nent. Like in case of the static tracing data, the actual
changes, e.g. added or removed artefact contents, are
not stored at this point. Thus, the information about
interactions also may be characterised as meta-data.
Referring to the considerations of section 4.1, the
types and granularities of the captured interaction data
should not be prescribed. Thus, the adapters can be
configured in order to specify what data has to be cap-
tured. The basic idea is to equip the adapters with
as much capturing capabilities as possible, but let the
user decide which of these are actually to be used.
If the APIs don’t provide the necessary granular-
ity, other ways to access the data have to be used. A
possible solution is the generic file adapter which has
been described in the previous section. Considering
dynamic data, this adapter is able to monitor and pro-
vide three types of events: creation, modification and
deletion of files. This is a starting point for recover-
ing user interactions which occurred between differ-
ent file versions. A simple example would be moni-
toring the creation of a new source file (A) and, after a
while, its modification (B). By comparing the file con-
tents of state A and B, particular user interactions may
be identified, e.g. adding or renaming classes, meth-
ods, variables and so forth. As mentioned before, our
framework core does not store file contents. Thus, it
is up to the file handlers which use the generic adapter
to implement such storage. Of course, this procedure
provided by the generic adapter is rather basic and
doesn’t offer a detailed or immediate interaction anal-
ysis, but it enables a fall-back if no other method is
available.
To pick up the example of the previous chapter, we
add capturing and using dynamic data to it. The tool
adapters which are attached to both, the UML editor
and the IDE, are used to capture information about
the currently selected artefact of each tool. For exam-
ple, switching from a Java class to another inside the
IDE creates a corresponding event which the adapter
is able to catch. Thus, dynamic tracing data is gen-
erated which includes the interaction type artefact se-
lection change, as well as links to the previously and
the currently selected artefact. This data is stored in
the Data Management Core, which allows further us-
age e.g. by suitable algorithms. In this example, the
artefact selection change data is used to provide an
artefact usage history and a tool for suggesting related
artefacts according to the current selection. An exist-
ing approach for this kind of data usage has been pre-
sented by (Singer et al., 2005). Following the frame-
work overview of Figure 3, an overall illustration of
the example is shown in Figure 5, which contains in-
stances of each framework component. For the pur-
pose of simplification, the Data Management Core
and the GUI are represented by a single Data Man-
agement component.
Using Developer-tool-Interactions to Expand Tracing Capabilities
523
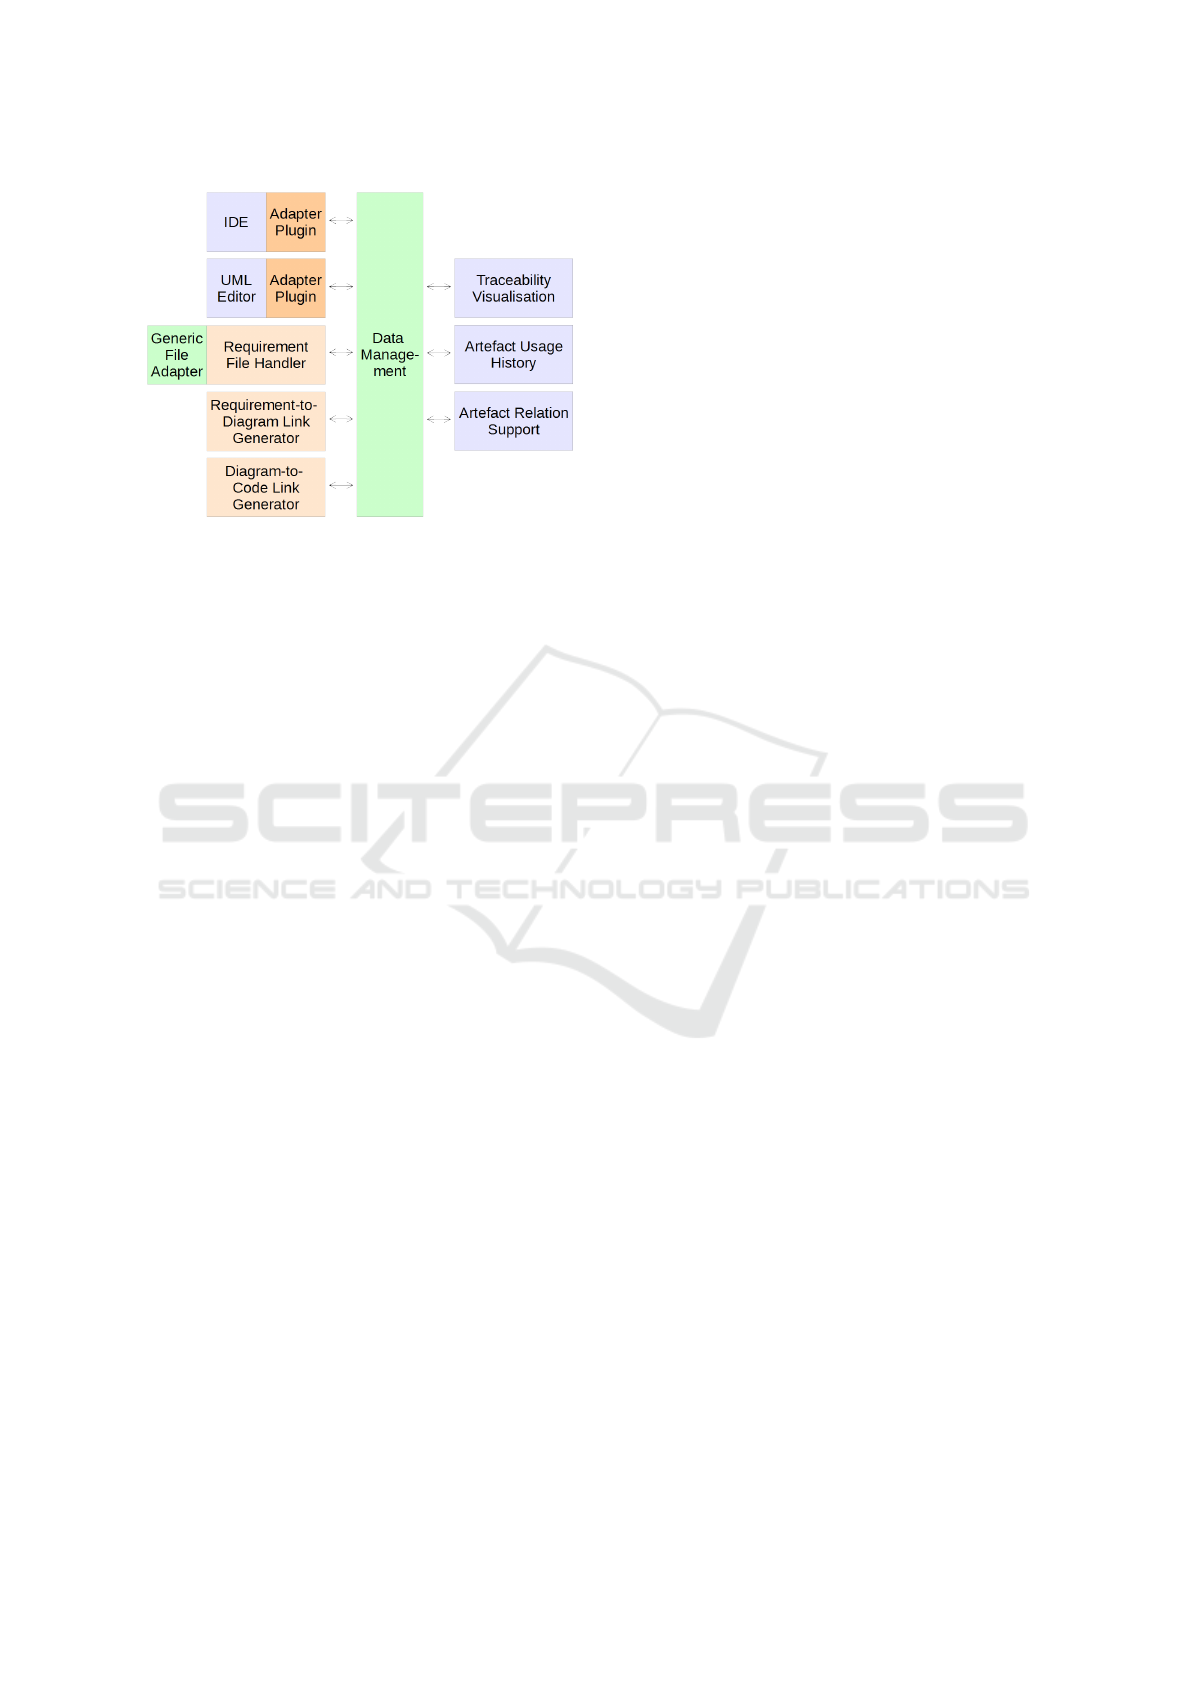
Figure 5: Framework Application Example.
5 DISCUSSION
The presented approach addresses specific problem
areas of software traceability but does not try to cre-
ate an overall solution. Furthermore, we attempt to
bring in another view on traceable aspects and other
possibilities during development processes. We use
results for automating traceability tasks, which have
been part of this topic’s research since many years
(Cleland-Huang et al., 2014). Extending static tracing
data with information about related tool interactions
which influences it picks these existing ideas up and
takes them further. For this, suitable tool interfaces
are necessary in order to capture the desired aspects.
When these interfaces are available, other advantages
also appear, e.g. using them to gain additional insight
about artefact correlations.
The availability of appropriate interfaces is a
sticking point. For various reasons, many tools don’t
provide mechanisms for accessing their internal data.
Another issue is the additionally required develop-
ment of adapters. Due to the technological hetero-
geneity, this is a non-trivial task. As these points are
not limited to the area of traceability, a comprehensive
discussion of such integration aspects can be found at
(Broy et al., 2010). To somehow deal with the lack
of interfacing, we created the generic fall-back solu-
tion which monitors the file system and derives user
interactions from file modifications.
Aside from the technical possibilities which the
available interfaces provide, it is reasonable to gener-
ally think about capturing developer-tool-interactions.
Although our approach does not require a specific
level of detail regarding the interaction data, the possi-
bilities to assist the developer and the software trace-
ability may be coupled to it. This leads to the emerg-
ing, open question: How does the data’s level of de-
tail influence the possible level of support? A related
aspect is privacy. Developers probably don’t like to
have every working step tracked, as this could lead
to forms of surveillance which are contrary to our in-
tention of support and assistance. Also, for extending
our approach, it would be desirable to include addi-
tional sources developer use, e.g. web searches for
getting help with particular errors. While this, on the
one hand, could enable helping developers to solve
problems others have already coped with, it may on
the other hand be regarded as an undesired behaviour
tracking. We will carry on including such consider-
ations in our work and examine how our approach
could support finding a suitable trade-off.
The initial idea behind our approach originates
from the general software development field and thus
is primarily based on the corresponding tools and pro-
cesses. Considering related or even more specialised
domains seems to provide helpful input in order to
increase the possibilities to assist and support devel-
opers. Beyond that, this could enhance the frame-
work’s applicability. Currently considered domains
are computer-aided design (CAD) and system mod-
elling, especially model-driven development of em-
bedded systems.
6 CONCLUSIONS
We propose an approach which captures developer-
tool-interactions in order to enrich the data current
traceability methodologies usually focus on. This
capturing is achieved by connecting to available in-
terfaces of development tools, e.g. the plug-in API
of an IDE. As the interactions result in a frequent
change of the traced artefacts, we call this enrich-
ment dynamic tracing data. A goal of this approach
is to enable support and assistance throughout de-
velopment processes. As an example, the dynamic
traces could be analysed in order to offer the devel-
oper know-how others gained in similar processes or
situations. Therefore, our approach combines exist-
ing research in the fields of software traceability and
developer-interaction-analysis.
Currently, we aim at further simplifying the
framework’s extensibility, especially for integrating
additional tracing data extractors, link candidate gen-
erators, and finally the applications which use the cap-
tured and refined traceability data. Amongst others,
these will be algorithms which perform data analyses
in order to enable the intended developer support. A
present limitation of our framework is focussing on
development tools which are actually desktop appli-
cations. We intend to include online services, e.g. by
ENASE 2019 - 14th International Conference on Evaluation of Novel Approaches to Software Engineering
524

providing eligible adapters.
ACKNOWLEDGEMENTS
This work is supported by the InProReg project.
InProReg is financed by Interreg 5A Deutschland-
Danmark with means from the European Regional
Development Fund.
REFERENCES
Aizenbud-Reshef, N., Nolan, B. T., Rubin, J., and Shaham-
Gafni, Y. (2006). Model traceability. IBM Systems
Journal, 45(3):515–526.
Anquetil, N., Kulesza, U., Mitschke, R., Moreira, A.,
Royer, J.-C., Rummler, A., and Sousa, A. (2010).
A model-driven traceability framework for soft-
ware product lines. Software & Systems Modeling,
9(4):427–451.
Asuncion, H. U., Asuncion, A. U., and Taylor, R. N. (2010).
Software traceability with topic modeling. In 2010
ACM/IEEE 32nd International Conference on Soft-
ware Engineering, volume 1, pages 95–104.
Broy, M., Feilkas, M., Herrmannsdoerfer, M., Merenda, S.,
and Ratiu, D. (2010). Seamless model-based devel-
opment: From isolated tools to integrated model en-
gineering environments. Proceedings of the IEEE,
98(4):526–545.
Cleland-Huang, J., Gotel, O. C. Z., Huffman Hayes, J.,
M
¨
ader, P., and Zisman, A. (2014). Software traceabil-
ity: Trends and future directions. In Proceedings of
the on Future of Software Engineering, FOSE 2014,
pages 55–69, New York, NY, USA. ACM.
Damevski, K., Shepherd, D., Schneider, J., and Pollock, L.
(2017). Mining sequences of developer interactions in
visual studio for usage smells. IEEE Transactions on
Software Engineering.
Gotel, O. C. and Finkelstein, C. (1994). An analysis of the
requirements traceability problem. In Requirements
Engineering, 1994., Proceedings of the First Interna-
tional Conference on, pages 94–101. IEEE.
Haouam, M. Y. and Meslati, D. (2016). Towards automated
traceability maintenance in model driven engineering.
IAENG International Journal of Computer Science,
43(2):147–155.
Hartmann, B., MacDougall, D., Brandt, J., and Klemmer,
S. R. (2010). What would other programmers do:
Suggesting solutions to error messages. In Proceed-
ings of the SIGCHI Conference on Human Factors in
Computing Systems, CHI ’10, pages 1019–1028, New
York, NY, USA. ACM.
Li, Y. and Maalej, W. (2012). Which traceability visualiza-
tion is suitable in this context? a comparative study.
In Regnell, B. and Damian, D., editors, Requirements
Engineering: Foundation for Software Quality, pages
194–210, Berlin, Heidelberg. Springer Berlin Heidel-
berg.
Maalej, W. and Sahm, A. (2010). Assisting engineers in
switching artifacts by using task semantic and interac-
tion history. In Proceedings of the 2nd International
Workshop on Recommendation Systems for Software
Engineering, pages 59–63. ACM.
Mahmoud, A. and Niu, N. (2013). Supporting requirements
traceability through refactoring. In 2013 21st IEEE
International Requirements Engineering Conference
(RE), pages 32–41.
Neum
¨
uller, C. and Gr
¨
unbacher, P. (2006). Automating soft-
ware traceability in very small companies: A case
study and lessons learned. In 21st IEEE/ACM Interna-
tional Conference on Automated Software Engineer-
ing (ASE’06), pages 145–156.
Noyer, A., Iyenghar, P., Engelhardt, J., Pulvermueller, E.,
and Bikker, G. (2017). A model-based framework
encompassing a complete workflow from specifica-
tion until validation of timing requirements in em-
bedded software systems. Software Quality Journal,
25(3):671–701.
Palihawadana, S., Wijeweera, C. H., Sanjitha, M. G. T. N.,
Liyanage, V. K., Perera, I., and Meedeniya, D. A.
(2017). Tool support for traceability management
of software artefacts with devops practices. In 2017
Moratuwa Engineering Research Conference (MER-
Con), pages 129–134.
Roehm, T., Gurbanova, N., Bruegge, B., Joubert, C., and
Maalej, W. (2013). Monitoring user interactions for
supporting failure reproduction. In 2013 21st In-
ternational Conference on Program Comprehension
(ICPC), pages 73–82.
Roehm, T. and Maalej, W. (2012). Automatically detecting
developer activities and problems in software develop-
ment work. In Proceedings of the 34th International
Conference on Software Engineering, ICSE ’12, pages
1261–1264, Piscataway, NJ, USA. IEEE Press.
Singer, J., Elves, R., and Storey, M. . (2005). Nav-
tracks: supporting navigation in software mainte-
nance. In 21st IEEE International Conference on Soft-
ware Maintenance (ICSM’05), pages 325–334.
Snipes, W., Murphy-Hill, E., Fritz, T., Vakilian, M.,
Damevski, K., Nair, A., and Shepherd, D. (2015). A
practical guide to analyzing ide usage data. The Art
and Science of Analyzing Software Data.
Walderhaug, S., Johansen, U., Stav, E., and Aagedal, J.
(2006). Towards a generic solution for traceability in
mdd. In ECMDA Traceability Workshop (ECMDA-
TW), pages 41–50.
Wijesinghe, D. B., Kamalabalan, K., Uruththi-
rakodeeswaran, T., Thiyagalingam, G., Perera,
I., and Meedeniya, D. (2014). Establishing trace-
ability links among software artefacts. In 2014 14th
International Conference on Advances in ICT for
Emerging Regions (ICTer), pages 55–62.
Using Developer-tool-Interactions to Expand Tracing Capabilities
525
