
How Pupils Solve Online Problems: An Analytical View
Carlo Bellettini, Violetta Lonati, Mattia Monga and Anna Morpurgo
Department of Computer Science, Universit
`
a degli Studi di Milano, Italy
Keywords:
Computing Education, Computational Thinking, Informatics Contests, Learning Analytics, Problem-solving
Process.
Abstract:
More and more assignments that were traditionally executed with paper and pencil are now carried out with
the support of specific software applications or learning platforms. This opens the possibility to automatically
collect a number of data concerning the way pupils interact with the system that administers the learning
activity, and such information can help teachers monitor and understand how pupils engage with the assigned
task. In the paper we propose a multidimensional model for describing the interactions of pupils with such
systems, and we show how we apply it in the context of the Bebras Challenge, an international initiative aimed
at introducing the fundamental concepts of informatics to a wide audience of pupils.
1 INTRODUCTION
Thanks to the pervasiveness of digital technologies in
schools, many learning activities that were tradition-
ally carried out with paper and pencil, now rely more
and more on the support of specific software applica-
tions or learning platforms. Thus, in principle a num-
ber of data on the ways pupils interact with the system
can be automatically collected and such information
can help teachers monitor and understand how pupils
engage with the assigned tasks.
This is especially interesting when such tasks are
sophisticated, i.e., they present open-answer ques-
tions, are interactive, or require complex, combined
answers (Boyle and Hutchison, 2009). In such cases,
besides the typical information concerning the con-
tent, i.e., the answers or artifacts that pupils submit to
the system, also the problem-solving process they use
in reaching their final answer deserves a careful ob-
servation. When the learning process happens in the
classroom, it can be observed using qualitative tech-
niques, as for instance those derived from ethnogra-
phy approaches. Some research has also been con-
ducted on exploiting smart environments or digital
tangibles to collect data on the interactions going on
in the group, see for example (Bonani et al., 2018). In
this paper we focus on quantitative data: how much
time pupils spend on each specific part of the as-
signment, whether and when they come back and re-
view/change their answer to a task already completed,
whether they perform actions that generate feedback
from the system, and so on. While almost all e-
learning platforms are able to log the high-level in-
teractions of the learners with the system, namely ar-
tifact exchanges and forum messages (and this data is
more and more useful for building predictive learning
analytics models, see (Mullan et al., 2017)), they are
often surprisingly poor in their ability to track fine-
grained learners data (Ruiz et al., 2014).
We adapted the platform we use for managing an
informatics contest, in order to be able to collect this
kind of fine-grained data related to the problem solv-
ing activity of the pupils during the contest. We are
not as much interested here in the statistical analysis
of such data, as in the possibility of providing teach-
ers with a useful presentation thereof, which can be
a starting point for their understanding of how their
pupils engaged with the assignment. To this goal,
in this paper we propose a multidimensional model
for describing the interaction of pupils with a learn-
ing platform. Moreover, we show how we applied it
to the scope of the Bebras Challenge, an international
initiative aimed at introducing the fundamental con-
cepts of informatics to a wide audience of pupils, in
order to give the teachers a rich feedback about how
their students experienced the contest.
The paper is organized as follows. In Sect. 2 we
propose some measures, thus defining a multidimen-
sional model to describe interactions with a learning
platform during a learning activity. In Sect. 3 we de-
scribe the scenario in which we applied the model,
that is the Bebras Challenge, the platform used to ad-
minister the contest, and how we equipped it in or-
der to collect data about the contestants’ interactions
132
Bellettini, C., Lonati, V., Monga, M. and Morpurgo, A.
How Pupils Solve Online Problems: An Analytical View.
DOI: 10.5220/0007765801320139
In Proceedings of the 11th International Conference on Computer Supported Education (CSEDU 2019), pages 132-139
ISBN: 978-989-758-367-4
Copyright
c
2019 by SCITEPRESS – Science and Technology Publications, Lda. All rights reserved

with the platform. In Sect. 4 we present a tool that
provides teachers with a visual representation of in-
teraction data of their teams. In Sect. 5 we draw some
conclusions and outline further developments.
2 A MODEL FOR INTERACTION
In this section we consider how pupils interact with a
system that supports a learning activity; we propose
some measures and indicators, thus defining a mul-
tidimensional model that enables us to describe the
interaction of learners with the system.
The model has been designed by taking into con-
sideration our experience in organizing the Italian Be-
bras Challenge, but it applies as well to other learning
environments where learners:
• are engaged in a sequence of tasks that can be ad-
dressed in any order;
• always have the possibility to go back to tasks and
possibly change an answer given earlier;
• can possibly get feedback about the submitted an-
swers;
• have a fixed limited time to complete the tasks.
In particular, the model considers two aspects of
the learners’ behavior: the engagement (e.g. the
learner stays for a long or short time on a specific
task, once only or revisiting it) and the interaction
mode (e.g. the learner reads/watches/thinks or acts).
These aspects are complex and cannot be directly ob-
served and measured by a unique variable. Instead we
introduce a pool of simple indicators that are clearly
related to engagement and interaction mode: by con-
sidering these indicators together we get a model of
the learners’ interaction behavior.
In order to do that we distinguish between three
levels of activity on a task at a given time.
Level 0 no activity: another task is displayed.
Level 1 reading/watching/thinking: the task is dis-
played but there is no action, hence the pupil is
reading the text, or watching the included images
and diagrams, or thinking about the task.
Level 2 acting: the pupil is inserting or changing the
answer of the task, or is doing an action that gets
a feedback from the system.
To describe the interaction of a learner on any single
task, we propose the following indicators:
1. initialReadingTime: time spent on the task before
the first interaction;
2. firstSessionTime: length of the first session spent
on the task;
3. totalTime: total time spent on the task;
4. displaySessions: number (possibly 0) of
read/watch/think sessions, i.e., without action;
5. dataSessions: number (possibly 0) of sessions
with some action;
6. actionTime: total time spent acting on the task;
7. feedback: number of actions that got feedback
from the system.
For instance, a team that uses an unreflexive trial-and-
error approach would show short initialReadingTime
but high actionTime and feedback. On the other hand,
a significant initialReadingTime with high displaySes-
sions and low dataSessions would describe the be-
haviour of a careful motivated team that thinks a lot
on the solutions, goes back and checks them, but does
not modify them often.
3 APPLICATION SCENARIO
In this section we describe the scenario in which we
applied the model presented in the previous section,
that is the Italian Bebras Challenge. First we recall
its main features, then we describe the platform used
to administer the contest, and how we equipped it in
order to collect data about the interactions of contes-
tants with the system.
The Bebras Challenge. The Bebras chal-
lenge
1
(Dagien
˙
e, 2009; Haberman et al., 2011;
Dagien
˙
e and Stupuriene, 2015), is a popular initiative
aimed at introducing the fundamental concepts of in-
formatics to a wide audience of pupils. The challenge
is organized on an annual basis in several countries
since 2004, with almost 2 million participants from
43 countries in the last edition.
Participants have to solve a set of about 10-15
tasks that are designed to be fun and attractive, ad-
equate for the contestants’ age, and solvable in an av-
erage time of three minutes (although it is not easy
to predict the difficulty of tasks (van der Vegt, 2013;
Bellettini et al., 2015; Lonati et al., 2017b; van der
Vegt, 2018)). Bebras tasks are more and more used
as the starting points for educational activities carried
out by teachers during their school practice (Dagien
˙
e
and Sentance, 2016; Lonati et al., 2017a; Lonati et al.,
2017c).
In Italy (ALaDDIn, 2017) the Bebras Challenge
is proposed to five categories of pupils, from pri-
mary (4
th
grade and up) to secondary schools, who
participate in teams of at most four pupils. Teams
access a web platform (Bellettini et al., 2018) that
presents the tasks to be solved. There are differ-
ent types of questions: multiple choice, open answer
with a number/text box, drag-and-drop, interactive,
1
http://bebras.org/
How Pupils Solve Online Problems: An Analytical View
133
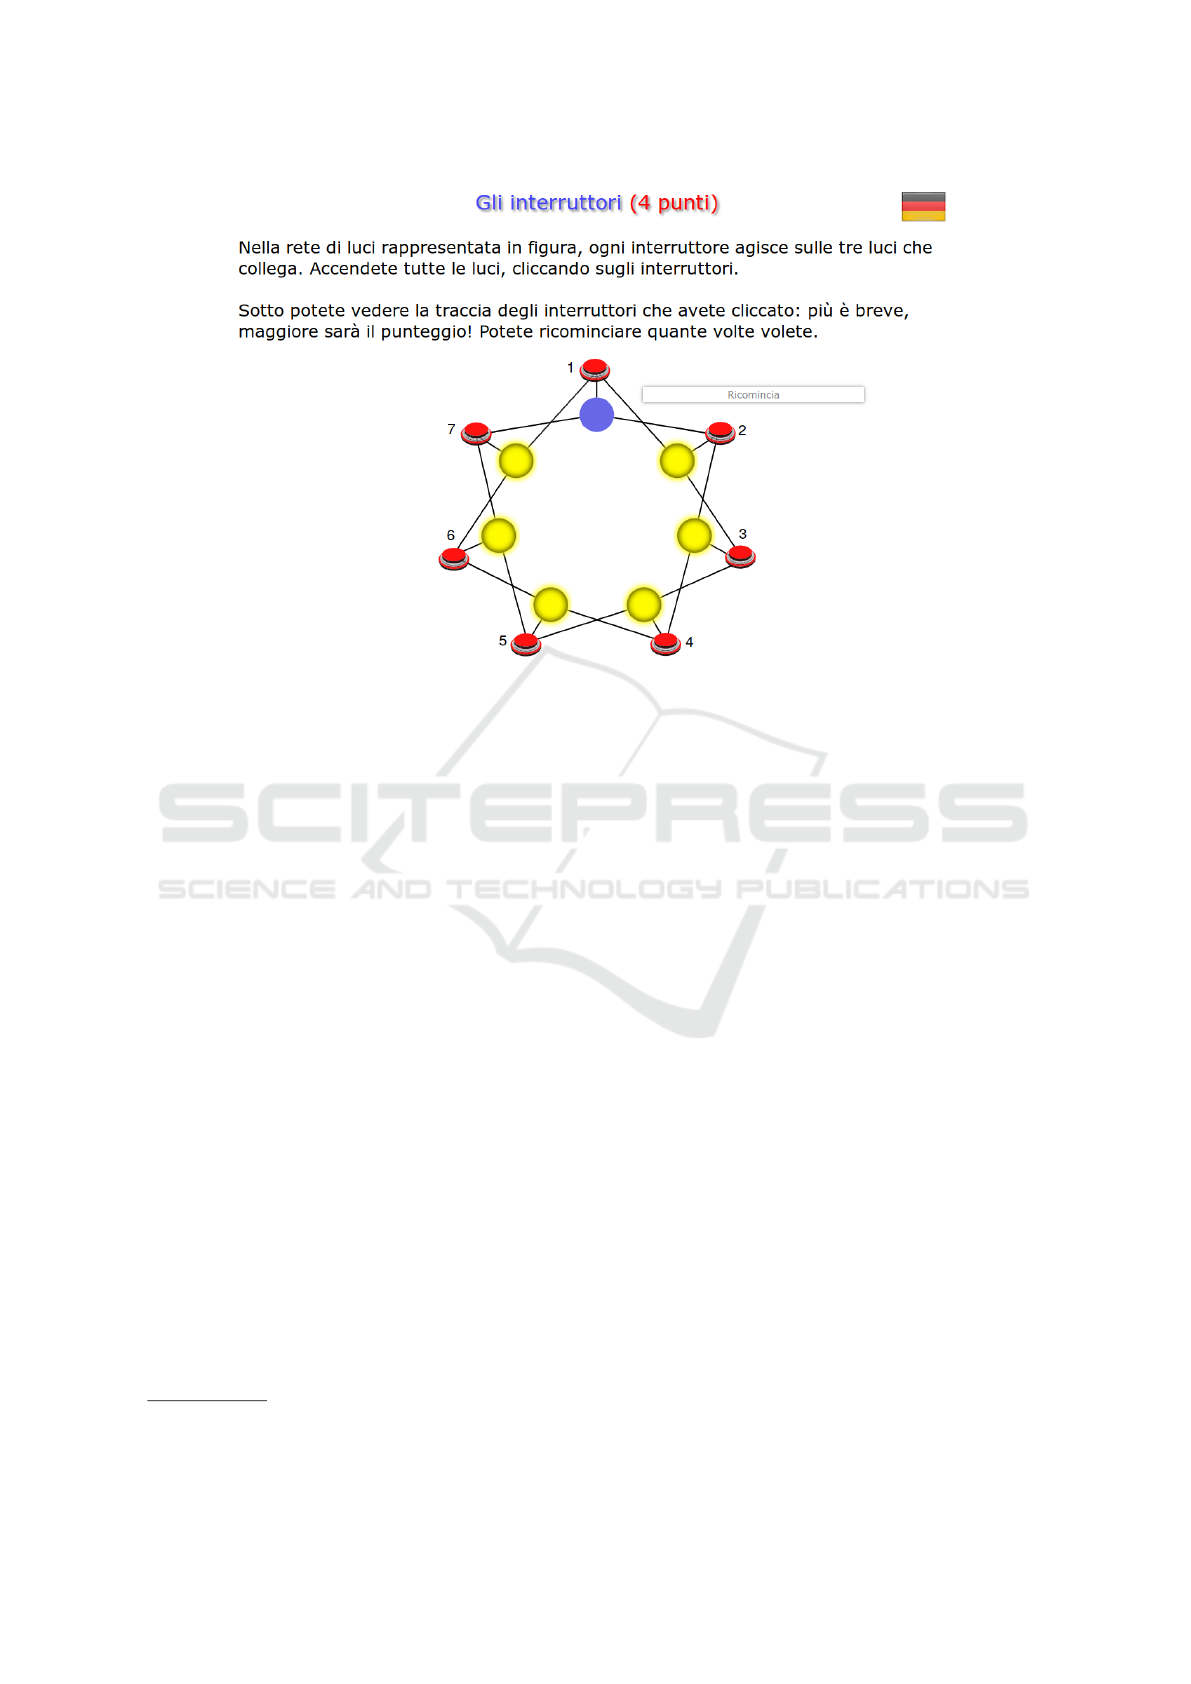
Figure 1: An interactive tasklet.
and so on. Occasionally some automatic feedback is
provided, especially by interactive tasks (for instance
when clicking on a “simulation” button). An example
of interactive task is presented in Figure 1: each red
button controls the three connected lights, the goal is
to switch on all the lamps (one can restart from the
beginning state by clicking on “Ricomincia”)
2
.
The 2018 edition saw the participation of 15,738
teams (51634 pupils, since not every team had four
members), with five categories, see Table 1; each cat-
egory had 12 tasks to be solved within 45 minutes.
The Italian Bebras Platform. In our country, the
web application that presents the tasks to be solved
was designed as a multifunctional system to support
all phases of the competition: task editing and par-
ticipants’ registration and training before the contest;
tasks’ administration, monitoring, and data collection
during the contest; scoring, access to solutions, and
production of participation certificates after the con-
test. For a detailed description of the architecture and
implementation of the system, see (Bellettini et al.,
2018).
Each task is designed to occupy exactly the full
screen, no matter what the device used; in the side-
bar, active zones with numbers allow to move be-
tween tasks and a task can be entered as many times as
wished –we say that, each time a task is entered, a new
2
The task was proposed by the German Bebras organiz-
ers.
session on the task starts. Answers can be changed in
every moment, since they are submitted for evalua-
tion only when either the contestant ends the contest
or the allowed time is over. Moreover, it is possible to
insert a partial answer and complete it in a later ses-
sion, since tasks that have already been seen appear
exactly as they were when the last session ended.
The contest system was already designed to record
several pieces of information, mostly needed to sup-
port ordinary operations related to the contest. In par-
ticular, before the contest the system collects some
data about the composition of teams (age, gender, and
grade of each member) and their school (geographical
data, number of participating teams, number of teach-
ers involved in Bebras). While a team is taking part
in the contest, the system stores the current state of
each task, determined by the data currently inserted
by the team and relevant to compute the score gained
in the task. When the allowed time ends, the current
state of each task is considered final and recorded as
the submitted answer for the task.
We instrumented our system by adding some trac-
ing features, hence now a significant amount of data
is tracked during the contest. In particular the sys-
tem, besides collecting the submitted answers, now
also tracks, for each team, a number of events during
the team’s interactions with the platform: all events
that allow a team to select and display a different task,
by clicking on the numbers or arrows in the side-bar;
those pertaining to the insertion of (part of) an an-
swer, e.g., by typing, selecting a multiple choice op-
CSEDU 2019 - 11th International Conference on Computer Supported Education
134

Table 1: Participation to the Italian Bebras, edition 2018.
Category teams pupils females males average number of
team members
grades 4-5 3770 12670 6107 (48.2%) 6563 (51.8%) 3.75
grades 6-7 5592 18437 8793 (47.7%) 9644 (52.3%) 3.74
grade 8 2651 8900 4144 (46.6%) 4756 (53.4%) 3.74
grades 9-10 2070 6669 2015 (30.2%) 4654 (69.8%) 3.70
grades 11-12-13 1655 4958 1491 (30.1%) 3467 (69.9%) 3.68
Total: 15738 51634 22550 (43.7%) 29084 (56.3%)
tion, selecting an option in a scroll-bar menu, drag-
ging and dropping an object, clicking on an active part
of the screen, and so on; those to get feedback (e.g.,
by clicking on a simulation button).
For each tracked event the system logs a time-
stamp, the type of event (enter a task, change the
state of the task, get feedback, leave the task), and
all changes in the state of the task, if any.
4 VISUALIZATION TOOL
In this Section we present a tool that provides teachers
with a visual representation of several data describing
the interaction behavior of Bebras contestants with
the system, also in comparison with the average be-
havior of contestants of the same age.
The tool processes the event-tracking data col-
lected by the Bebras platform described in Sec. 3.
Some data are filtered out before processing due to
either the inconsistency of the collected data, or sus-
pects of cheating, or anomalies derived from techni-
cal issues occurred during the contest. For instance,
the cohort of primary school pupils that participated
in the Italian Bebras contest in 2018 includes 3770
teams (of 4 pupils each at most), among which 350
teams were filtered out.
The tool displays diagrams in the dashboard that
teachers use to manage teams’ registration and to
check scores and rankings: such diagrams illustrate
the detailed behavior of any specific team both on
the overall challenge and on each specific task, and
present summary views of indicators for tasks and
teams.
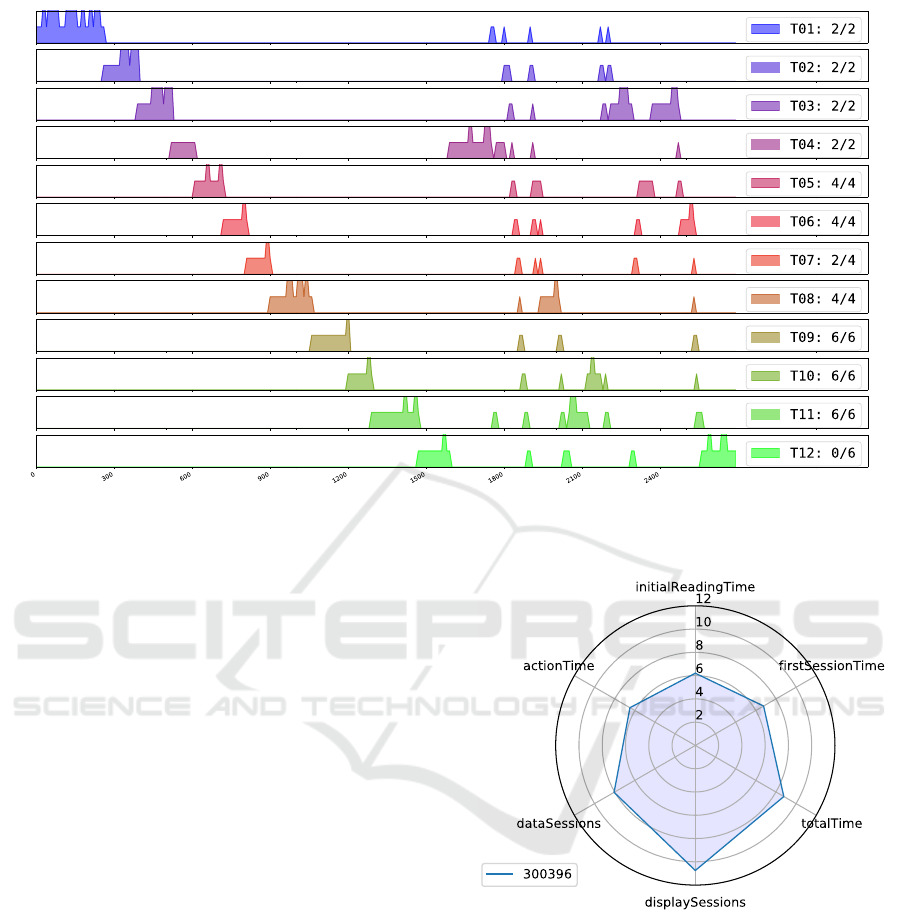
The visual representation of the behavior of a team
during its contest is given by a diagram as in Figure 2,
depicting, for each task, the level of activity on each
time slot of 10 seconds; when the team goes from a
task to another one, the plots of the two tasks overlap
slightly. The legend shows also the score gained by
the team in each task. In this particular case, the team
tackled the tasks in the order they were presented, and
inserted answers in the first session of each task ex-
cept the fourth; on the first task (a simple program-
ming task that provided feedback) the team started
almost immediately to act, and spent some time to
insert/edit the right answer; on the following tasks,
instead, the initial reading times were longer (as illus-
trated in the plot by the plateaus preceding the picks),
i.e. answers were inserted after some time devoted to
reading and thinking abut each task; after about 27
minutes from the start (more or less half the available
time of 45 minutes) the team reached the last task and
then went back directly to the task with the missing
answer, thought about it a little while more, inserted
the answer and then changed it in the same session;
afterwards the team started reviewing all tasks again
from the first one, and changed some of the previ-
ously inserted answers; finally, the team focused back
on some chosen tasks (interestingly enough, the work
done in the last two minutes on the last task did not
lead to the correct answer).
The event-tracking data for a team are also used to
compute the measures described in the previous sec-
tion, which summarize the behavior of that team on
each task, see Table 2. In particular, we compute the
actionTime as follows: the allowed time is divided
into brief time slots (10 seconds each); the number
of time slots where an action occurs are counted, and
the resulting number is multiplied by the duration of
slots. Moreover, when counting sessions, we do not
consider sessions that last less than 5 seconds, which
occur mainly when the contestants are searching for a
task and click quickly on the side-bar to find the de-
sired one.
In order to place the behavior of a single team
among other teams, we compute, for each task, the
mean, variance, min, max, and quartiles –over all
contestants– of each indicator, see Table 3. Since the
indicators have different variability ranges, we stan-
dardize their values
3
. Figure 4 shows the behavior
of a team on a single task, in comparison with the
overall behaviors of teams: red dots correspond to the
values in the row of Table 2 associated with the task,
3
The standard value are obtained by subtracting the
mean value and dividing by the standard deviation.
How Pupils Solve Online Problems: An Analytical View
135
seconds
Figure 2: Time line of a team. The level of activity (no activity, reading/thinking, acting) for each task is shown in each time
slot of 10 seconds.
whereas each box summarizes the overall distribution
of the corresponding standardized indicator over all
teams, by depicting quartiles with min and max val-
ues. In these plots the upper whiskers are typically
much longer than the lower ones, even though they
represent equally numerous sets of teams, and this is
due to the fact that all indicators have 0 as lower up-
per bound but they are not similarly bounded from
above. Indicators that are outside boxed interval can
be used by teachers as hints (not alarms) –specific of
the team– that can guide the interpretation of the time-
line plot and other diagrams for the team.
The general behavior of any team during the
whole activity with respect to any indicator can be
shortly described by the sums, over all tasks, of the
ranking of the team compared to other teams. We call
this sum the ranking index of the team for that indi-
cator. For instance, if a team have usually devoted a
high time to initial reading, resulting in a high rank-
ing on many tasks with respect of this indicator, it will
have a high ranking index for the initialReadingTime
indicator. The set of ranking indices for a given team
are visualized in a radar chart with a dimension for
each indicator, see Figure 3. In this particular case,
for instance, the team shows a tendency for displaying
the tasks more repeatedly than in the average teams,
which indeed is suggested by the plot in Figure 2.
Radar diagrams can be used also to compare the
behavior of different teams under the light of the
data (possibly weighting the analytical data with their
Figure 3: Radar plot of the ranking indexes of a team, rep-
resenting the general behavior of the team during the whole
activity.
knowledge of the team members). For instance, in
Figure 5 two other teams are added: the blue team,
as already seen, liked to come back several times on
the same tasks: they probably thought a lot on their
solutions, but they did not modify them too often; the
red team has a very low disposition towards spend-
ing time on tasks (here a high score could be suspi-
cious); the green team, finally, acted soon and often
without thinking long before acting, and showing in
some sense an impulsive trait.
CSEDU 2019 - 11th International Conference on Computer Supported Education
136
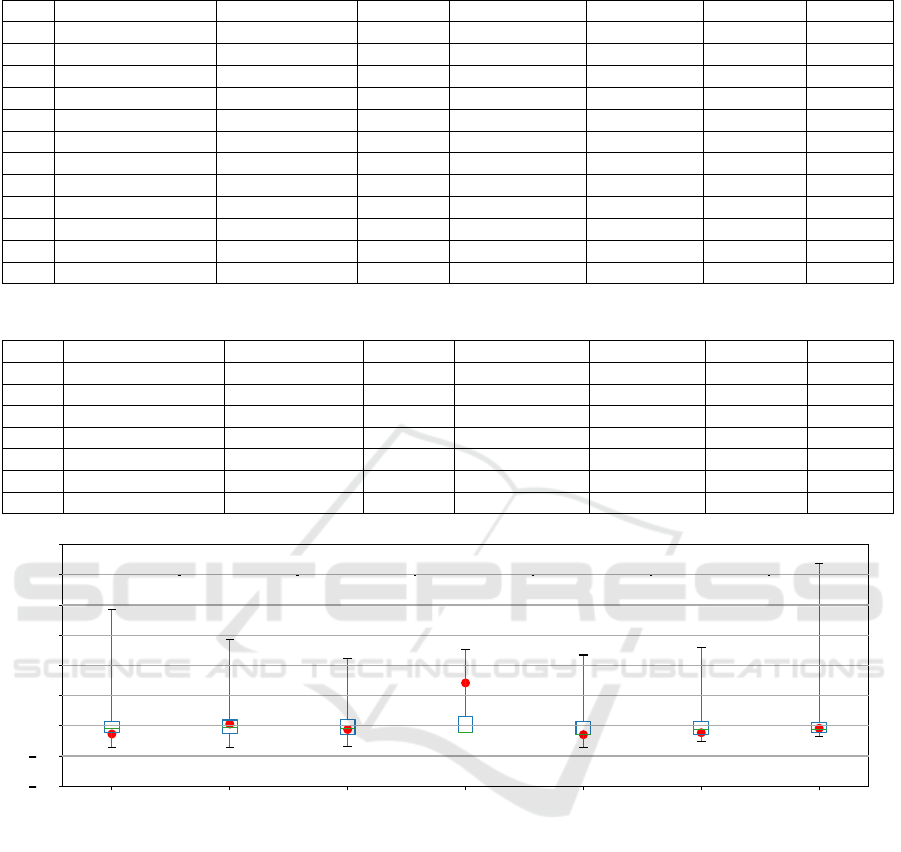
Table 2: Indicators for a team in each task.
initialReadingTime firstSessionTime totalTime displaySessions dataSessions actionTime feedback
T01 30 264 288 3 1 31 9
T02 67 133 157 1 1 7 0
T03 54 129 327 2 3 25 0
T04 166 85 287 3 1 3 0
T05 53 110 190 3 1 2 0
T06 85 90 170 3 2 2 0
T07 87 94 125 2 1 1 0
T08 70 159 235 1 2 7 0
T09 143 146 161 1 1 1 0
T10 71 83 154 1 2 7 0
T11 129 182 305 4 2 4 0
T12 100 116 300 3 2 6 0
Table 3: Mean, standard deviation and five-number summary –over all contestants– of all indicators for a task.
initialReadingTime firstSessionTime totalTime displaySessions dataSessions actionTime feedback
mean 47.38 244.38 348.33 0.42 1.67 54.95 11.64
std 25.68 133.35 198.36 0.73 0.91 41.96 13.10
min 1 2 10 0 0 0 0
25% 33 155 202 0 1 25 4
50% 42 221 299 0 1 42 8
75% 56 309 448 1 2 71.25 15
max 294 1198 1447 5 7 327 188
initialReadingTime
5.0
2.5
0.0
2.5
5.0
7.5
10.0
12.5
15.0
firstSessionTime totalTime displaySessions dataSessions actionTime feedback
Figure 4: Indicators of a team on a task, in comparison with the overall behaviors of all teams on that task. On this task, in
particular, the team shows a notably high number of display sessions w.r.t. the other teams.
5 CONCLUSION
Observing the problem-solving process pupils use in
reaching their final answer to a given task deserves a
careful observation, but it can be troublesome when
using a computer platform. We propose a multidi-
mensional model for describing the interactions of
pupils with a learning platform. Fine-grained data
related to the problem solving activity of pupils dur-
ing a learning activity can be used to yield a number
of indicators that describe the interaction of a learner
with the platform on any single task; this can support
teachers in monitoring and understanding how pupils
engage with the assigned tasks. We instrumented our
web based contest platform to collect such data dur-
ing the 2018 Bebras Challenge in our country and ap-
plied such model to study the behavior of contestants,
also offering to teachers a terse visual representation
of these data. We think that such data and derived ob-
servations, conveniently elaborated, can help teachers
in getting the most from the education potential of the
Bebras contest or other monitored activity adminis-
tered with a similar system.
The proposed model could be enriched by further
dimensions, e.g. indicators about whether or how the
interactions make the score higher or lower. More-
over, more data could be collected, for example the
ending time of simulations to distinguish more finely
How Pupils Solve Online Problems: An Analytical View
137
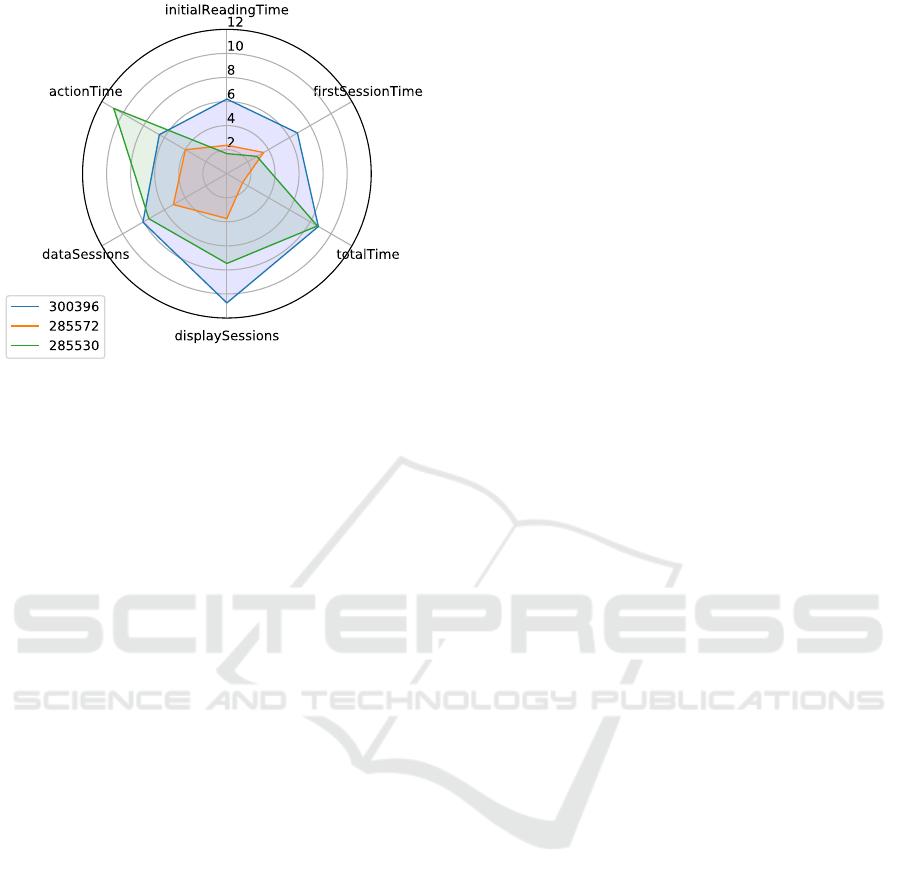
Figure 5: Comparison among three teams.
this from reading or answers’ checking, or all uses
of the mouse (position, movements, clicks, etc.) to
create a gesture heatmaps (see for example (Vatavu
et al., 2014)) and detect those parts of a task that got
more carefully observed, that have been overlooked,
or have distracted the contestants.
Finally, the use of the model and methodology
presented in the paper, or its extensions, can be useful
to investigate more general research questions about
how the problem solving process is performed in the
area of computational thinking, e.g.: is there any cor-
relation between the way learners interact with the
system and the outcome of their effort? Is it pos-
sible to classify/characterize problem-solving tasks
with respect to the way they are experienced and per-
ceived by learners?
ACKNOWLEDGEMENTS
We would like to thank the Bebras community for the
great effort spent in producing exciting tasks.
REFERENCES
ALaDDIn (2017). Bebras dell’informatica.
https://bebras.it. Last accessed on November
2018.
Bellettini, C., Carimati, F., Lonati, V., Macoratti, R., Mal-
chiodi, D., Monga, M., and Morpurgo, A. (2018). A
platform for the Italian Bebras. In Proceedings of the
10th international conference on computer supported
education (CSEDU 2018) — Volume 1, pages 350–
357. SCITEPRESS. Best poster award winner.
Bellettini, C., Lonati, V., Malchiodi, D., Monga, M., Mor-
purgo, A., and Torelli, M. (2015). How challenging
are Bebras tasks? an IRT analysis based on the per-
formance of Italian students. In Proceedings of the
20th Annual Conference on Innovation and Technol-
ogy in Computer Science Education ITiCSE’15, pages
27–32. ACM.
Bonani, A., Del Fatto, V., Dodero, G., and Gennari, R.
(2018). Tangibles for graph algorithmic thinking: Ex-
perience with children (abstract only). In Proceedings
of the 49th ACM Technical Symposium on Computer
Science Education, SIGCSE ’18, pages 1094–1094,
New York, NY, USA. ACM.
Boyle, A. and Hutchison, D. (2009). Sophisticated tasks in
e-assessment: what are they and what are their bene-
fits? Assessment & Evaluation in Higher Education,
34(3):305–319.
Dagien
˙
e, V. (2009). Supporting computer science education
through competitions. In Proc. 9th WCCE 2009, Edu-
cation and Technology for a Better World, 9th WCCE
2009, Bento Goncalves.
Dagien
˙
e, V. and Sentance, S. (2016). It’s computational
thinking! bebras tasks in the curriculum. In Proceed-
ings of ISSEP 2016, volume 9973 of Lecture Notes in
Computer Science, pages 28–39, Cham. Springer.
Dagien
˙
e, V. and Stupuriene, G. (2015). Informatics educa-
tion based on solving attractive tasks through a con-
test. KEYCIT 2014 - Key Competencies in Informatics
and ICT, pages 97 – 115.
Haberman, B., Cohen, A., and Dagien
˙
e, V. (2011). The
beaver contest: attracting youngsters to study comput-
ing. In Proceedings of the 16th annual joint confer-
ence on Innovation and technology in computer sci-
ence education, pages 378–378. ACM.
Lonati, V., Malchiodi, D., Monga, M., and Morpurgo, A.
(2017a). Bebras as a teaching resource: classifying
the tasks corpus using computational thinking skills.
In Proceedings of the 22nd Annual Conference on In-
novation and Technology in Computer Science Educa-
tion (ITiCSE 2017), page 366.
Lonati, V., Malchiodi, D., Monga, M., and Morpurgo, A.
(2017b). How presentation affects the difficulty of
computational thinking tasks: an IRT analysis. In Pro-
ceedings of the 17th Koli Calling International Con-
ference on Computing Education Research, pages 60–
69. ACM New York, NY, USA.
Lonati, V., Monga, M., Morpurgo, A., Malchiodi, D., and
Calcagni, A. (2017c). Promoting computational think-
ing skills: would you use this Bebras task? In
Dagien
˙
e, V. and Hellas, A., editors, Informatics in
schools: focus on learning programming: Proceed-
ing of the 10th international conference on informat-
ics in schools: situation, evolution, and perspectives,
ISSEP 2017, volume 10696 of Lecture Notes in Com-
puter Science, pages 102–113, Cham. Springer Inter-
national Publishing.
Mullan, J., Sclater, N., and Peasgood, A. (2017).
Learning analytics in higher education.
https://www.jisc.ac.uk/reports/learning-analytics-
in-higher-education. Last accessed January 2019.
Ruiz, J. S., D
´
ıaz, H. J. P., Ruip
´
erez-Valiente, J. A., Mu
˜
noz
Merino, P. J., and Kloos, C. D. (2014). Towards
the development of a learning analytics extension in
CSEDU 2019 - 11th International Conference on Computer Supported Education
138

open edx. In Proceedings of the Second International
Conference on Technological Ecosystems for Enhanc-
ing Multiculturality, TEEM ’14, pages 299–306, New
York, NY, USA. ACM.
van der Vegt, W. (2013). Predicting the difficulty level of a
Bebras task. Olympiads in Informatics, 7:132–139.
van der Vegt, W. (2018). How hard will this task be? de-
velopments in analyzing and predicting question diffi-
culty in the bebras challenge. Olympiads in Informat-
ics, 12:119–132.
Vatavu, R.-D., Anthony, L., and Wobbrock, J. O. (2014).
Gesture heatmaps: Understanding gesture perfor-
mance with colorful visualizations. In Proceedings of
the 16th International Conference on Multimodal In-
teraction, ICMI ’14, pages 172–179, New York, NY,
USA. ACM.
How Pupils Solve Online Problems: An Analytical View
139
