
Assuring Cloud QoS through Loop Feedback Controller Assisted
Vertical Provisioning
Armstrong Goes, F
´
abio Morais, Eduardo L. Falc
˜
ao and Andrey Brito
Department of Computing and Systems, Federal University of Campina Grande, Campina Grande, Brazil
Keywords:
Vertical Scaling, Feedback Control-loop, PID Controller, Asperathos.
Abstract:
A problem observed in cloud environments is the assurance of Quality of Service (QoS) in the execution of
applications. In the context of batch applications, a common goal is ensuring deadline compliance. However,
estimating the required amount of resources to assure execution deadline may be difficult and prone to un-
derallocations or superallocations. An alternative is modifying the amount of allocated resources in case the
progress is not satisfactory, using horizontal or vertical scaling. Following this strategy, this work proposes
a provisioning method based on PID controllers and vertical scaling for batch applications. To evaluate the
proposed provisioning method on assuring QoS, we executed two microbenchmarks and one Big Data appli-
cation on a real cloud infrastructure where the provisioning was controlled by our method. Results show that
the provisioning method using the Proportional-Derivative controller is effective on ensuring QoS regarding
deadline compliance, allocation smoothness and resource efficiency, though it requires additional adjusts when
provisioning resources to applications with non-linear progress.
1 INTRODUCTION
Cloud consumers typically come into an agreement
with cloud providers to specify the Quality of Service
(QoS) to be consumed. In this case, the challenge of
cloud users is coping with the high variability of ap-
plications’ demand. This can be addressed by adding
extra resources in peak load moments, which can be
achieved with the aid of scaling mechanisms.
In horizontal scaling, whenever some overload
condition is met, additional Virtual Machines (VMs)
are included to unload the system. However, this
approach has some limitations. Horizontal scaling
only suits parallel applications since sequential ap-
plications cannot benefit from distributed resources.
In addition, it may be lengthy, taking minutes, when
compared to demand variations which happen in sec-
onds (Turowski and Lenk, 2014). Finally, depending
on the availability of VM’s flavors, even though a new
VM with the smallest flavor is added, such amount
may still be overgenerous in certain situations. An
alternative to these issues is the vertical scaling.
Through vertical scaling, overloaded VMs can al-
locate the idling resources from the hosts they belong.
Although vertical scaling is constrained by the total
host’s resources, this process is performed during run-
time and takes one second or less (Dutta et al., 2012).
Furthermore, vertical scaling allows the fine-grained
control of the amount of resources to be changed.
These features combined make vertical scaling an in-
teresting tool to support cloud providers in complying
with the agreed QoS for sequential applications.
For some types of application, e.g., batch appli-
cations, one of the most relevant QoS metric is the
running time. In this context, progress delay, com-
monly reported by execution platforms such as Spark,
indicates that the amount of allocated resource is in-
sufficient. This delay is used as a trigger to allocate
more resources. Here we consider vertical scaling to
control such allocation so that QoS deadlines are met.
Our contribution is proposing and assessing
strategies to perform vertical scaling. We ex-
perimented four feedback control loop strategies:
Minimum-Maximum (or Min-Max), Proportional
(P), Proportional-Derivative (PD) and Proportional-
Integral-Derivative (PID).
Briefly, the main difference is that changes in
Min-Max controllers are abrupt, from minimum to
maximum resource capacity. This abruptness causes
disturbance in the environment, potentially affecting
other applications. In Proportional controllers and
their variations such adjustment is proportional to
the deviation between the actual and the expected
progress of the application, reducing the chances of
176
Goes, A., Morais, F., Falcão, E. and Brito, A.
Assuring Cloud QoS through Loop Feedback Controller Assisted Vertical Provisioning.
DOI: 10.5220/0007766701760186
In Proceedings of the 9th International Conference on Cloud Computing and Services Science (CLOSER 2019), pages 176-186
ISBN: 978-989-758-365-0
Copyright
c
2019 by SCITEPRESS – Science and Technology Publications, Lda. All rights reserved

disturbing other applications. However, Proportional
controllers are more difficult to set up, requiring pa-
rameter tuning, whilst in Min-Max no parameter tun-
ing is required.
To evaluate these controllers we opted for As-
perathos
1
, a cloud agnostic open-source framework
to support the monitoring and allocation control of
resources, as well as application deployment. Since
the focus is investigating the effectiveness of different
scaling controller strategies, and Asperathos’ archi-
tecture supports customizing the control and monitor-
ing components, we consider it an adequate frame-
work for this research. Experiments were performed
with two types of workload: linear and non-linear
progress. We observed that, using our approach, it
was trivial to ensure QoS deadlines for linear progress
applications. All controllers were successful on en-
suring deadline compliance, with PD being the most
efficient. On the other hand, non-linear progress
applications needed additional adjustment, such as
progress linearization and parameter tuning. Though
both adjustments were successful on ensuring dead-
line compliance, resource allocation after progress
linearization showed to be smoother.
This paper is structured as follows. Next, we
present works related to scaling mechanisms with fo-
cus on vertical provisioning and feedback controllers.
Then, Section 3 introduces the Asperathos framework
used in our experiments. The proposed controllers
are detailed in Section 4. Section 5 describes the ex-
perimental design, infrastructure setup, and the appli-
cations’ workload. Results and their corresponding
analysis are presented in Section 6. Finally, conclud-
ing remarks and future work are put forward in Sec-
tion 7.
2 RELATED WORK
Besides being classifiable as horizontal and verti-
cal, scaling mechanisms can be also categorized in
reactive and proactive. Reactive scaling relies on
the last states of the application to trigger some ac-
tion. Proactive methods estimate future demand based
on the utilization history of infrastructure resources.
Google and AWS Auto-Scaling services (Google
Cloud, 2018; Amazon Web Services, 2018b) are ex-
amples of reactive scaling.
One of the AWS models is the credit-based ver-
tical scaling (Amazon Web Services, 2018a) using
“Burstable Performance Instances”. In this approach,
VMs accumulate CPU credit during idle moments
1
https://github.com/ufcg-lsd/asperathos
and, in peak moments, more CPU power is supplied
requiring no extra budget. Yazdanov et al. (2012) im-
plemented a controller on top of the Xen hypervisor
aiming at avoiding Service Level Agreements (SLA)
violations by adapting VMs’ resource constraints and
also by dynamically plugging in new virtual CPUs.
A slightly different approach is provided in (Dawoud
et al., 2011), where scaling up and down of a web
application is controlled by the maximum number of
clients in Apache server parameters.
Likewise, there is also vertical scaling mecha-
nisms for memory. “Cloud Virtual Machine Auto-
matic Memory Procurement” (Molt
´
o et al., 2016) is
a reactive mechanism that spares idle memory from
VMs to supply memory outages of other existent or
new coming VMs. Once vertical scaling takes place
in seconds, it is reasonable to state that reactive ap-
proaches tend to outperform proactive ones. How-
ever, Spinner et al. (2015) highlight that several appli-
cations can not immediately benefit from this fresh al-
located memory, requiring restart in some cases. Un-
der these circumstances, proactive mechanisms may
deliver better results.
Regarding proactive mechanisms for memory we
can cite Bayllocator (Tasoulas et al., 2012), Ginkgo
(Hines et al., 2011) and the work of Spinner et al.
(2015). The first relies on Bayesian networks and
seeks hosts consolidation; Ginkgo creates a model
through correlating its performance, memory usage,
and submitted load; and the last proposes an extended
forecasting technique leveraging some extra workload
information to improve forecast accuracy.
There are also some hybrid approaches. Sedaghat
et al. (2013) proposes a strategy that provisions re-
sources both vertically and horizontally. It considers
VMs capacity and price to decide how a set of allo-
cated VMs should be repacked into a new optimal
set of VMs. Morais et al. (2013) proposed an auto-
scaling strategy based on both reactive and proactive
methods. The proactive mechanism uses a set of de-
mand predictors and a selection module to define the
best predictor for a given moment. The reactive mech-
anism operates like the standards: utilization thresh-
olds are defined for each resource and actions are trig-
gered when thresholds are exceeded.
Concerning scaling mechanisms based on the
Control Theory (Hellerstein et al., 2004), Lorido-
Botr
´
an et al. (2014) classify them in three categories:
i) fixed gain controllers, where tunning paramenters
remain fixed during the operation of controller; ii)
adaptive controllers, where parameters are changed
on the fly to achieve better results; and iii) model pre-
dictive controllers, where the future behavior of the
system is predicted based on a model and the current
Assuring Cloud QoS through Loop Feedback Controller Assisted Vertical Provisioning
177

output. Since the main controllers proposed in this
work are of type “fixed gain” and “predictive” (we use
the derivative component of proportional controllers),
we attain our study to these categories.
An Integral controller is used by Lim et al.
(2009) to regulate the number of VMs according to
CPU utilization. Park and Humphrey (2009) used
a Proportional-Integral (PI) controller to assure the
QoS of batch applications. Zhu and Agrawal (2012)
also relied on a PI controller but equipped with a re-
inforcement learning component. They recall that a
PID controller is more effective, because the deriva-
tive component stands for predicting future errors, but
replaced it with a reinforcement learning component
due to its high sensitivity to error noise, which they
claim to cause unstability to the controller.
We also found some works investigating the effec-
tiveness of PID controllers. Grimaldi et al. (2015)
proposed what they call the “Gain Scheduling PID
Controller”, a horizontal scaling technique that peri-
odically adjusts the number of VMs running so that
agreed QoS levels are reached. Barna et al. (2016)
assessed the performance of PID vertical scaling con-
trollers designed to keep high levels of CPU utiliza-
tion. The evidences show that this control strategy can
even replace standard auto-scaling threshold-based
techniques.
We believe that the use of PID controllers for
cloud scaling is still underexplored. Related work ap-
plies PID controller with slightly different goals. In
this work we control the application progress so to not
exceed its deadline. For this purpose, we study Min-
Max and some variations of proportional controllers
(P, PD and PID) whilst related work only study PI
or PID, alone. We then apply such controllers for
the CPU and I/O resources. Finally, workloads with
different patterns are assessed, from which we found
out that some types of workload may require special
setup.
Next section briefly presents Asperathos, the
framework used to implement and evaluate the pro-
posed strategies.
3 ASPERATHOS
Asperathos is a cloud agnostic, plugin-based, open-
source framework developed with the objective of
providing cloud users an easy way of deploying ap-
plications that comply with defined QoS objectives.
Asperathos’ architecture comprises three compo-
nents: the Broker, the Monitor and the Controller.
These components are executed as services and com-
municate through a REST API. The Broker is re-
sponsible for firing the application, setting up the ex-
ecution environment and starting the other compo-
nents. The Monitor collects application’s health met-
rics such as execution progress and calculates the er-
ror value based on the reference supplied by the Bro-
ker. The method for collecting metrics is tied to
the application’s execution platform. Since we ex-
periment Spark applications, execution progress are
collected through requests to Spark’s REST API. In
the non-Spark application scenarios, however, the
progress was collected via application logging. The
calculated error is sent to the Controller, which is in
charge of deciding the best action to ensure QoS. All
the three components are plugin-based and, thus, it is
possible to customize the framework by developing
new plugins.
This work focuses on assessing provisioning
strategies for the Controller component. Such strate-
gies are described next.
4 CONTROLLERS
Feedback controllers have been used as solution to
many types of engineering problems where the goal
is to keep the value of a certain environment variable
in a given interval.
One of the most used control models is the closed
loop control. In this model, the control system re-
ceives a reference value and, periodically, the Con-
troller receives an error value calculated as the dif-
ference between the reference value and the collected
output value. Based on the error value, the Controller
chooses an action to be performed on the system.
In this research, our objective is to ensure QoS as
deadline compliance for batch applications executing
on a cloud environment. Therefore, our controller de-
cisions are based on an error calculated as the differ-
ence between the actual progress and the reference
(ideal) progress, where the latter is linear. Since we
focus on vertical scaling, our controller acts by chang-
ing the capacity of the VMs, e.g., changing the limi-
tation of how much each virtual CPU can use of the
underlying physical CPU, which is typically known
as the CPU cap of the VM.
The four algorithms evaluated are described next.
4.1 Minimum-Maximum (Min-Max)
Min-Max is based on two quota values: the base value
and the maximum value. When the error is negative,
i.e., the progress value is lower than expected, Min-
Max returns the maximum value as the new quota.
When the error is positive, meaning that progress
CLOSER 2019 - 9th International Conference on Cloud Computing and Services Science
178
value is higher than expected, Min-Max returns the
minimum value as the new quota.
4.2 Proportional (P)
This algorithm receives an error value as argument
and returns the amount of resources to allocate (when
error value is negative) or deallocate (when error
value is positive), called “actuation size”. In this
case, the actuation size is a function of the error value
and the proportional gain. Note that the proportional
gain is an input parameter that must be defined by
the cloud provider, and higher values lead to abrupt
changes in allocation. The actuation size for the pro-
portional controller is calculated as follows:
a = −1 ∗ g
p
∗ e (1)
where g
p
is the proportional gain, e is the error value
and a is the actuation size.
4.3 Proportional-Derivative (PD)
In PD controllers, the actuation size is a function of
the current error value, the difference between the
current and the last error, the proportional gain and
the derivative gain. The proportional and derivative
gains are inputs that must be defined by the cloud
provider. The actuation size for the Proportional-
Derivative controller is calculated as follows:
c
p
= −1 ∗ g
p
∗ e
t
(2)
c
d
= −1 ∗ g
d
∗ (e
t
− e
t−1
) (3)
a = c
p
+ c
d
(4)
where c
p
is the proportional component, c
d
is the
derivative component and a is the actuation size. g
p
is the proportional gain, g
d
is the derivative gain and
e
t
is the error on time t.
4.4 Proportional-Integral-Derivative
In PID controllers, the actuation size is a function
of the current error, the difference between the cur-
rent and the last error, the sum of all error values, the
proportional gain, the derivative gain and the integral
gain. Recall that these gains variables must be defined
by the cloud provider. The actuation size for the PID
controller is calculated as follows:
c
p
= −1 ∗ g
p
∗ e
t
(5)
c
d
= −1 ∗ g
d
∗ (e
t
− e
t−1
) (6)
c
i
= −1 ∗ g
i
∗ (e
1
+ e
2
+ ... + e
t−1
+ e
t
) (7)
a = c
p
+ c
d
+ c
i
(8)
where c
p
is the proportional component, c
d
is the
derivative component, c
i
is the integral component
and a is the actuation size. g
p
is the proportional gain,
g
d
is the derivative gain, g
i
is the integral gain and e
t
is the error on time t.
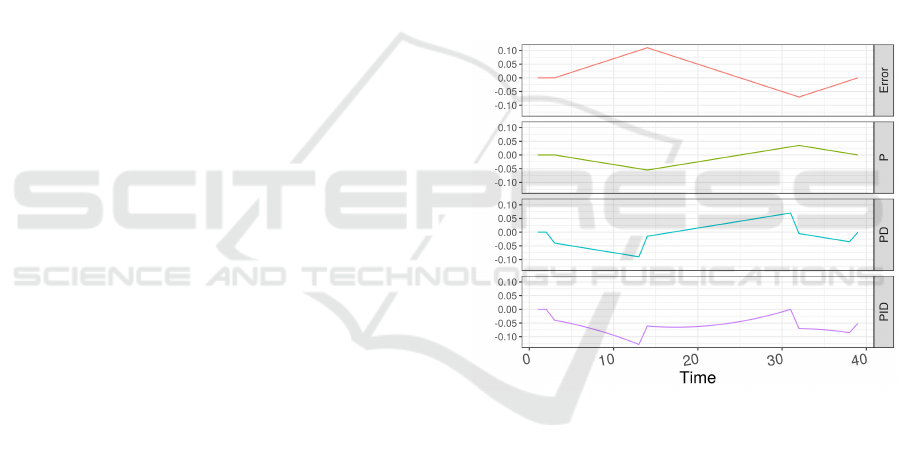
An illustration of the pattern of such controllers is
presented on Figure 1. In this example, the parame-
ter gains are setup as follows: g
p
= 0.5, g
p
= 4 and
g
i
= 0.7. The vertical axis stands for the actuation
intensity and the horizontal axis represents the time.
The actuation calculated by the P controller is simply
a mirrored version of the error curve, scaled using the
proportional gain. The PD controller considers both
current error value and its tendencies to fix the ob-
served error, reacting faster to delay tendencies than
the Proportional controller. The PID controller may
react slower to the negative error values than the PD
controller. This is caused when there is positive error
amassed by the integral component on a first phase.
Figure 1: Behavior of different control algorithms.
The experiments are described next.
5 EXPERIMENTS
5.1 Design
Our main objective is to evaluate the control algo-
rithms regarding their effectiveness on ensuring QoS,
mainly through compliance of Service Level Objec-
tives (SLOs), defined as execution deadlines. For this
purpose, we used the following evaluation metrics:
execution time, smoothness of resource allocation
and efficiency of resource allocation.
The execution time must respect the application’s
SLO deadline. Also, resource allocation must be
Assuring Cloud QoS through Loop Feedback Controller Assisted Vertical Provisioning
179

smooth so that it does not disturb other applications.
Finally, resource allocation must not waste resources,
or in other words, allocated resources should not be
idle.
We first assessed our strategy by running mi-
crobenchmarks (cf. Section 5.4) and then we evalu-
ated a real application. Both activities were executed
with the aid of the Asperathos framework. Resource
allocation decision was performed by the control al-
gorithms presented on Section 4. Resource allocation
level was collected throughout run time and execution
time was collected at the end.
The configuration of controllers are described
next.
5.2 Configuration
5.2.1 Resource level range
Before using our controllers, it was necessary to de-
fine reasonable limits for resource allocation. Since
we may use all available resources if necessary (the
virtual cores will consume the complete physical
cores), our maximum resource level is 100%. How-
ever, it is still necessary to define a minimum resource
level.
Decreasing the minimum CPU cap or I/O cap re-
sults in reduced performance, thus, increasing execu-
tion time. For instance, considering a situation of per-
fect trade-off, a reduction of 50% in CPU cap should
give a two times greater execution time. However, for
some minimum resource level, the trade-off may be
disadvantageous.
To define the minimum resource level we per-
formed preliminary experiments with a simple appli-
cation using different levels for the minimum CPU
cap and collected the execution time. Results are pre-
sented on Figure 2.
The red line represents the perfect expected trade-
off between reducing CPU cap and execution time.
As can be seen, performance loss for CPU cap levels
lower than 50% is greater than the expected. There-
fore, we used 50% as minimum resource level.
The same preliminary experiments were con-
ducted for the I/O resource and it was observed that
the trade-off between reducing I/O cap and increasing
execution time is not as disadvantageous as it is for
CPU. However, as long as we do not consider the im-
pacts of different resources on the progress, but con-
sider only the actual application’s progress, it is rea-
sonable to choose the same resource interval for CPU
and I/O. Thus, although we could choose lower val-
ues for the I/O cap, we defined it as the same of CPU
cap.
Figure 2: Execution time with different minimum CPU cap
thresholds.
5.2.2 Gains
In our assessment a trivial setup was used for the gains
of the proposed controllers: all gains are equal to 1.
By using this configuration, a linear response to error
is expected. For instance, a progress delay of 10%
corresponds to an extra allocation of 10% of the total
resource capacity.
5.2.3 Deadlines
To define the base deadlines we ran the microbench-
marks and the application 10 times each, and col-
lected their execution times, without controller super-
vision. In order to allow controllers’ actuation to im-
pact execution time, we measured the workload exe-
cution time with the microbenchmark and application
constrained by CPU and I/O caps equal to 70%. This
is done so that the controller can increase the quota
to 100% of CPU and I/O capacity, or decrease to the
lowest resource level, when needed. In addition to this
constraint, we considered a lower value for the dead-
line: 90% of the mean of the execution time (consid-
ering the 70% CPU and I/O cap).
5.3 Infrastructure
The evaluation was performed in a set of dedicated
hosts within an OpenStack cloud environment. This
set was comprised by 3 servers, 2 Dell PowerEdge
R410 and 1 Dell PowerEdge R420, connected by an 1
gigabit network and using Ceph
2
for shared storage.
All servers run Ubuntu Linux. The compute nodes
configuration is presented on Table 1.
2
https://ceph.com
CLOSER 2019 - 9th International Conference on Cloud Computing and Services Science
180
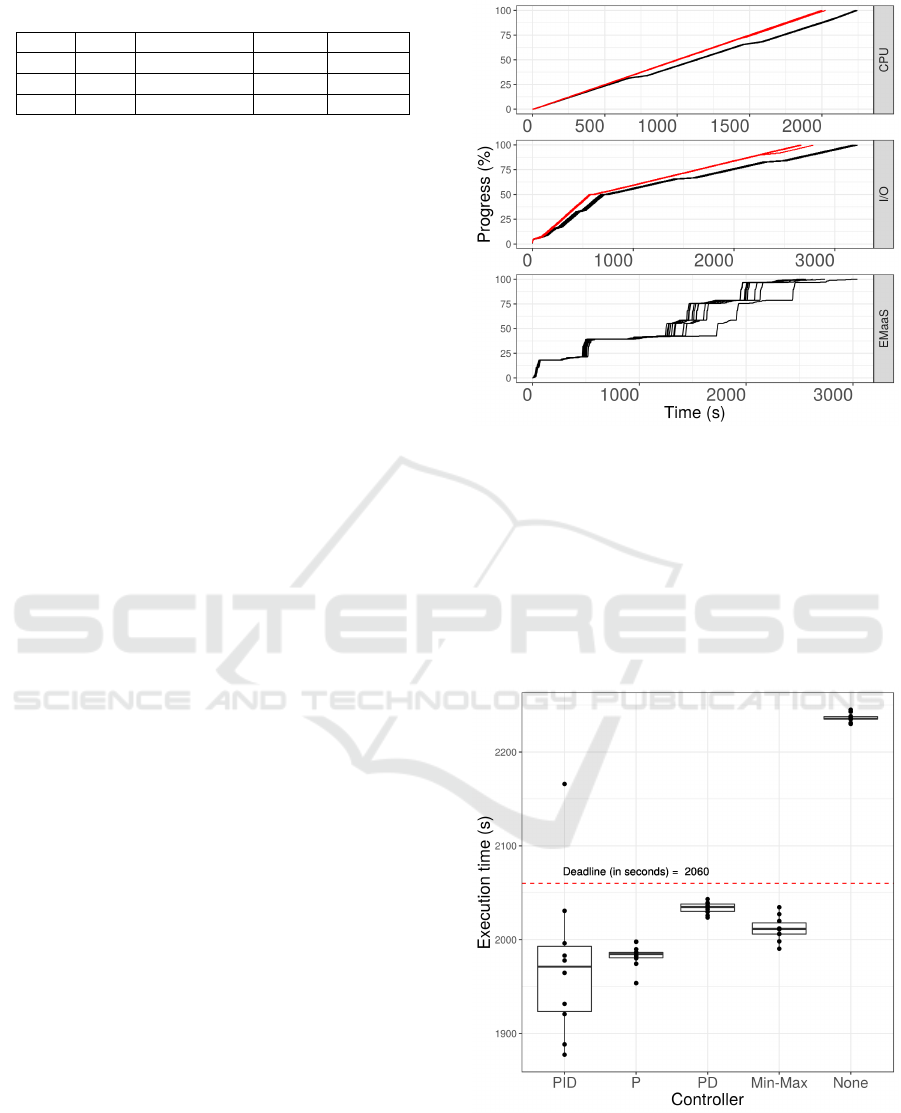
Table 1: Servers used in the assessment process.
Server Model Processor Memory Kernel
1 R410 Xeon X5675 32 GB 4.4.0-112
2 R410 Xeon X5675 32 GB 4.4.0-98
3 R420 Xeon E5-2407 20 GB 4.4.0-98
We used servers 1 and 2 to create VMs to host the
applications and server 3 to deploy Asperathos com-
ponents. The VMs are configured with 2 vCPUs and
4 GB of memory. A Spark cluster with 1 master node
and 12 workers is used to execute the application.
5.4 Microbenchmarks and Application
Two microbenchmarks, CPU and I/O, and one appli-
cation are used in the assessment process.
The CPU microbenchmark performs a series of
factorial computation. As input it receives the argu-
ment of the factorial function and the number of times
to perform the calculation. Depending on the input of
the CPU microbenchmark, its progress may be linear
with time. However, a purely linear progress would
be a trivial task to controllers. Our objective is to
evaluate how our strategy performs in case of progress
variation, and thus we combined a series of factorial
computation for some different input, yielding a slight
disturbance. The execution progress with such input
is presented on Figure 3 as the black line. The red line
represents the progress without disturbances.
The I/O microbenchmark performs a series of
disk write operations and then a series of read oper-
ations. The execution progress for this microbench-
mark tends to be non-linear, as presented on Figure
3 as the red line. Further, likewise it was done for
the CPU microbenchmark, some heavier tasks (larger
files) were considered for this workload, yielding a
slight disturbance. The progress with such input is
presented on Figure 3 as the black line.
We also considered a real application to exper-
iment our controllers. Entity Matching as a Ser-
vice (EMaaS) is a Spark implementation of an entity
matching algorithm used in the context of data quality
assurance in Big Data (Mestre et al., 2017). Its exe-
cution progress, as executed in the assessment, is pre-
sented on Figure 3. Its progress is non-linear, similar
to the I/O microbenchmark, with a faster first phase
and a slower second phase. No extra disturbance was
applied for the EMaaS workload.
Results and analysis of the performance of controllers
with such workloads are presented next.
Figure 3: Progress of the microbenchmarks and EMaaS.
6 RESULTS AND ANALYSIS
6.1 CPU Microbenchmark
The execution times for this microbenchmark are pre-
sented through box plots in Figure 4. The red line
marks the execution deadline used as reference.
Figure 4: Execution times using different controllers.
As most of the execution times are below the red line,
we conclude that all control algorithms were success-
ful on assuring deadline compliance. Proportional-
Derivative times are the closest to deadline. Hence,
Assuring Cloud QoS through Loop Feedback Controller Assisted Vertical Provisioning
181
the waste of resources in this case is the smallest.
Also, the execution times for this algorithm are less
dispersed. Therefore, Proportional-Derivative is eas-
ier to predict and more reliable. On the other hand,
PID execution times dispersion is the highest and this
algorithm seems less reliable and harder to predict.
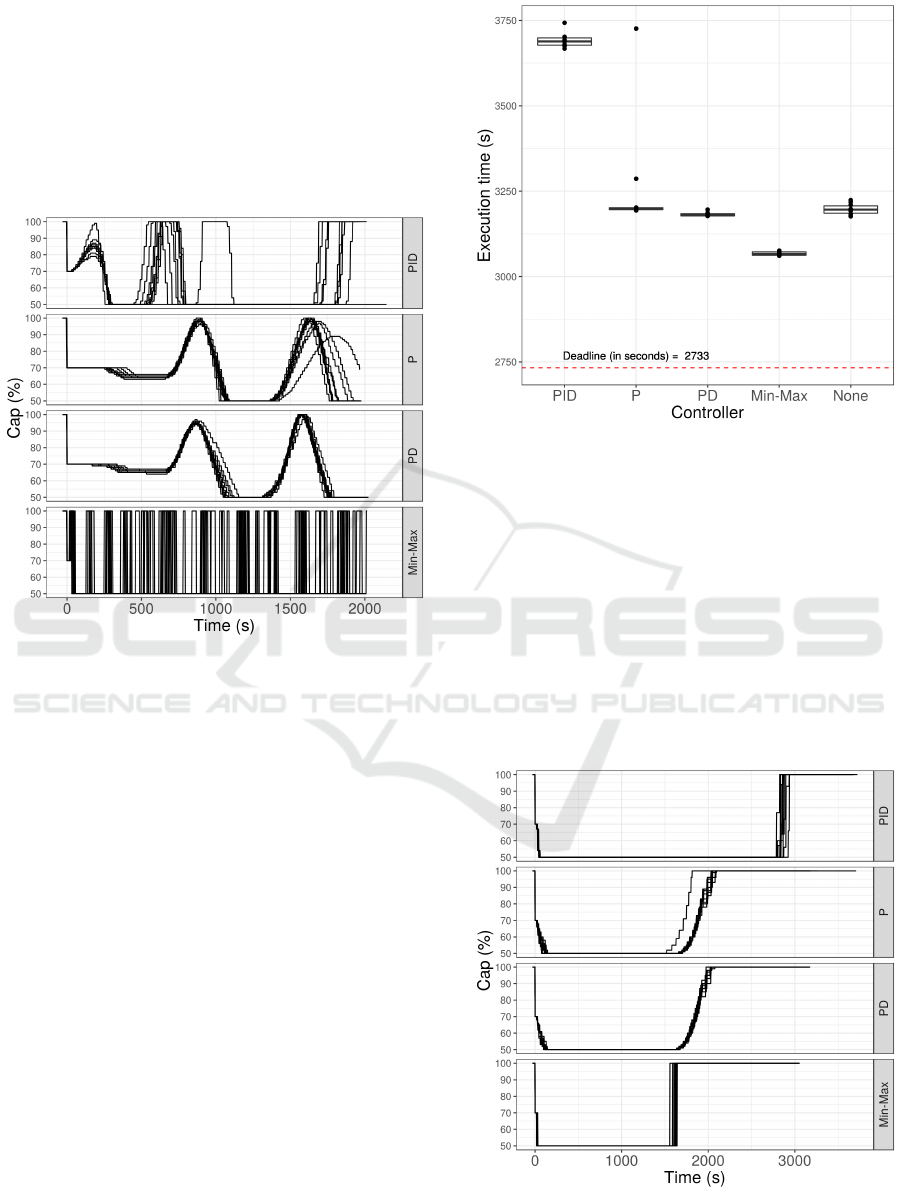
CPU resource allocation during the execution is
presented in Figure 5.
Figure 5: CPU resource allocation using different con-
trollers.
Min-max algorithm is the most aggressive regard-
ing resource allocation, changing from the base value
(50%) to max level (100%) many times throughout
the execution. On the other hand, resource allocation
for Proportional and Proportional-Derivative cases is
smooth. Two allocation peaks are shown in Figure
5 for Proportional and Proportional-Derivative cases.
These peaks show that the algorithms try to compen-
sate the workload disturbance.
Results may be summarized as follows:
• when running linear progress applications, trivial
configuration is enough to ensure deadline com-
pliance and even the simplest control algorithm is
effective;
• PID controllers are not easy to setup;
• P and PD algorithms provide both smooth re-
source allocation and deadline compliance.
6.2 I/O Microbenchmark
The execution times for this microbenchmark are pre-
sented through box plots in Figure 6. The red dashed
line defines the deadline reference.
Figure 6: Execution times using different controllers.
For the I/O microbenchmark, no controller strategy
managed to ensure deadline compliance. Min-max
has the best results as its execution times are the clos-
est to the deadline, and PID showed to be the worst.
Execution time dispersion is similar in all algorithms,
except PID. Similar to CPU microbenchmark results’,
PID execution times are more dispersed. The amassed
error by the integral component might be the respon-
sible for both the delay and high dispersion on execu-
tion time when using the PID controller.
I/O resource allocation is presented on Figure 7.
Figure 7: I/O resource allocation using different controllers.
All algorithms follow the same general pattern: first,
CLOSER 2019 - 9th International Conference on Cloud Computing and Services Science
182
deallocation from max level (100%) to lowest level
(50%); second, a stable phase in the lowest level;
third, reallocation of resources up to 100%. First, the
algorithms are exposed to positive error, caused by
the faster benchmark first phase. Then, resources are
removed. As the execution starts the slower second
phase, resources are reallocated.
The main difference is in the time each controller
takes to react, and also on the intensity of reaction.
The intensity of Min-Max and PID reactions is high,
whilst P and PD controllers changes softly the I/O cap
from 50% to 100%. Min-max, P and PD started to
increase CPU cap approximately at the same time,
while PID delayed more than 1000 seconds in rela-
tion to the others. Thus, considering that Min-max
is the algorithm that performed best, and PID is the
one that performed worst, it is reasonable to say that
reaction time is a key aspect to comply with the dead-
line. Further, as long as the controllers achieved their
goal for the CPU microbenchmark, and its workload
has a linear progress, we consider a previous task of
linearizing the I/O microbenchmark before running it.
Therefore, in the next Section we experiment two
possible solutions: i) adjusting the controller’s gain
parameters and ii) linearizing the I/O microbench-
mark. For the sake of simplification, we try such ad-
justs in a single controller, the PD.
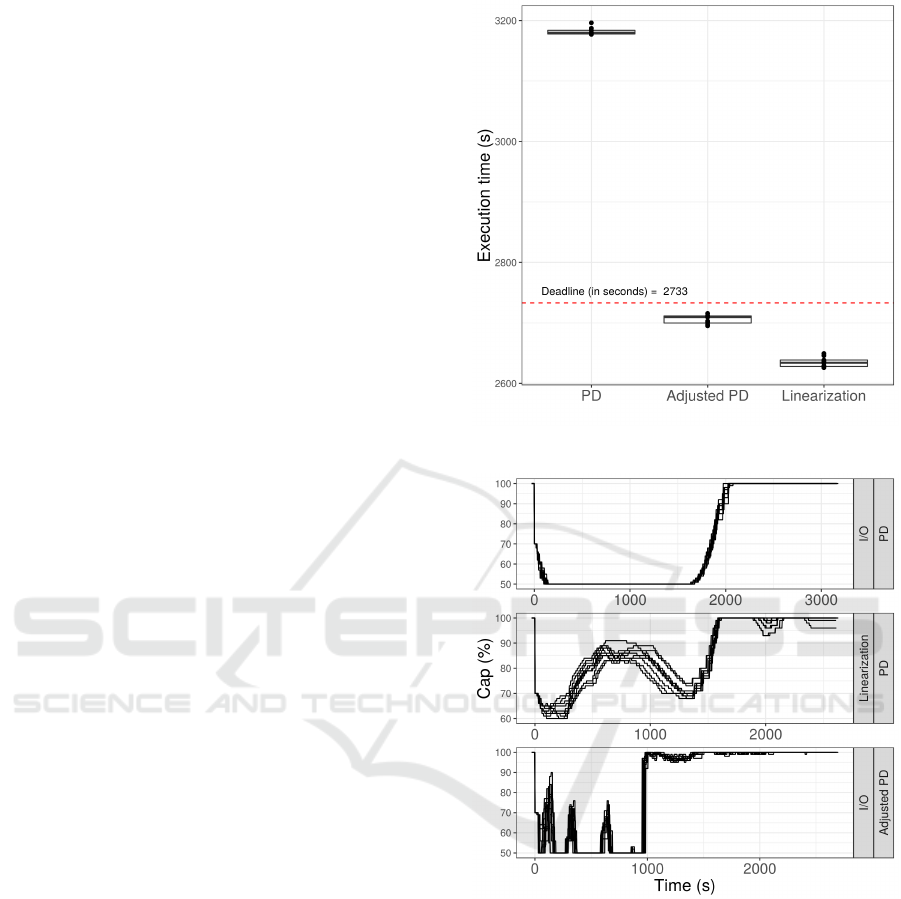
6.3 I/O Microbenchmark –
Adjustments
The PD controller was tested against the same work-
load but this time with different gains. To define
proper values, we ran the I/O microbenchmark several
times and observed that g
p
= 0.1 and g
d
= 20 yields
good results. The process of progress linearization
consists in adjusting the percentage of microbench-
mark’s progress as being proportional to the elapsed
time in relation to the total time to complete the exe-
cution. For instance, an application could reach 50%
of its progress in 10% of the total execution time; in
this case, linearizing is defining 10% of progress at
that moment. This task is performed transparently by
the Monitor component. The execution times using
both adjusts are presented on Figure 8 and resource
allocation is presented on Figure 9.
Both adjust options were successful on ensur-
ing deadline compliance. PD parameter tuning is
more efficient regarding resources utilization (execu-
tion times are closer to deadline). However, resource
allocation in this case is more aggressive. On the
other hand, for the progress linearization method, re-
source allocation is smoother.
Figure 8: Execution times using adjust options.
Figure 9: Resource allocation using adjust options.
6.4 EMaaS
The dispersion of execution times for the EMaaS ap-
plication are presented through box plots in Figure 10,
where the red line stands for the execution deadline
used as reference. Here we experiment EMaaS with
two forms of configuring the controller component: i)
the controller actuating with the same intensity over
CPU and I/O; and ii) the controller actuating only
over the CPU resource, the I/O remaining fixed. Re-
call that, in both setups, CPU and I/O start with a fixed
resource capacity of 70%. In the executions of both
microbenchmarks, presented in previous sections, the
Assuring Cloud QoS through Loop Feedback Controller Assisted Vertical Provisioning
183
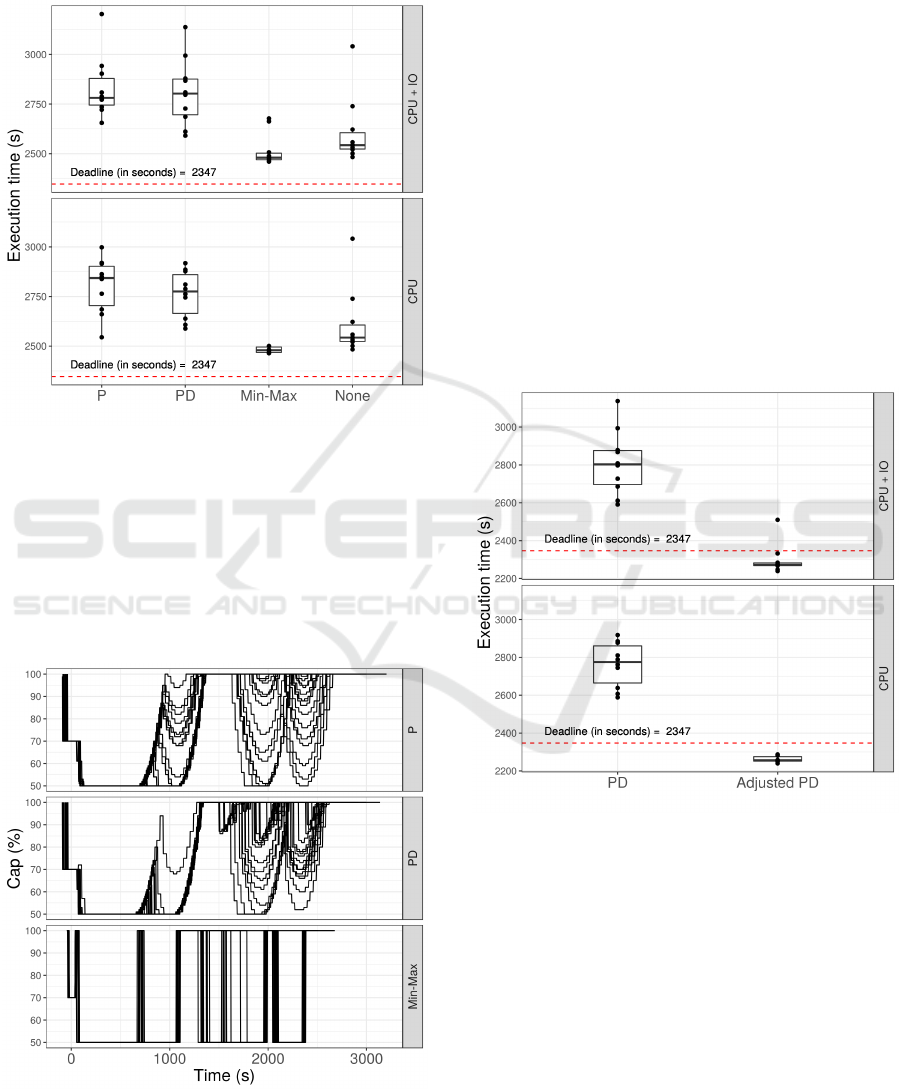
PID controller turned out to be more difficult to con-
figure and less predictable. Therefore, it was removed
from the executions of the EMaaS application.
Figure 10: Execution times using different controllers.
For the EMaaS application, none of the controllers
managed to ensure deadline compliance without pa-
rameter tuning or progress linearization. In addition,
similar to the I/O microbenchmark case, Min-max has
the best results.
Resource allocation of these scenarios is presented
next, on Figure 11.
Figure 11: Resource allocation using different controllers.
Once again, although Min-max execution times are
the best, resource allocation is very aggressive. P and
PD yielded better results regarding allocation smooth-
ness.
Next section presents the results obtained by fol-
lowing the parameter tuning approach.
6.5 EMaaS – Adjustments
Similarly to what was done for the I/O microbench-
mark, we ran the EMaaS several times and observed
that g
p
= 1 and g
d
= 15 yields an earlier reaction.
Once more, we ran experiments in which the con-
troller actuates solely over CPU, and experiments in
which it actuates over the CPU and I/O resources. In
both setups, CPU and I/O start with a fixed resource
capacity of 70%. Execution times for the adjusted PD
are presented on Figure 12 and resource allocation for
both CPU and CPU+I/O cases is presented on Figure
13.
Figure 12: Execution times using the adjust option for the
PD controller.
The adjusted PD managed to ensure deadline compli-
ance for EMaaS, with lower dispersion of execution
time values, hence with better reliability. In terms
of resource allocation, adjusted PD acts earlier than
using the default configuration. Although allocation
tends to be smooth, deallocation is still aggressive.
Further optimization may enable a smooth dealloca-
tion.
From the results for EMaaS we can conclude
that the new adjusted configuration yielded good re-
sults regarding deadline compliance, but allocation
smoothness still needs improvement.
CLOSER 2019 - 9th International Conference on Cloud Computing and Services Science
184
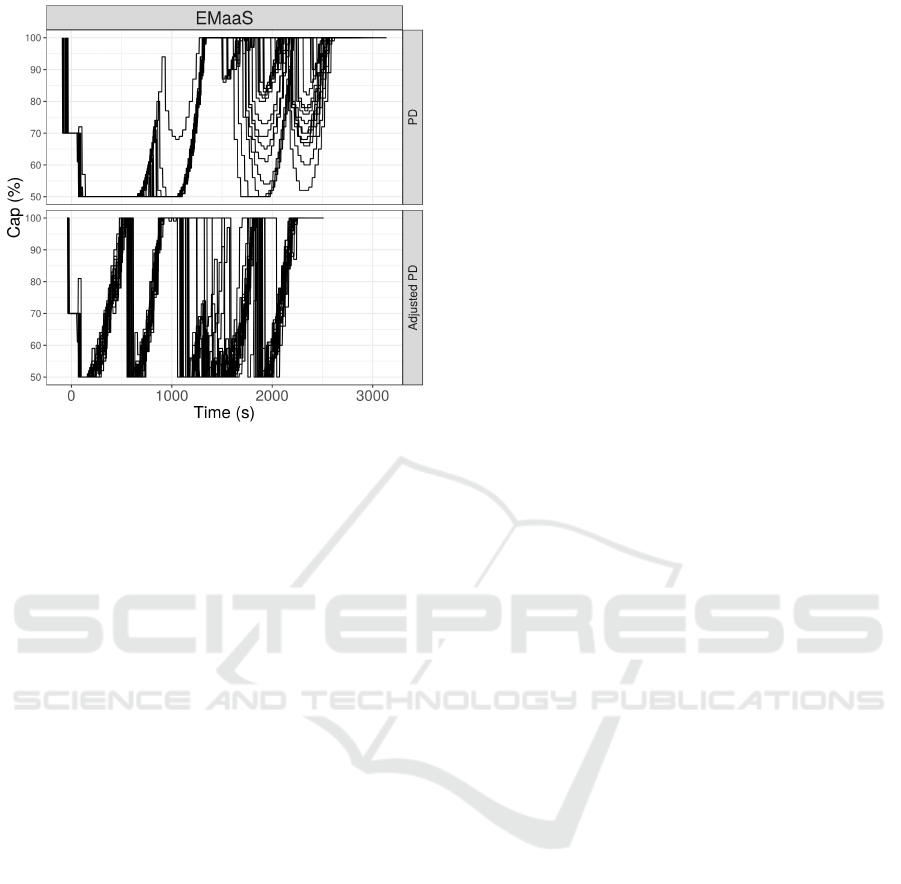
Figure 13: Resource allocation using adjust option.
7 CONCLUSIONS
This work evaluates four vertical provisioning strate-
gies (Min-max, P, PD and PID), on a realistic
cloud environment, through the execution of two mi-
crobenchmarks and an application used in the Big
Data context. Execution times and resource allocation
were collected for all executions. The results show
that linearity of the applications’ progress is a key as-
pect for the controller to succeed.
For linear progress applications, like our CPU mi-
crobenchmark, trivial configuration was enough to
ensure QoS. Even the simplest controller (Min-Max)
managed to achieve good time results, although in this
case resource allocation was more aggressive, dis-
turbing the execution environment.
When dealing with non-linear progress applica-
tions, the trivial configuration is not enough to ensure
deadline compliance. Two candidate solutions are: i)
tuning the controller gain parameters and ii) lineariz-
ing application progress. Although the first is harder
to setup, requiring previous workload analysis and
multiple executions, it turned out to be more effective
in terms of resource utilization. On the other hand,
linearizing the application’s progress is more effec-
tive when it comes to resource allocation smoothness.
Furthermore, it may be achieved transparently, by the
Monitor component of Asperathos. Both adjusts re-
quired prior knowledge of the application’s progress.
This might restrict the use of this approach for appli-
cations that are executed only a few times, where less
information about progress is available. However, re-
peated execution over time is fairly common, e.g., a
data preprocessing application used for data-mining.
In the latter context, there may exist plenty of infor-
mation on application behavior.
Future work includes the analysis of interactive
applications and the adjustment of gain parameters on
the fly.
ACKNOWLEDGMENT
This research was partially funded by CNPq/Brazil,
by the EU-BRA BigSea project (EC and MC-
TIC/RNP, 3rd Coordinated Call, H2020 Grant agree-
ment no. 690111), by the EU-BRA SecureCloud
project (EC, MCTIC/RNP, and SERI, 3rd Coordi-
nated Call, H2020 Grant agreement no. 690111)
and by the EU-BRA ATMOSPHERE project (EC
and MCTIC/RNP, 4th Coordinated Call, H2020 Grant
agreement no. 777154).
REFERENCES
Amazon Web Services (2018a). Amazon ec2 instance
types. https://aws.amazon.com/ec2/instance-types/.
Accessed on: 23/12/2018.
Amazon Web Services (2018b). Aws auto scaling.
https://aws.amazon.com/pt/autoscaling/. Accessed
on: 23/12/2018.
Barna, C., Fokaefs, M., Litoiu, M., Shtern, M., and Wig-
glesworth, J. (2016). Cloud adaptation with control
theory in industrial clouds. In 2016 IEEE Interna-
tional Conference on Cloud Engineering Workshop
(IC2EW), pages 231–238.
Dawoud, W., Takouna, I., and Meinel, C. (2011). Elastic
vm for cloud resources provisioning optimization. In
Abraham, A., Lloret Mauri, J., Buford, J. F., Suzuki,
J., and Thampi, S. M., editors, Advances in Computing
and Communications, pages 431–445, Berlin, Heidel-
berg. Springer Berlin Heidelberg.
Dutta, S., Gera, S., Verma, A., and Viswanathan, B. (2012).
Smartscale: Automatic application scaling in enter-
prise clouds. In 2012 IEEE Fifth International Con-
ference on Cloud Computing, pages 221–228.
Google Cloud (2018). Autoscaling groups of instances.
https://cloud.google.com/compute/docs/autoscaler/.
Accessed on: 23/12/2018.
Hellerstein, J. L., Diao, Y., Parekh, S., and Tilbury, D. M.
(2004). Feedback Control of Computing Systems.
John Wiley & Sons.
Hines, M. R., Gordon, A., Silva, M., Silva, D. D., Ryu,
K., and Ben-Yehuda, M. (2011). Applications know
best: Performance-driven memory overcommit with
ginkgo. In 2011 IEEE Third International Conference
on Cloud Computing Technology and Science, pages
130–137.
Lim, H. C., Babu, S., Chase, J. S., and Parekh, S. S. (2009).
Automated control in cloud computing: Challenges
Assuring Cloud QoS through Loop Feedback Controller Assisted Vertical Provisioning
185

and opportunities. In Proceedings of the 1st Workshop
on Automated Control for Datacenters and Clouds,
ACDC ’09, pages 13–18, New York, NY, USA. ACM.
Lorido-Botran, T., Miguel-Alonso, J., and Lozano, J. A.
(2014). A review of auto-scaling techniques for elastic
applications in cloud environments. Journal of Grid
Computing, 12(4):559–592.
Mestre, D. G., Pires, C. E. S., and Nascimento, D. C.
(2017). Towards the efficient parallelization of multi-
pass adaptive blocking for entity matching. Journal of
Parallel and Distributed Computing, 101:27 – 40.
Molt
´
o, G., Caballer, M., and de Alfonso, C. (2016). Auto-
matic memory-based vertical elasticity and oversub-
scription on cloud platforms. Future Generation Com-
puter Systems, 56:1 – 10.
Morais, F. J. A., Brasileiro, F. V., Lopes, R. V., Santos,
R. A., Satterfield, W., and Rosa, L. (2013). Autoflex:
Service agnostic auto-scaling framework for iaas de-
ployment models. In 2013 13th IEEE/ACM Interna-
tional Symposium on Cluster, Cloud, and Grid Com-
puting, pages 42–49.
Park, S. and Humphrey, M. (2009). Self-tuning vir-
tual machines for predictable escience. In 2009 9th
IEEE/ACM International Symposium on Cluster Com-
puting and the Grid, pages 356–363.
Sedaghat, M., Hernandez-Rodriguez, F., and Elmroth, E.
(2013). A virtual machine re-packing approach to the
horizontal vs. vertical elasticity trade-off for cloud au-
toscaling. In Proceedings of the 2013 ACM Cloud and
Autonomic Computing Conference, CAC ’13, pages
6:1–6:10, New York, NY, USA. ACM.
Spinner, S., Herbst, N., Kounev, S., Zhu, X., Lu, L., Uysal,
M., and Griffith, R. (2015). Proactive memory scaling
of virtualized applications. In 2015 IEEE 8th Interna-
tional Conference on Cloud Computing, pages 277–
284.
Tasoulas, E., Haugerud, H., and Begnum, K. (2012). Bayl-
locator: A proactive system to predict server utiliza-
tion and dynamically allocate memory resources us-
ing bayesian networks and ballooning. In Proceedings
of the 26th International Conference on Large Instal-
lation System Administration: Strategies, Tools, and
Techniques, lisa’12, pages 111–122, Berkeley, CA,
USA. USENIX Association.
Turowski, M. and Lenk, A. (2014). Vertical scaling capabil-
ity of openstack - survey of guest operating systems,
hypervisors, and the cloud management platform. In
ICSOC Workshops.
Yazdanov, L. and Fetzer, C. (2012). Vertical scaling for
prioritized vms provisioning. In 2012 Second Inter-
national Conference on Cloud and Green Computing,
pages 118–125.
Zhu, Q. and Agrawal, G. (2012). Resource provisioning
with budget constraints for adaptive applications in
cloud environments. IEEE Transactions on Services
Computing, 5(4):497–511.
CLOSER 2019 - 9th International Conference on Cloud Computing and Services Science
186
