
Suggesting Software Measurement Plans with Unsupervised Learning
Data Analysis
Sarah A. Dahab
a
and Stephane Maag
b
Telecom SudParis, CNRS UMR 5157, Univ. Paris-Saclay, France
Keywords: Software Metrics, Software Measurement, Measurement Plan, SVM, X-MEANS.
Abstract:
Software measurement processes require to consider more and more data, measures and metrics. Measurement
plans become complex, time and resource consuming, considering diverse kinds of software project phases.
Experts in charge of defining the measurement plans have to deal with management and performance con-
straints to select the relevant metrics. They need to take into account a huge number of data though distributed
processes. Formal models and standards have been standardized to facilitate some of these aspects. However,
the maintainability of the measurements activities is still constituted of complex activities.
In this paper, we aim at improving our previous work, which aims at reducing the number of needed software
metrics when executing measurement process and reducing the expertise charge. Based on unsupervised learn-
ing algorithm, our objective is to suggest software measurement plans at runtime and to apply them iteratively.
For that purpose, we propose to generate automatically analysis models using unsupervised learning approach
in order to efficiently manage the efforts, time and resources of the experts.
An implementation has been done and integrated on an industrial platform. Experiments are processed to
show the scalability and effectiveness of our approach. Discussions about the results have been provided.
Furthermore, we demonstrate that the measurement process performance could be optimized while being ef-
fective, more accurate and faster with reduced expert intervention.
1 INTRODUCTION
Software measurement is currently gaining in pop-
ularity and effectiveness due to several break-
through advancements in data collecting techniques,
data analysis, artificial intelligence, human factors,
etc. (Oivo et al., 2018). Measurements are used in
many research and industrial areas to monitor the
involved processes in order to improve the produc-
tion(s), reduce the costs (time and resources), manage
the human efforts, etc. (Dumke and Abran, 2013). To
tackle these purposes, diverse techniques have been
developed and integrated in most of the industrial pro-
cesses. From measurement plans defined by experts
(often the project, software or system managers ad-
vised by engineers), these approaches collect an im-
portant amount of data that are semi-automatically an-
alyzed. This analysis allows to raise issues, alarms to
fix or improve the measured elements.
In a previous work (Dahab et al., 2018), we con-
ducted an interesting and promising research work
a
https://orcid.org/0000-0003-4253-1857
b
https://orcid.org/0000-0002-0305-4712
to fully automate the definition of software measure-
ment plans at runtime. Indeed, in most real case stud-
ies, that process is fixed in a sense that the expert
measures all what he can and not necessarily what
he needs. Then a huge amount of data are unneces-
sarily collected and analyzed. Our previous work has
shown that measurement plans can be suggested and
adjusted at runtime through an automatic learning-
based methodology in reducing the amount of col-
lected data. In this current novel work, we increase
our efforts in the analysis and efficiency of software
measurement by introducing unsupervised learning
algorithm, and we specifically demonstrate the ef-
fectiveness of considering the clustering approach X-
MEANS (Pelleg and Moore, 2000) to reduce further
the management cost and improve the performance
of such a process. We herein use X-MEANS to au-
tomatically generate correlations of a sample of data
through clustering by generating a training file as in-
put to our previous suggestion approach.
Software measurement is an empirical science
which depends on the experience (Fenton and Neil,
2000). It is impossible to define a generic mea-
Dahab, S. and Maag, S.
Suggesting Software Measurement Plans with Unsupervised Learning Data Analysis.
DOI: 10.5220/0007768101890197
In Proceedings of the 14th International Conference on Evaluation of Novel Approaches to Software Engineering (ENASE 2019), pages 189-197
ISBN: 978-989-758-375-9
Copyright
c
2019 by SCITEPRESS – Science and Technology Publications, Lda. All rights reserved
189

surement analysis model. It depends on the soft-
ware project, the used language, the used computer.
Thereby, to evaluate a software, it is needed to know
the context of the measured object, as well as, to ana-
lyze a software evaluation is needed to know the con-
text. That is what makes difficult to automate a soft-
ware measurement analysis. And this is to handle this
lack that we propose to use an unsupervised learn-
ing technique, which will learn from a measurement
dataset of a software to generate the corresponding
analysis model and reduce the expert load and the re-
lated time cost.
In our novel work, our objective is to use this
learning technique not only to reduce the time cost
and the expert load by automatically generating a
training file, but also to facilitate analysis model val-
idation specific to software quality analysis and per-
haps enable a more efficient future measurement pro-
cess than in other older engineering systems, i.e, elec-
tricity, biology, physics, etc. Indeed, those have well-
defined measurement plans like their analysis mod-
els allowing standard measurement protocol, effective
and available to everyone.
Regarding our main contributions, they are sum-
marized in the following:
• We use unsupervised learning approach as gen-
erator of analysis models in order to reduce the
time cost, expert cost while improving the perfor-
mance.
• We formally define our software measurement
analysis and suggestion tool.
• And we experiment and assess our approach to
suggest software metrics.
2 PRELIMINARIES
This section defines the application domain, that is
the software measurement. First, we briefly formally
define the concept of software measurement, then we
introduce the ISO/IEC 25000 standard on which we
base our domain knowledge, at last we define the
analysis context, the data model.
2.1 Software Measurement Definitions
Software measurement concepts have been formally
defined in many research papers and standards, im-
plemented in tools and are now used for several in-
dustrial works. We provide few basic definitions that
we use in our work.
A Measure is the calculation evaluating a soft-
ware property (e.g., LoC). Formally, this is a function
f : A → B|A ∈ X ,B ∈ B that, from a set of measur-
able properties A of an object X (also named measur-
and in software measurement), assigns a value B of
a set B. A Measurement is then a quantification of a
measured property (Fenton and Bieman, 2014). For-
mally, it refers to the result y of the measure f such as
y = f (A)|A ∈ X.
In our work, these functions have been formally
used, implemented and integrated within an industrial
platform. For that, other concepts need to be defined.
A Metric is the formal specification of a measure-
ment. It specifies the measurand, the measure(s) and
the software property to be measured. Finally, since
one of the main contributions of our work is to im-
prove the software measurement plans at runtime, we
define a Measure Plan as an ordered set of metrics. It
is expected to be executed at a specific time t or dur-
ing a well-defined duration (depending on the measur-
and(s), the platform, the users, the probes, etc.) and
according to an ordered metrics sequence. Besides,
they can be run sequentially or in parallel.
2.2 ISO/IEC 25000 - A Standardization
of Software Measurement Process
We try to improve the software measurement process
by using learning algorithms to reduce the costs of
management and analysis. For that, we try to reduce,
on one hand, the expertise charge using unsupervised
learning algorithm and on the other hand, to optimize
the measurement process performance by reducing its
processing load.
In order to reduce the processing load, we pro-
posed (Dahab et al., 2018) a suggestion algorithm.
The aim of this latter is to analyze a set of measure-
ments during a period of time and according to the
analysis result a suggestion of a new measurement
plan is generated. This allows to reduce the process-
ing load by executing at each time the metrics of in-
terest according to the software needed instead of ex-
ecuting all the metrics each time.
To do this, it is necessary to determine the soft-
ware properties to be analyzed and the corresponding
metrics. Therefore, we base our work on the standard
ISO/IEC 25000 (ISO, 2005) which defines within 4
divisions the software quality and the measurement
of the quality of a software. Especially, the ISO/IEC
25010 (ISO/IEC, 2010) division defines the software
properties, 8 for quality product, which describe the
software quality. And the ISO/IEC 25020 (ISO, 2007)
division defines the measures (or metrics), more than
200, which give information on these properties.
Our correlation model explained in the next sec-
tion is based on this model.
ENASE 2019 - 14th International Conference on Evaluation of Novel Approaches to Software Engineering
190

2.3 Software Measurements Model
The analyzed data are software measurements, more
precisely the measurements values. These values give
information on a software at time t.
Definition 1 Measurement Plan: A measurement
plan mp is the ordered set of metrics considered for
the global measurement process and the correlation
between the metrics and the evaluated software prop-
erties y. This is defined by the expert at the beginning
of the process and it never changes. This is the con-
text of our measurement process and the basis for the
suggestion (see 3.1.3).
We define the ordered set m and the set of software
properties y as:
m = {m
1
,...m
n
} (1)
where n is the number of considered metrics and m
i
a
unique metric.
y = {y
1
,...y
l
} (2)
where l is the number of considered properties and y
k
a unique property.
The correlation C is defined as below:
C = (m
i
,y
k
) (3)
where m
i
is the metric i and y
k
the property k. Some
metrics are common to several properties while some
metrics are specific to a single one. These correlations
are used by the suggestion step (cf. 3.1.3).
Finally a mp is defined as a set of metrics m, prop-
erties y and their correlations C:
m = {m
1
,...m
n
}
y = {y
1
,...y
l
}
c = (m
i
,y
k
) m
i
∈ m and y
k
∈ y
(4)
Definition 2 Vector ~v: A vector is the analyzed data
model. This is a set of different metrics values. Each
field of the vector is a value x
i
of a specific metric
executed at time t. Thus, a vector contains a set of
information on a software at time t and it is defined
as:
~v = {x
1
,...x
n
} (5)
Where n is the number of metrics in the measure-
ment plan. These metrics give information on one or
several software properties. This correlation between
software properties and metrics is herein used for the
suggestion of measurement plans.
Definition 3 Feature: A feature is a field of a vector.
It refers to the metric i associated to the field i of a
vector ~v. A feature is unique. The place of metrics
in the vector is fixed. So a feature is a value x
i
in a
vector~v
Definition 4 Class: A class is a cluster of vectors. It
refers to a group of vectors with close values. In a
broader sense, it refers to a group of vectors provid-
ing the same information type on the software and is
defined as below:
class = {~v
1
,...~v
p
} (6)
Where p is the number of vectors classified in the
class.
3 OUR UNSUPERVISED
LEARNING APPROACH
In this paper, we use our suggestion approach to im-
prove the result of our previous works, well defined in
the paper(Dahab et al., 2018), where our purpose was
to generate flexible measurement plans adapted to the
software need, thus allowing to reduce the analysis
cost and the one of the software measurement pro-
cess.
However, this approach is still dependent to the
expert for the initialization step, especially for the
elaboration of the training file. As a reminder, this
file is used to train the classifier and it defines the cor-
relation between vectors and classes. So, the analysis
model is manually done. Thus, the cost time of this
step is high when the samples to classify are highly
numerous.
In order to handle this lack, we propose to use
an unsupervised learning algorithm to generate au-
tomatically an analysis model. From an unlabeled
software measurements sample, a labeled one is gen-
erated. This output is then used as training file to
train the classifier used for the analysis and sugges-
tion steps.
The purpose is to use a clustering algorithm. It
will group in clusters the similar vectors of measure-
ments then according to the clustering result, the ex-
pert will associate to each cluster a set of metrics
to suggest (see 2.2). Herein, the expert interven-
tion only appears for determinating the correlation be-
tween classes corresponding to the clusters, and set of
metrics.
Our improved suggestion approach is based on
three procedures:
• The elaboration, through software measurements
clustering based on unsupervised learning ap-
proach X-MEANS, of an analysis model (or map-
ping system as called in our previous work),
Suggesting Software Measurement Plans with Unsupervised Learning Data Analysis
191

herein considered as the initial measurement plan
mp.
• An analysis procedure, which aims to highlight a
software property of interest through a software
metrics classification, based on a learning tech-
nique, herein SVM.
• A suggestion of metrics based on the mp, the anal-
ysis result and the features selection procedure,
which aim to determine the needed metrics (nm),
for the conservation of information and based on
the learning technique RFE.
In the next sections, we briefly describe our met-
rics suggestion approach that is improved and for-
malized. Then we introduce the X-MEANS tech-
nique.
3.1 Our Metrics Suggester Approach
This approach is based on three procedures :
• The initialization of the measurement plan,
• The analysis of measurements data through the
supervised classification algorithm SVM,
• And the suggestion of novel measurement plans.
3.1.1 The Initial Measurement Plan
The initial measurement plan is the basis of our sug-
gestion algorithm. Indeed, the analysis and the sug-
gestion are based on it.
The initial measurement plan is elaborated by the
expert and it defines the observed set of metrics, the
corresponding software properties and the mandatory
metrics, the ones that must always be in the suggested
measurement plans.
This MP is the definition of the measurement con-
text : what is observed by the software properties,
how it is observed by the set of metrics related to the
properties and the mandatory ones.
The set of metrics groups all the metrics that could
be computed during all the measurement process.
Thus, the suggestion is a subset of this set of metrics.
3.1.2 The Analysis
The analysis consists in classifying a set of measure-
ment data, more precisely a set of vectors ~v. Each
vector is classified in one class which refers to a soft-
ware property defined in the initial measurement plan
and related to ISO/IEC 25000. To classify the data we
use a supervised learning algorithm SVM.
SVM is a linear classifier trained through a train-
ing file. This file is elaborated by the expert and it
corresponds to a manual classification. Indeed, the
expert classifies a set of vectors by labelling each vec-
tor by a class. Then, a classifier is trained according
to this manual classification. Thereby a specific clas-
sifier is then used for a specific analysis. The training
file corresponds to the initial measurement plan. The
used labels should correspond to the defined class as
the set of metrics classified. In fact, the suggestion is
based on this specific classification.
It means that each time we want to change the
context of the measurement process, a new training
file should be done by an expert to generate the corre-
sponding classifier. And this was the main limitation
of our approach. Despite an automated and ”smart”
analysis, our approach is still highly dependent to the
expert and quite costly in time.
3.1.3 Suggestion
The suggestion is based on the classification result
and the initial measurement plan.
The result of the classification is a set of clusters.
The number of clusters is the number of defined class
and the data in the clusters is the set of vectors gather-
ing during the measurement process. From this set of
clusters, we choose the one with the largest number
of vectors classified as the class of interest. Then, we
add in the new measurement plan the set of metrics
corresponding to the class of interest defined in the
initial measurement plan. If all the vectors are classi-
fied in the same class, we thus suggest all the metrics.
Next, in the first case, we determine the metrics
which were necessary for the classification by using
the RFE algorithm (Gao et al., 2011). The RFE algo-
rithm used the classifier and the used data to select the
features which allowed the classification result. Once
the selection is done, we add the selected features in
the new measurement plan.
Finally, we add the mandatory metrics defined in
the initial measurement if these latter were not se-
lected by the previous steps. Then according to these
steps we generate the new measurement plan as a sug-
gestion.
This procedure is formally described below, by the
Algorithm 1. It takes as input the initial measurement
plan, herein called mp, the trained classifier f and the
set of vectors to be analyzed {~v}.
Where mp
0
is the suggested measurement plan,
mm the defined mandatory metrics and f s the feature
selection algorithm (RFE).
In order to reduce the load of the expert, we aim
at improving this approach by using an unsupervised
learning technique to generate automatically the train-
ing file. The advantage of using this latter is to reduce
the expert cost, but also the dependency of an expert.
ENASE 2019 - 14th International Conference on Evaluation of Novel Approaches to Software Engineering
192
Algorithm 1: Metrics Suggestion.
Input mp, f , {~v}
1: Output mp
0
2: y ← array()
3: n f ← array()
4: for each~v in {~v} do
5: y ← f (~v)
6: end for
7: if y == 0 or y without duplicate == 1 then
8: return mp
9: else
10: n f ← f s( f , {~v})
11: mp
0
← m f +mp[most common(y)]+mp[mm]
12: return mp
0
13: end if
Indeed, as the software measurement is an em-
pirical science, it depends on the experience, on the
software or on the property evaluated. There is as
much model as there is software project. Thereby,
our purpose is to use learning clustering algorithm X-
MEANS as expert to generate automatically the train-
ing file according to a measurement dataset of the
evaluated project. The expert would only intervene to
define the initial measurement plan according to the
result of X-MEANS application.
3.2 Unsupervised-based Analysis Model
Elaboration
X-MEANS (Pelleg and Moore, 2000) is a clustering
algorithm, more precisely it is an extension of the K-
MEANS algorithm.
X-MEANS splits into k clusters a sample of data
without initialization of the number of cluster k. It de-
termines the best k clusters by minimizing the inter-
cluster similarity and satisfying the Bayesian Infor-
mation Criterion BIC score.
For that, it dertermines 2 initial clusters by defin-
ing randomly 2 centro
¨
ıds, then assigns to each data
the closest centro
¨
ıd. Then, it updates the centro
¨
ıds ac-
cording to the sum of distances of each cluster. This
distance D should be the smallest. Finally, it splits
each cluster in two clusters and go to the previous step
to have the lowest inter-cluster. A low inter-cluster
similarity is ensured by assigning a data to the cluster
whose distance to its center is the smallest. Thus, it
tends to minimize this following function D.
D =
k
∑
i=1
n
∑
j=1
|c
i
,x
i
j
| (7)
Before each split the BIC score of each cluster
model is computed. As example, the initial number
of cluster is 2. So we have 2 clusters, c and i, with
one centro
¨
ıd each, k = 1. For each cluster we com-
pute its BIC score. Then we split each cluster in two
sub clusters, that’s mean k = 2 for each one. And
then we compute the new BIC score of c and i with
k = 2. If this score is lower than the previous one,
we keep the cluster with k = 1. Else we split another
time each sub cluster in two sub-sub clusters etc. So,
if BIC(c, k = 1) > BIC(c,k = 2) we keep c with k = 1.
And if BIC(i, k = 1) < BIC(i, k = 2) we keep i with
k = 2 and we split each sub cluster of i in two sub sub
clusters while c remains unchanged. After the split-
ting process this score is used to determine the best
model : the one with the higher BIC score.
Once the clustering is done, we have a labeled
dataset. From this labeled dataset the expert design
the correlations between the clusters and set of met-
rics, then it is used as training dataset to train the clas-
sifier.
4 EXPERIMENT
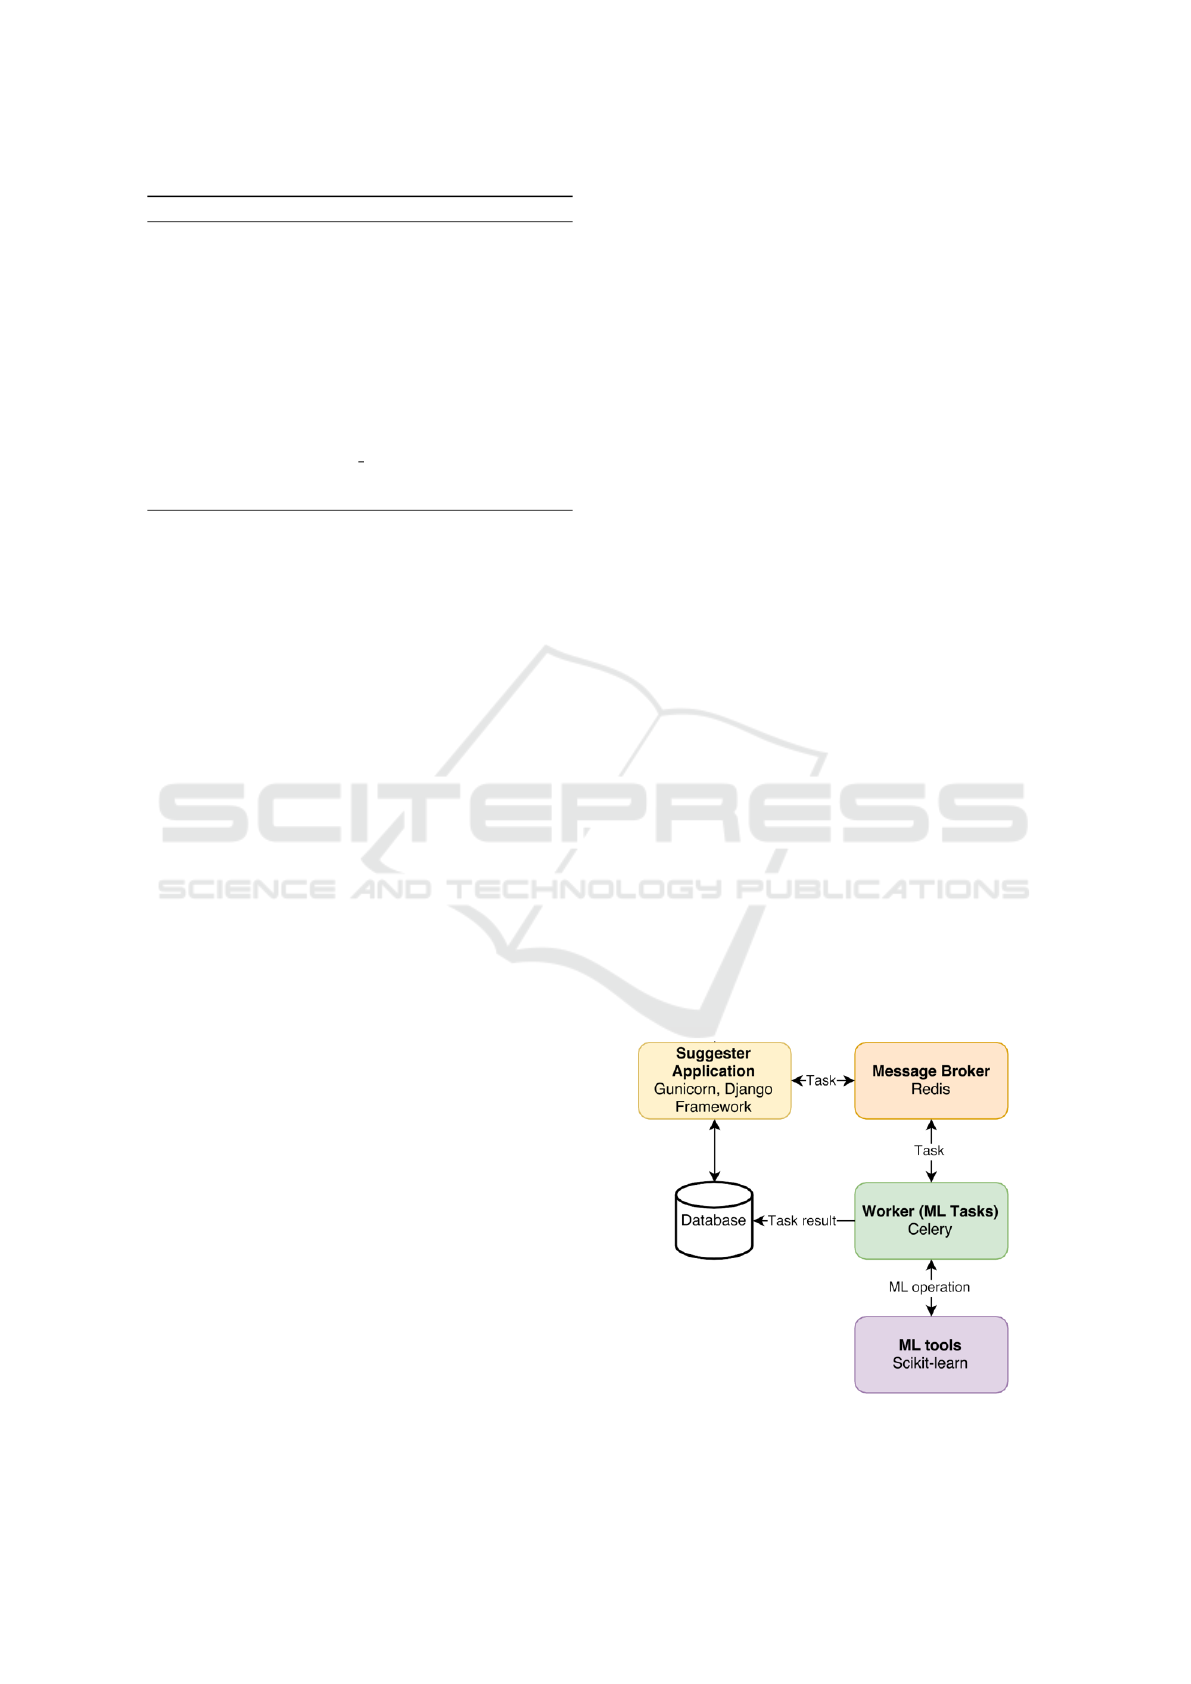
Our analysis and suggestion tool is built as a web
application as illustrated in the Figure 1. The archi-
tecture is organized around the machine learning unit
(ML tool), which regroups the classification and fea-
ture selection algorithms. The first one is used to train
the classifier, through the training file, and then to an-
alyze the data by classifying it according to the trained
classifier; the second one is used to determine the
necessary features (herein metrics) to the classifica-
tion. We use this latter to determine dynamically the
mandatory metrics for the next analysis. The library
used to develop the learning algorithms is scikit-learn
(Pedregosa et al., 2011).
Figure 1: Our Metrics Suggester tool architecture.
Suggesting Software Measurement Plans with Unsupervised Learning Data Analysis
193
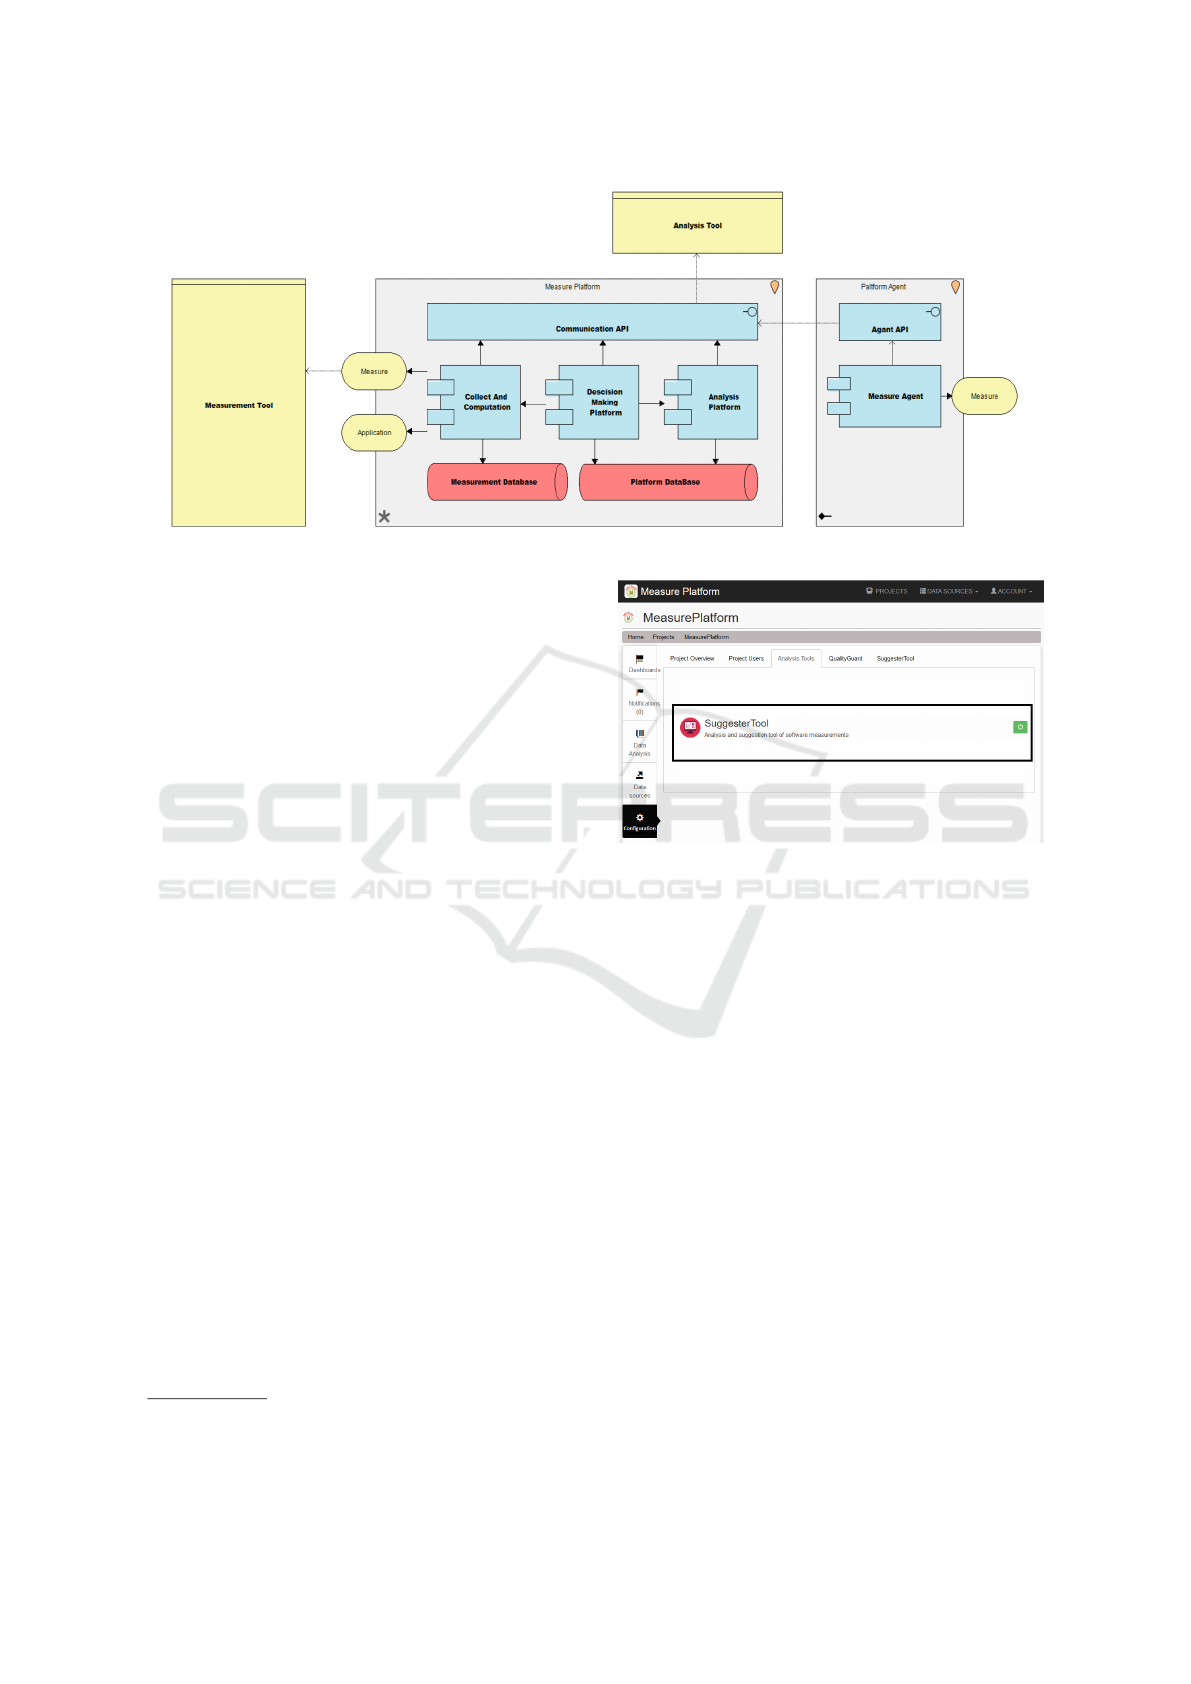
Figure 2: Overview of the MEASURE platform.
As our work is taking part of a European project
MEASURE, its implementation has been integrated
in the related industrial platform as an analysis tool.
4.1 Industrial MEASURE Platform
Integration
The MEASURE Platform
1
is the research result of the
European project ITEA3 MEASURE
2
. This project
aims to improve the whole software measurement
processes. For that, this platform proposes a database
as storage of software metrics specified and developed
according to the standard language SMM; a storage of
measurement result; a coverage of all the software en-
gineering processes; and analysis tools. As described
in the Figure 2, there is the main measure platform
which enables the communication between the differ-
ent stores and the analysis tool, the measurement tools
and the agent platform. The measurement tools al-
low to use other external measurement tools. And the
agent platform allows a local execution of the metrics
with a storage of results in the platform.
Our Metrics Suggester tool is integrated in the
platform, as shown in the Figure 3, by using the REST
API of the platform. This latter allows to connect our
analysis tool to the platform, to gather stored mea-
surements and to generate a dashboard from the plat-
form.
In the next section, we will present the results of
our improved approach for automatically generating
a software measurement analysis model based on ex-
perience and measurements data history.
1
https://github.com/ITEA3-Measure
2
http://measure.softeam-rd.eu
Figure 3: Industrial integration of our Metrics Suggester
tool.
4.2 Automated Analysis Model
Generation
For evaluating our approach, we used a real industrial
use case provided by one of the MEASURE partners.
This one is based on a modelling tool suite. The anal-
ysis of this tool focuses on the developed Java code.
4.2.1 Experimental Setup
The considered set of metrics for the measurement
process includes 13 metrics giving information on 3
software properties, as described in Table 4. This MP
is defined by the measurement context : the observed
metrics during all the processes and the mandatory
ones. The properties or classes give information on
what is evaluated, but the actual number of classes
will be determined by the X-MEANS algorithm. In
fact, the initial measurement plan will be defined ac-
cording to the result of the X-MEANS execution, the
expert will define the correlations between subsets of
metrics and clusters.
The metrics related to the Maintainability property
ENASE 2019 - 14th International Conference on Evaluation of Novel Approaches to Software Engineering
194
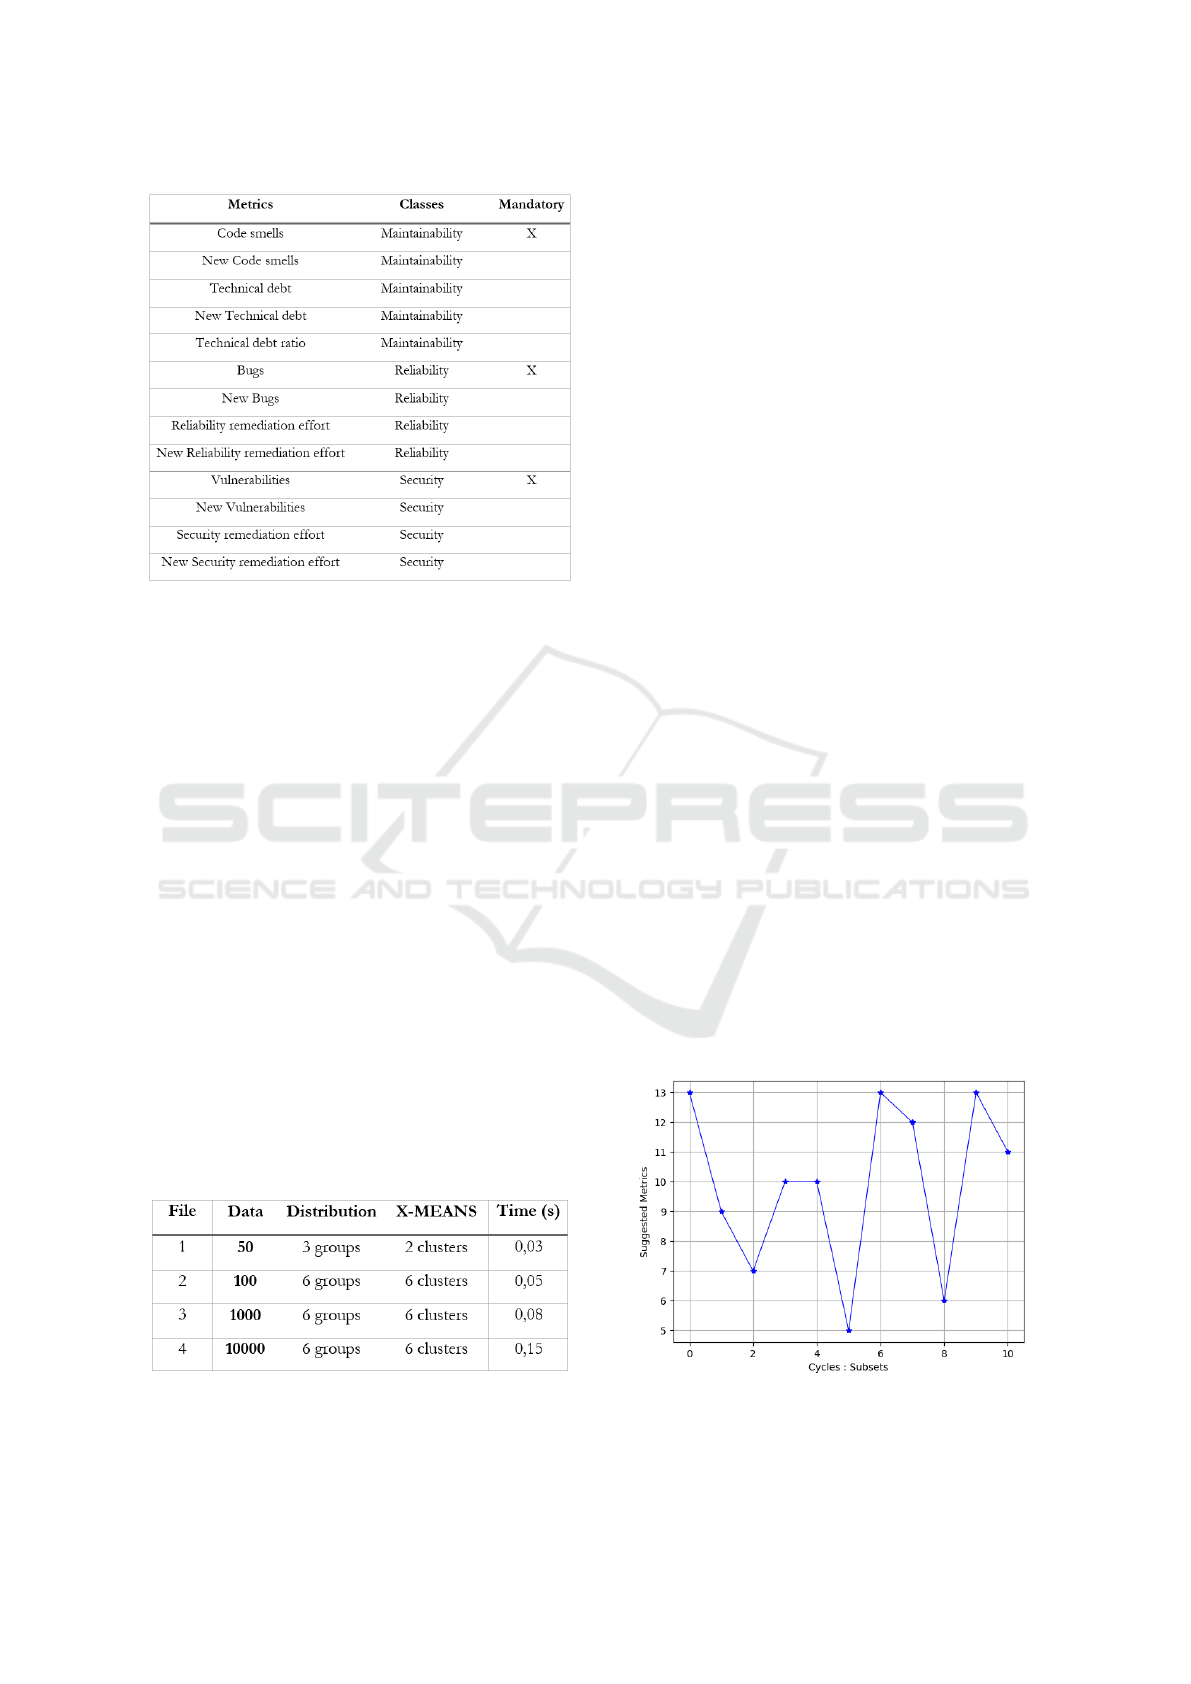
Figure 4: Measurement Plan.
give information on the quality of the code. The ones
related to Reliability give information on the reliabil-
ity of the services and the Security ones are about the
vulnerabilities in the code.
In order to execute X-MEANS, we generate a file
with a fixed amount of data and a fixed number of
group corresponding to a vector type : the data are
vectors with values which correspond to a property.
For example, the fields corresponding to the metrics
related to the maintainability property are high and
the others are low, herein called vector-type. The ob-
jectives are twofold, first to verify if the clustering re-
sult matches with the expectation and if the sugges-
tion still provides correct results with the automated
labeled data set as input training file.
4.2.2 Clustering Results
As depicted in the Figure 5, the data are homoge-
neously distributed in the files 1 and 2: there is the
same amount of vector types in each group. A group
is a vector-type set. Finally, the data in the files 3 and
4 are heterogeneously distributed. There is a different
amount of vectors in each group.
Figure 5: Unsupervised clustering results.
The column Data gives the amount of vectors per
file and the column Distribution gives the number of
vector-type.
Regarding the clustering result, we can see that
when the file is too small, the clustering accuracy
is not high. Indeed, the file 1 with 50 vectors and
3 vector-type is grouped in two homogeneous clus-
ters while we expected 3 groups. But with files con-
taining more data, the clustering result is better and
promising. The accuracy result is better and they cor-
respond to the expectations: the number of clusters
corresponds to those in the groups and the distribu-
tion of the vectors in the clusters complies with those
in the groups.
To conclude, X-MEANS shows a good perfor-
mance to learn as an expert from experiences and to
provide a reliable analysis model with considerable
time savings. But also, this can be used as models
validator, in order to verify the validity of data model.
4.2.3 Suggestion Results
Finally, the initial measurement plan is defined by the
expert according the previous step result. In fact, the
expert will add to the MP presented in the Figure 1
the correlation between clusters and a metrics subset.
Once the initial mp is defined, we train the classi-
fier with the file 3. Then, as suggestion experiment,
we use as input files to analyze, a dataset of 50000
unclassified vectors divided in 10 subsets of 5000 un-
classified vectors. The objective is to see if the sug-
gestion provides correct plans (of metrics).
The Figure 6 shows the results of suggestions
based on the previous analysis model. The results
show a dynamic suggestion of mp. Each mp is be-
tween 5 and 13 metrics. There is no convergence
(e.g., deadlock or undesired fixity in the generated
plans) and the suggested mp evolves continuously ac-
cording to the dataset values.
Figure 6: Suggestions results.
Suggesting Software Measurement Plans with Unsupervised Learning Data Analysis
195

5 RELATED WORKS
Standardization institutes put lots of efforts in defin-
ing. They focus on the definition and formaliza-
tion of software quality models such as the ISO9126
that qualifies and quantifies functional and non-
functional properties with software metrics (Carvallo
and Franch, 2006). Besides, two other standardiza-
tion institutes worked in that way to propose two com-
monly used norms namely ISO/IEC25010 (Kitchen-
ham, 2010) and OMG SMM (Bouwers et al., 2013)
in order to guide the measurement plan specifica-
tion. These two last standards have been reviewed
by the research and industrial community, and are
adapted, integrated and applied in many domains.
In the research literature, several works on software
metrics selection for software quality have been pro-
vided (Gao et al., 2011). Recent techniques based
on learning approaches have been proposed. Most
of them are dedicated to software defect predic-
tion (Shepperd et al., 2014), (MacDonald, 2018),
(Laradji et al., 2015), metrics selection (Bardsiri and
Hashemi, 2017) or even Software testing (Kim et al.,
2017). However, even if these techniques have intro-
duced considerable progress to improve the software
quality, they have still some limitations. The mea-
surement plan is still manually fixed by the project
manager or the experts in charge of its definition. Fur-
thermore, the implementation of the measures is de-
pendent on the developer and reduce the scalability,
maintainability and the interoperability of the mea-
surement process.
While a current study shows the lacks in the use of
learning technique for software measurement analysis
(Hentschel et al., 2016), there are in literature some
works which use supervised learning algorithms, es-
pecially for software defect prediction (Laradji et al.,
2015; Shepperd et al., 2014) or for prioritize software
metrics (Shin et al., 2011). Indeed, there are a lot of
software metrics, and currently the measurement pro-
cesses execute all the metrics continuously. This lat-
ter shows that we can prioritize the metrics and thus
reduce the number of metrics to be executed.
There are also works which propose to use un-
supervised learning technique to estimate the quality
of software (Zhong et al., 2004b) as ”expert-based”.
They also propose to base on clustering techniques to
analyze software quality (Zhong et al., 2004a). Other
works propose to combine supervised and unsuper-
vised learning techniques to predict the maintainabil-
ity of an Oriented Object software (Jin and Liu, 2010).
But all of these works focus on the analysis or pre-
diction of one software property. The aim of our
approach is to allow the less of expert dependency
to evaluate all the software engineering process, and
to suggest flexible mp continuously according to the
software need.
6 CONCLUSION &
PERSPECTIVES
In this paper, we proposed to improve our previous
work by reducing the expert dependency to the man-
agement of the analysis process. For that, we propose
to use an unsupervised learning algorithm X-MEANS
to take the place of the expert and to generate auto-
matically an analysis model by learning from an his-
torical database. The objective is to reduce the man-
agement cost, and the time cost.
Well implemented and experimented, this ap-
proach shows the possibility to generate a reliable
model with a low time cost, and also to verify the va-
lidity of manual models.
The promising results demonstrate us the benefi-
cial contribution of using learning techniques in the
software measurement area. Thereby, as perspective,
it could be interesting to analyze the differences be-
tween automated models and manual models and also
to increase the independence to the expert by gener-
ating automatically the correlations between clusters
and metrics subsets. A statistic method on the weight
of features could be envisaged in future works.
REFERENCES
Bardsiri, A. K. and Hashemi, S. M. (2017). Machine learn-
ing methods with feature selection approach to esti-
mate software services development effort. Interna-
tional Journal of Services Sciences, 6(1):26–37.
Bouwers, E., van Deursen, A., and Visser, J. (2013). Evalu-
ating usefulness of software metrics: an industrial ex-
perience report. In Notkin, D., Cheng, B. H. C., and
Pohl, K., editors, 35th International Conference on
Software Engineering, ICSE ’13, San Francisco, CA,
USA, May 18-26, 2013, pages 921–930. IEEE Com-
puter Society.
Carvallo, J. P. and Franch, X. (2006). Extending the iso/iec
9126-1 quality model with non-technical factors for
cots components selection. In Proceedings of the 2006
International Workshop on Software Quality, WoSQ
’06, pages 9–14, New York, NY, USA. ACM.
Dahab, S., Porras, J. J. H., and Maag, S. (2018). A novel for-
mal approach to automatically suggest metrics in soft-
ware measurement plans. In Proceedings of the 13th
International Conference on Evaluation of Novel Ap-
proaches to Software Engineering, ENASE 2018, Fun-
chal, Madeira, Portugal, March 23-24, 2018., pages
283–290.
ENASE 2019 - 14th International Conference on Evaluation of Novel Approaches to Software Engineering
196

Dumke, R. and Abran, A. (2013). Software measurement:
current trends in research and practice. Springer Sci-
ence & Business Media.
Fenton, N. and Bieman, J. (2014). Software metrics: a rig-
orous and practical approach. CRC Press.
Fenton, N. E. and Neil, M. (2000). Software metrics:
roadmap. In Proceedings of the Conference on the Fu-
ture of Software Engineering, pages 357–370. ACM.
Gao, K., Khoshgoftaar, T. M., Wang, H., and Seliya, N.
(2011). Choosing software metrics for defect predic-
tion: an investigation on feature selection techniques.
Software: Practice and Experience, 41(5):579–606.
Hentschel, J., Schmietendorf, A., and Dumke, R. R. (2016).
Big data benefits for the software measurement com-
munity. In 2016 Joint Conference of the International
Workshop on Software Measurement and the Interna-
tional Conference on Software Process and Product
Measurement (IWSM-MENSURA), pages 108–114.
ISO, I. (2005). Iec 25000 software and system engineering–
software product quality requirements and evaluation
(square)–guide to square. International Organization
for Standarization.
ISO, I. (2007). Iec 25020 software and system engineering–
software product quality requirements and evaluation
(square)–measurement reference model and guide. In-
ternational Organization for Standarization.
ISO/IEC (2010). Iso/iec 25010 system and software quality
models. Technical report.
Jin, C. and Liu, J.-A. (2010). Applications of support vec-
tor mathine and unsupervised learning for predicting
maintainability using object-oriented metrics. In Mul-
timedia and Information Technology (MMIT), 2010
Second International Conference on, volume 1, pages
24–27. IEEE.
Kim, J., Ryu, J. W., Shin, H.-J., and Song, J.-H. (2017).
Machine learning frameworks for automated software
testing tools: A study. International Journal of Con-
tents, 13(1).
Kitchenham, B. A. (2010). What’s up with software met-
rics? - A preliminary mapping study. Journal of Sys-
tems and Software, 83(1):37–51.
Laradji, I. H., Alshayeb, M., and Ghouti, L. (2015). Soft-
ware defect prediction using ensemble learning on se-
lected features. Information & Software Technology,
58:388–402.
MacDonald, R. (2018). Software defect prediction from
code quality measurements via machine learning. In
Advances in Artificial Intelligence: 31st Canadian
Conference on Artificial Intelligence, Canadian AI
2018, Toronto, ON, Canada, May 8–11, 2018, Pro-
ceedings 31, pages 331–334. Springer.
Oivo, M., Fern
´
andez, D. M., and Mockus, A., editors
(2018). Proceedings of the 12th ACM/IEEE Interna-
tional Symposium on Empirical Software Engineering
and Measurement, ESEM 2018, Oulu, Finland, Octo-
ber 11-12, 2018. ACM.
Pedregosa, F., Varoquaux, G., Gramfort, A., Michel, V.,
Thirion, B., Grisel, O., Blondel, M., Prettenhofer,
P., Weiss, R., Dubourg, V., Vanderplas, J., Passos,
A., Cournapeau, D., Brucher, M., Perrot, M., and
Duchesnay, E. (2011). Scikit-learn: Machine learning
in Python. Journal of Machine Learning Research,
12:2825–2830.
Pelleg, D. and Moore, A. (2000). X-means: Extending k-
means with efficient estimation of the number of clus-
ters. In In Proceedings of the 17th International Conf.
on Machine Learning, pages 727–734. Morgan Kauf-
mann.
Shepperd, M. J., Bowes, D., and Hall, T. (2014). Researcher
bias: The use of machine learning in software defect
prediction. IEEE Trans. Software Eng., 40(6):603–
616.
Shin, Y., Meneely, A., Williams, L., and Osborne, J. A.
(2011). Evaluating complexity, code churn, and devel-
oper activity metrics as indicators of software vulnera-
bilities. IEEE Transactions on Software Engineering,
37(6):772–787.
Zhong, S., Khoshgoftaar, T., and Seliya, N. (2004a). An-
alyzing software measurement data with clustering
techniques. IEEE Intelligent Systems, 19(2):20–27.
Zhong, S., Khoshgoftaar, T. M., and Seliya, N. (2004b). Un-
supervised learning for expert-based software quality
estimation. In HASE, pages 149–155. Citeseer.
Suggesting Software Measurement Plans with Unsupervised Learning Data Analysis
197
