
Using Enterprise Modeling in Development of New Business Models
Ilia Bider
1
and Azeem Lodhi
2
1
Department of Computer and Systems Sciences, Stockholm University, Stockholm, Sweden
2
Faculty of Computer Science, Otto von Guericke University, Magdeburg, Germany
Keywords: Business Model, Enterprise Model, Business Process Architecture, Business Model Innovation.
Abstract: In the dynamic world of today, enterprises need to be innovative not only in their current line of products and
services, but also in their business models. One of the challenges in Business Model Innovation (BMI) is to
introduce radical changes in the current business model when entering new markets. Ideas for new models
can come from various sources, however each such idea needs to be analysed from the sustainability and
implementation perspectives. This paper evaluates whether enterprise modelling can help in analysis of
hypotheses for radical changes of BMI. The evaluation is carried on a particular practice of an organization.
Analysis of a new idea has been done using a so-called Fractal Enterprise Model (FEM). FEM ties various
enterprise business processes together and connects them to enterprise assets (resources) that are used and/or
are managed by the processes. FEM has been used to understand which new assets and processes should be
acquired, and which existing ones can be reused when planning the implementation of a new business model.
1 INTRODUCTION
In the dynamic world of today, enterprises need to be
innovative. The innovative power, however, cannot
be focused only on the current lines of products and
services. From time to time, companies need to revise
who they are and what they do, which means innovate
their Business Models (BM). This is needed in order
to survive in the turbulent, technology driven
business environment. For example, in the future, a
traditional manufacturing company that both designs
and manufactures their products may decide that they
would better concentrate only on one aspect of their
current business. The company then can become a
manufacturer who produces goods based on
somebody else's design, or a designer – designing
goods to be manufactured by somebody else. This
was the case in different companies where they
changed their business model like LEGO (Robertson
and Hjuler, 2009), TSMC (Su and Huang, 2006).
In light of the above, it is not a surprise that the
topics of Business Model Generation and Business
Model Innovation (BMI) have got attention from both
practitioners and researchers. On the practical side, it
is expressed by widespread usage of business model
canvas (Osterwalder and Pigneur, 2014), and its
numerous variations for communication and
brainstorming purposes. The interest on the research
side expresses itself in numerous research
publications devoted to BMI, including books
(Andreini and Bettinelli, 2017) and special issues of
journals (Mangematin et al., 2017).
Roughly, the BMI process can be divided into two
phases (Bider and Perjons, 2017): (I) generating
hypotheses – new ideas on how the new BM could
look like, and (II) assessing the hypotheses. The latter
includes defining what existing resources/capabilities
can be used in a new BMI, at what extent, and what
needs to be acquired in addition to the existing
resources. In this paper, we concentrate on the second
phase – analysis, considering that the main idea of a
new BM already exists.
Regarding the essence of BMI, we use the
classification suggested in (Giesen et al., 2007) that
differentiates three ways of innovating a BM:
1. Industry model innovation - which amounts to
changing the position in the value chain, entering
new markets, and/or other types of radical
changes.
2. Revenue model innovation - which results in
changes in how a company generates revenues,
e.g. reconfiguring offerings and/or introducing
new pricing models.
3. Enterprise model innovation – which involves
innovating the structure of an enterprise, such as
Bider, I. and Lodhi, A.
Using Enterprise Modeling in Development of New Business Models.
DOI: 10.5220/0007769205250533
In Proceedings of the 21st International Conference on Enterprise Information Systems (ICEIS 2019), pages 525-533
ISBN: 978-989-758-372-8
Copyright
c
2019 by SCITEPRESS – Science and Technology Publications, Lda. All rights reserved
525

enterprise goals, business processes, products
and/or services.
In this paper, we focus exclusively on the first
type of BMI, i.e. industry model innovation. In
addition, we are interested only in such an innovation
that relies on the capabilities already existing in the
organization. An example of such BMI is the case of
Amazon Web Services where existing infrastructure
was used to provide services to other organizations;
this case was reconstructed in (Bider and Perjons,
2017). In comparison, we do not focus on industrial
BMI cases where a new model concerns a completely
new business activity, i.e. an activity not connected,
whatsoever, with the current ones.
The objective of this paper is to investigate
whether an enterprise model can be used for analysis
of BMI hypotheses. Here, we try only one enterprise
modelling type – Fractal Enterprise Model (FEM)
from (Bider et al., 2017), and follow the ideas drafted
in a general way in (Bider and Perjons, 2017). The
choice of modelling technique is personal, as the first
co-author of this work is part of the team engaged in
FEM development.
The question will be answered based on applying
FEM for analysis of a particular hypothesis generated
in an organization. The organization in question is a
real company to which the second co-author has been
attached for some time.
The hypothesis that we analyse can be formulated
as "becoming a provider of services that can predict
the needs for maintenance of specific machines used
in manufacturing lines". The idea itself is not
completely new in nature as it was used by Rolls
Royce in TotalCare (Rolls Royce, 2017) where
customer responsibilities were taken at supplier end.
However, the idea in our case is new in the sense that
it may not belong to the core operations of an
organization. The idea itself was created
independently of current work and FEM. We applied
FEM only to understand which existing assets and
processes of the organization could be used in a new
BM, which new assets and processes need to be
added, and what challenges exist on the way of
practically implementing the new BM.
The rest of the paper is structure in the following
way. In section 2, we give an overview of FEM so
that the reader does not need to go elsewhere to obtain
this knowledge. In Section 3, we present the business
case as it is, including parts that will be used for BMI
in the next section. This section presents also a FEM
for the important for our consideration part of the
business. In Section 4, we present the main idea of
BMI and build a FEM for a business-to-be. Then, we
analyse the difference between the two FEMs, the
current and the new one and discuss what could be
used from the existing capabilities and what needs to
be created from scratch. In section 5, we summarize
our findings and discuss the difference of our
approach to new BMs analysis from using the
standard BM canvas, and draw plans for the future.
2 OVERVIEW OF FEM
The Fractal Enterprise Model (FEM) includes three
types of elements: business processes, assets, and
relationships between them, see Fig. 1 in which a
fragment of a model is presented. The fragment is
related to a business case considered in the next
sections. Graphically, a process is represented by an
oval; an asset is represented by a rectangle (box),
while a relationship between a process and an asset is
represented by an arrow. FEM differentiates two
types of relationships. One type represents a
relationship of a process “using” an asset; in this case,
the arrow points from the asset to the process and has
a solid line. The other type represents a relationship
of a process changing the asset; in this case, the arrow
points from the process to the asset and has a dashed
line. These two types of relationships allow tying up
processes and assets in a directed graph.
In FEM, a label inside an oval names the given
process, and a label inside a rectangle names the
given asset. Arrows are also labelled to show the
types of relationships between the processes and
assets. A label on an arrow pointing from an asset to
a process identifies the role the given asset plays in
the process, for example, Workforce, Infrastructure,
etc. A label on an arrow pointing from a process to an
asset identifies the way in which the process affects
(i.e. changes) the asset. In FEM, an asset is considered
as a pool of entities capable of playing a given role(s)
in a given process(es). Labels leading into assets from
supporting processes reflect the way the pool is
affected, for example, a label acquire identifies that
the process can/should increase the size of the pool.
Note that the same asset can be used in two
different processes playing the same or different roles
in them, which is reflected by labels on the
corresponding arrows. It is also possible that the same
asset can be used for more than one role in the same
process; in this case, there can be more than one arrow
between the asset and the process, however, with
different labels. Similarly, the same process could
affect different assets, each in the same or in different
ways, which is represented by the corresponding
labels on the arrows. Moreover, it is possible that the
same process affects the same asset in different ways,
ICEIS 2019 - 21st International Conference on Enterprise Information Systems
526
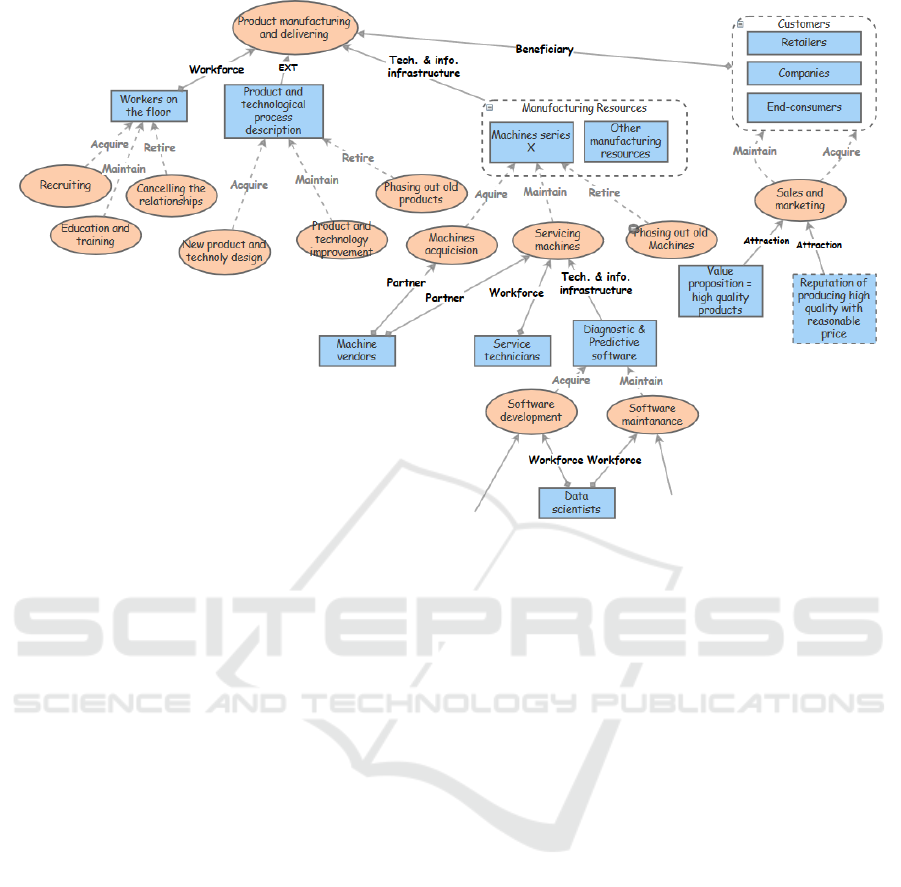
Figure 1: A fragment of FEM.
which is represented by having two or more arrows
from the process to the asset, each with its own label.
In FEM, different styles can be used for shapes to
group together different kinds of processes, assets,
and/or relationships between them. Such styles can
include using dashed or double lines, or lines of
different thickness, or coloured lines and/or shapes.
For example, a diamond start of an arrow from an
asset to a process means that the asset is a stakeholder
of the process (see the arrows Workforce in Fig. 1).
Labels inside ovals, which represent processes,
and rectangles, which represent assets, are not
standardized. They can be set according to the
terminology accepted in the given domain, or be
specific for a given organization. Labels on arrows,
which represent the relationships between processes
and assets, however, can be standardized. This is done
by using a relatively abstract set of relationships, like,
workforce, acquire, etc., which are clarified by the
domain- and context-specific labels inside ovals and
rectangles. Standardization improves the
understandability of the models.
While there are a number of types of relationships
that show how an asset is used in a process (see
example in Fig. 1), there are only three types of
relationships that show how an asset is managed by a
process – Acquire, Maintain and Retire.
To make the work of building a fractal model
more systematic, FEM uses archetypes (or patterns)
for fragments from which a particular model can be
built. An archetype is a template defined as a
fragment of a model where labels inside ovals
(processes) and rectangles (assets) are omitted, but
arrows are labelled. Instantiating an archetype means
putting the fragment inside the model and labelling
ovals and rectangles; it is also possible to add
elements absent in the archetype, or omit some
elements that are present in the archetype.
FEM has two types of archetypes, process-assets
archetypes and an asset-processes archetype. A
process-assets archetype represents which kind of
assets that can be used in a given category of
processes. The asset-processes archetype shows
which kinds of processes are aimed at changing the
given category of assets.
3 BUSINESS CASE
3.1 Overview of the Current State
The case considered in this paper concerns a company
that manufactures different lines of products. These
products can be bought by companies, retailers or
end-consumers for their usage. The company uses
different machines for producing the products. In this
paper, we focus on a particular machine that will be
referred to as Machine X.
Using Enterprise Modeling in Development of New Business Models
527

Fig. 1 presents a fragment of a fractal enterprise
model of the current business activity. In the root of
this model is a primary process of manufacturing and
delivering products. Underneath of it, there are
various assets that are needed for the process working
smart-free. Under smart-free, we mean that instances
of this process (production batches) are started with
normal frequency. As shown in FEM in Fig.1, the
process requires variety of assets such as workers on
the flour (Workforce), manufacturing equipment
(Technical and informational infrastructure) and
customers (Beneficiary). Note that the FEM fragment
in Fig.1 does not show all assets that are needed to
run the primary process, for example, a stock of
orders for producing product batches is not presented.
The choice of what to present in Fig. 1 has been made
based on the most important assets and assets that are
of interest for BMI to be considered in the paper.
After the assets of the first level (underneath the
primary process) are put in the model, the unfolding
of FEM continues by applying the asset-processes
archetype, which requires finding processes that
manage the identified assets. These processes are
connected with the asset(s) by three types of
relationships: Acquire, Maintain and Retire.
Dependent on the type of assets, the asset managing
processes have different nature. For a workforce type
of assets, they are hiring, training and retiring. For the
infrastructure type of assets, they are acquisition,
maintenance, and phasing out. For the execution
template (EXT) type of assets, they are
develop/design, maintain and phase out.
After the management processes are identified,
assets that are needed to run them are identified using
process-assets archetypes. For example, the customer
asset needs sales and marketing for both acquiring
new customers and keeping them attached to the
company, so that they continue to add orders to the
stock of orders. The equipment asset, e.g. machines
X, needs a service/maintenance process (see Fig. 1).
The process of unfolding of FEM can continue by
applying the asset-processes archetype for newly
identified assets. Thus, marketing and sales requires
well-defined value proposition and reputation that
backs it (see Fig. 1), as well as other assets (not
identified in the figure), like sales executives.
Machine X maintenance requires service technicians,
machine process experts, machine providers (partners
to provide spare parts, advice, etc.) and diagnostic
tools. As machine diagnostic and prediction is in the
focus of this work, we will look at this topic in more
details in the next sub-section.
3.2 Machine Maintenance
In a manufacturing organization, production
equipment - machines are very important resources
for production. Different Key Performance Indicators
(KPIs) related to manufacturing resources are used to
ensure the optimal usage of the machines, such as
OEE (Overall Equipment Efficiency) defined in ISO
standard (ISO, 2014a; ISO, 2014b). A stoppage in
production line due to machine failure costs a lot of
money for an organization.
In the context of Industry 4.0, maintenance is an
important area that has an enormous potential in
terms of cost saving and resource efficiency. There
are many use cases that come under the category
"maintenance 4.0", like automatic maintenance order
generation, notifications to stakeholders (users, other
machines and mobile devices), predictive
maintenance, flexible manufacturing, and support
services (augmented reality).
Normally, in an organization, maintenance is
counted as an overhead (however, a mandatory one)
on the production. In order to avoid unpredictable
costs, machines are serviced in regular intervals
(sometimes according to manufacturer
specifications). However, despite all regular services,
sometimes unplanned maintenance also has to be
carried out due to failure in machines or loss of
quality in operations carried out by the machines. If a
particular machine or its part is situated in a critical
position in the line, it has a drastic impact on the
whole production, as well as on the quality of
products delivered to the customers; thus a failure in
such an equipment affects the overall KPIs.
In a manufacturing organization, machines are
used as long as they fit for the purpose, no matter how
old they become. Several kinds of maintenance are
carried out to keep the production lines running.
These are briefly described below.
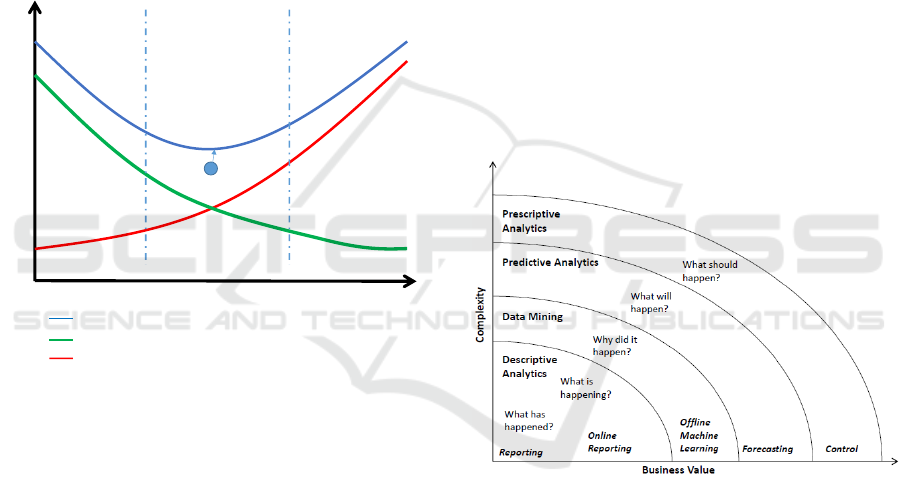
1. Planned Maintenance. The planned maintenance
is carried out according to a specific plan like after
completion of certain number of operating hours
(e.g. 20,000 hours), or after certain cycles (e.g.
2,000,000 cycles). It is carried out regularly to
avoid the unplanned (failure-based) maintenance
in order to save costs. However, this planned
maintenance is carried out sometime earlier than
completion of the operating hours in order to
avoid an extra stoppage in production when the
production line is stopped for a different reason
(like new software updates). However, an earlier
planned maintenance affects negatively the costs
of production for an organization, as shown in Fig.
2.
ICEIS 2019 - 21st International Conference on Enterprise Information Systems
528
2. Condition-based Maintenance. In this kind of
maintenance, certain machine parameters are
actively monitored to get information about the
health of the machine and to carry out the
appropriate actions (reducing speed, load etc.)
before situation gets out of control. This also
applies to creating maintenance orders if
necessary before a planned or unplanned
maintenance (in case of a failure or production
stoppage) occur.
3. Unplanned (problem-based) maintenance. In
unplanned maintenance, as the name suggests, the
maintenance is carried out when a problem
occurs. In this case, normally, a notification is sent
to the service team and a maintenance order is
created in case of failure.
Figure 2: The impact of maintenance on costs; adapted from
(Etia et al., 2006).
These three kinds of maintenance are common for
all manufacturers. In any kind of maintenance above,
in the first place, the internal service team is asked to
complete the required service. If they cannot carried
out the service, then the external resources are used.
The goal of any organization is to avoid unplanned
maintenances and run the production as continuously
as possible.
3.3 Improving Effectiveness of
Maintenance
As was discussed in the previous sub-section,
machine maintenance costs, direct and indirect, are
quite high. To reduce the cost of maintenance itself,
and revenue lost from unexpected breakdowns,
organizations look to applying the latest research
results in several brunches of Computer Science, e.g.
Internet of Things (IoT), data mining, machine
learning and Artificial Intelligence, which might
improve the maintenance process.
The goal of the project considered in this paper,
was to develop a tool able to detect in advance when
the machine is about to fail and take out appropriate
measures, like appropriate production and
maintenance planning. Several sub-goals were
defined to achieve the main goal in a stepwise
manner. The sub-goals included introducing
monitoring the machine status and its parameters, and
in case of deviation from the normal behaviour,
automatically sending notification to the service
technicians. Another sub-goal included analysis of
the historical data and identification of the patterns
that cause machine failure, and then using these
patterns as a basis for predictive maintenance. The
main idea of the project sub-goals is represented in
graphical form in Fig. 3, which is based on material
from (Davenport and Harris, 2007; Eckerson, 2007;
Lustig et al., 2010). The direction, the project takes is
to handle more complexity and get more business
value from the effort.
Figure 3: The goals of the project as a diagram.
3.4 Extending the Scope of Usage
The project described in the previous sub-section was
started in one plant of the organization having a
technical goal in mind, i.e. improving the
maintenance effectiveness at this plant. However,
when under the way, the project spawned the
discussion of extending the scope of the usage of its
results beyond the given plant and even beyond the
whole company. This is understandable considering
the costs of the project and the needs of establishing
a permanent team that would deal with maintaining
and further developing the software produced by the
project. The latter is represented in Fig. 1 by the sub-
tree starting from the asset node Diagnostic &
Frequency of Failures
Maintenance Costs
Total Cost (incl. production)
Prevention Cost (hours, parts)
Repair Cost
Planned
Maintenance
Condition-based
Maintenance
(Predictive)
Problem-based
Maintenance
(Reactive)
Optimal point
Using Enterprise Modeling in Development of New Business Models
529
Predictive software. This asset is used as Technical &
Informational infrastructure for the Servicing
machines process in Fig. 1.
As any other asset, Diagnostic & Predictive
software requires its managing processes, two of
which, Acquire and Maintain, are represented in Fig.
1. Continuing unfolding of the FEM structure for the
Diagnostic & Predictive software node, we will add
assets needed for these management processes, such
as Workforce represented in Fig.1. Furthermore, the
workforce asset, i.e. Data Scientists, needs its own
processes of hiring and training, etc.
As follows from the deliberation above, unfolding
node Diagnostic & Predictive software reveals quite
a complex structure that needs to be in place in order
to use the results of the project described in Section
3.3 in practice. This explains the desire to extend the
goal of the project from just improving the
effectiveness of the maintenance in one plant to
envisioning new BMs (Business Models) that could
generate additional revenues for the company. The
current discussion of extending the scope of usage
ranges from providing maintenance services to other
plants of the firm (remotely) to creating a separate
business of licencing the diagnostic software to
external companies. The latter example would be
exploited in the next section.
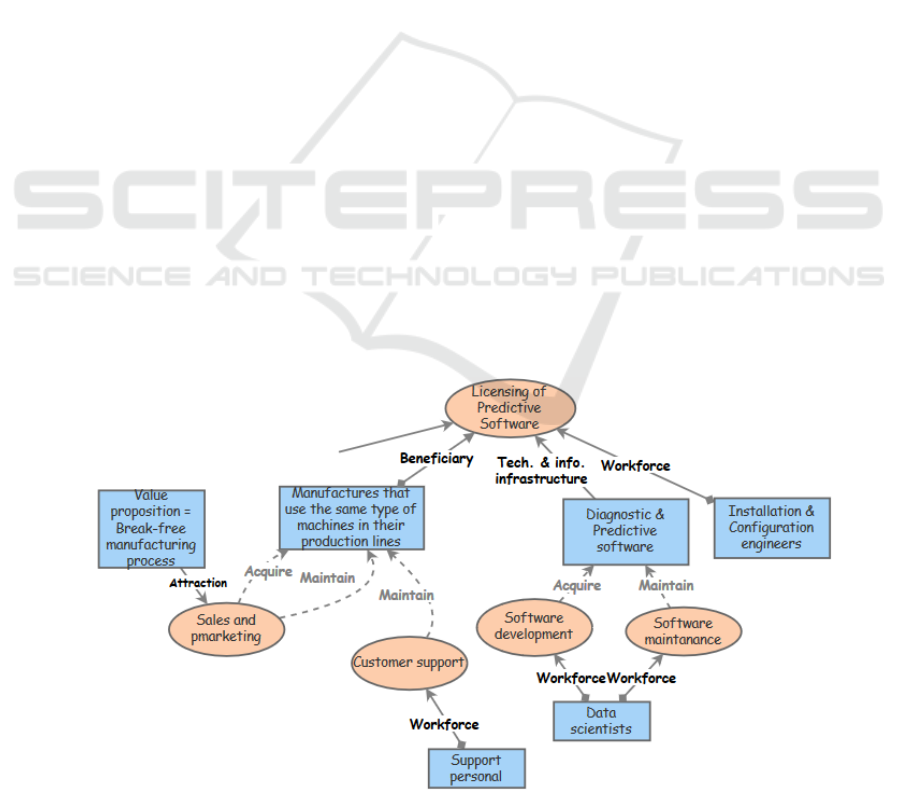
4 ANALYZING A NEW BM
The most radical suggestion for a new business model
based on the project was to open a new business of
licensing diagnostic software to other manufacturers
that uses the same type of machines, including the
firm's competitors. To analyse the feasibility of
introducing this BM, we drafted basic FEM model
related to the new BM as presented in Fig. 4.
The primary process for the new BM becomes
Licensing of Predictive Software. It needs certain
assets to ensure that this process functions smart-free.
The central asset for this process is Diagnostic &
Predictive Software promoted from the old BM; in
Fig. 4, the whole tree related to this asset is moved
from FEM in Fig. 1. This asset serves as Technical &
information infrastructure for the main process.
Besides this asset, other assets are needed, in
particular Workforce (Installation & Configuration
Engineers) and Beneficiary (customers).
While comparing the beneficiary/customer assets
in Fig. 1 and Fig. 4, it becomes clear that these two
assets are completely different. In Fig. 1, the asset
customers has nothing to do with manufacturing, in
difference to Fig. 4. This difference becomes clearer
if we compare value propositions for both processes.
The difference means that a completely new set of
managing processes need to be added to manage the
new kind of customers. Two of such processes, Sales
and marketing and Customer support are presented in
Fig. 4. These processes and assets for them need to be
developed separately from Sales and marketing in the
current BM.
To analyse which other existing assets could be
used in the new BM, we put two FEM fragments from
Fig. 1 and Fig. 4 side by side, see Fig. 5, and continue
deliberation. To start with, we can decide that service
technicians can serve as installation and configuration
engineers on one hand and as customer support staff
Figure 4: A FEM fragment for the new BM.
ICEIS 2019 - 21st International Conference on Enterprise Information Systems
530
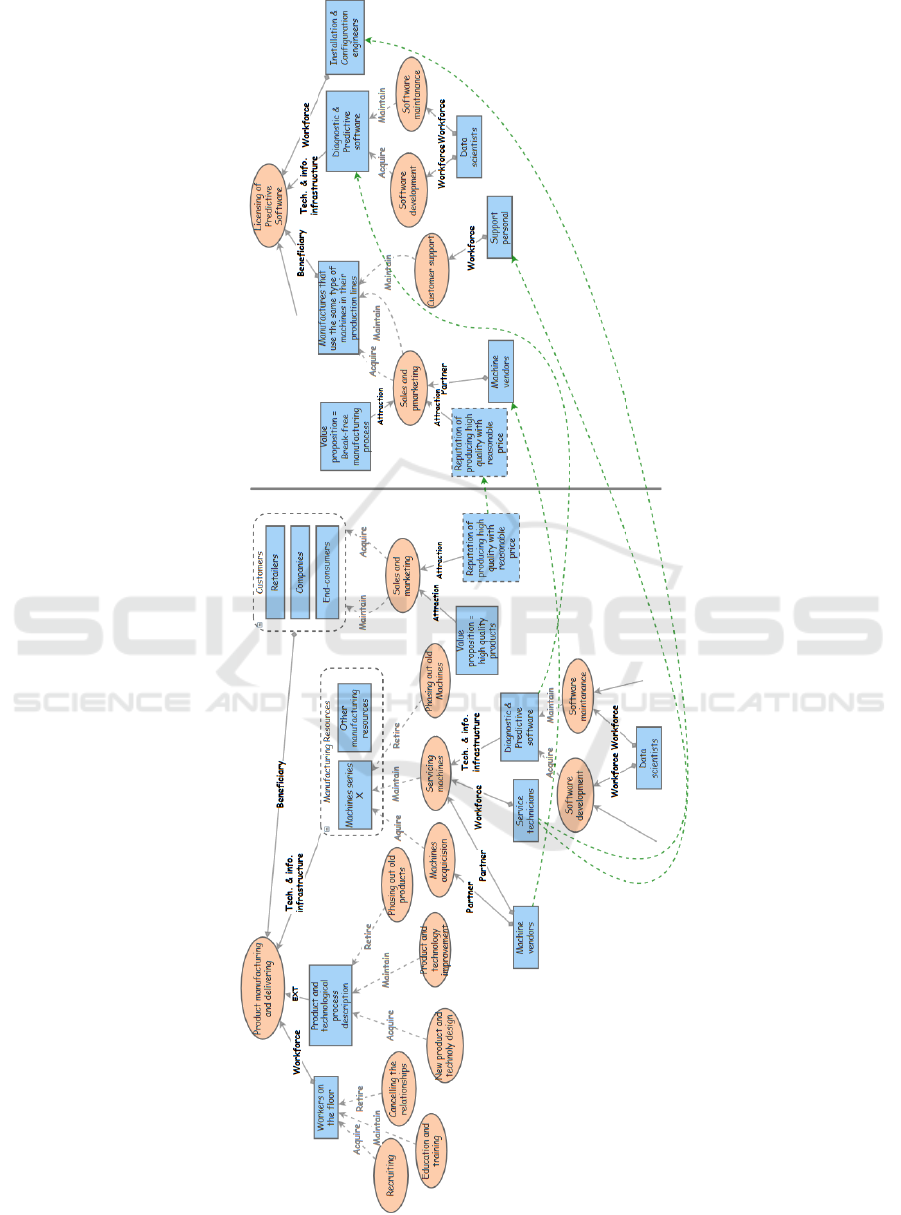
Figure 5: Comparing two FEM fragments.
Using Enterprise Modeling in Development of New Business Models
531

on the other hand, which is shown by green arrow
lines drawn between these assets in Fig 5. The
experience of the service technicians in using the
software would enable them to function in another
capacity as well. However, this may help only in the
beginning, if the new BM starts producing more
customers, more Workforce will need to be hired.
The next step would be to use existing reputation
on high-level quality as an attraction in the new BM.
As many of the new customers will belong to the
company's competitors, this reputation can be
used in advertising by pointing out that the software
to be licensed is used internally in the organization.
This gives us a possibility to move asset Reputation
of producing high quality with reasonable price to the
new fragment of FEM in Fig. 5 and connect it with
the one in the old FEM fragment with a green arrow
line.
In the next step, we can consider using the
machine vendor as a partner for sales and marketing
activities, as the vendor has access to all companies
who use the machine. In Fig. 5, the machine vendor
is moved to the new FEM fragment and connected to
the one in the old FEM fragment with a green arrow
line.
The analysis above shows that some existing
assets could be used in a new BM, however,
introducing it still requires considerable efforts, e.g.
in creating different kind of sales and marketing, and
support, as well as increasing the size of some
existing assets. The latter will mean increasing the
capacity of the processes that manage these assets,
e.g. hiring and training new members of staff.
5 CONCLUSION
As follows from Section 1, the stated goal of this
paper was to investigate whether an enterprise model
could help in analysing new BM hypothesis. The
fractal enterprise model (Bider et al., 2017) was
chosen for testing; the test itself followed the
guidelines from (Bider and Perjons, 2017). The main
difference from discussion in (Bider and Perjons,
2017) and this work is that the former considered a
hypothetical scenario, while this work considers a
real business scenario. Another difference is that the
main asset chosen for building a new business
(Diagnostic software) is positioned on a much deeper
level of the FEM structure compared to the example
in (Bider et al., 2017).
The discussion in Section 4 demonstrates that
using FEM helps to detect which assets are needed for
introducing a new BM, and which ones could be
reused from the old BM. As the central asset of a new
BMI is positioned quite deep in the FEM structure,
using a standard BM canvas (Osterwalder and
Pigneur, 2014) would not be possible. Most of the
assets that could be reused in the new BM would be
outside the scope of the BM canvas, thus making it
difficult to use the canvas for deliberation.
Note that our example shows FEM advantages
only for the implementation phase of a new BM. It
does not help much in investigating whether a new
service or product will be accepted in the market
place. Other means need to be employed that can
include Business Model Canvas, SWOT, etc. This is
a limitation of FEM in relation to the BMI tasks.
The next step in this particular project would be to
deepen the analysis completed in Section 4, e.g. by
quantifying the parameters of introducing the new
model, e.g. calculating the size of assets and capacity
of processes to be introduced, at least in the
beginning. Another direction is to present the analysis
to the company management and get feedback. As far
as more general goal is concerned, we are working to
find other examples to test the idea of using enterprise
modelling in BMI.
In this, and previous examples of applying FEM
for practical tasks, we used InsightMaker (Give
Team, 2014) for drawing models. Though this tool is
not designed for FEM, it was sufficient for our cases.
For more broad use, however, a more suitable tool
should be found. Several alternatives are being
explored right now for solving this problem. One is
developing a specialized tool, for example, based on
the ADOxx meta-tool (ADOxx.org, 2017). This
alternative has an advantage in that it will allow
including special means for generating new BM
hypothesis from transformational patterns (Bider and
Perjons, 2018), and for their analysis. Another
alternative would be using some general
diagramming tool, like Archimate.
REFERENCES
ADOxx.org, 2017. ADOxx. [Online] Available at: https://
www.adoxx.org [Accessed March 2019].
Andreini, A. and Bettinelli, C., 2017. Business Model
Innovation. From Systematic Literature Review to
Future Research Directions. Springer.
Bider, I. and Perjons, E., 2017. Using a Fractal Enterprise
Model for Business Model Innovation. In BPMDS 2017
RADAR, CEUR Vol 1859., pp.20-29.
Bider, I., Perjons, E., Elias, M. and Johannesson, P., 2017.
A fractal enterprise model and its application for
business development. Software & Systems Modeling,
16(3), pp.663–89.
ICEIS 2019 - 21st International Conference on Enterprise Information Systems
532

Davenport, T.H. and Harris, J.G., 2007. Competing on
Analytics: The New Science of Winning. Harvard
Business School Press.
Eckerson, W., 2007. Predictive Analytics. Extending the
Value of Your Data Warehousing Investment. Technical
Report Q1. TDWI Best Practices.
Etia, M.C., Ogajib, S.O.T. and Probertb, S.D., 2006.
Reducing the cost of preventive maintenance (PM)
through adopting a proactive reliability-focused
culture. Applied Energy, 83(11), pp.1235-48.
Giesen, E., Berman, S.J., Bell, R. and Blitz, A., 2007. Three
ways to successfully innovate your business model.
Strategy & Leadership, Vol. 35 Issue: 6, pp., 35(6),
pp.27-33.
Give Team, 2014. Insightmaker. [Online] Available at:
http://insightmaker.com/ [Accessed 12 February 2019].
ISO, 2014a. ISO 22400-1:2014. Automation systems and
integration -- Key performance indicators (KPIs) for
manufacturing operations management -- Part 1:
Overview, concepts and terminology. Standard. ISO.
ISO, 2014b. ISO 22400-2:2014. Automation systems and
integration -- Key performance indicators (KPIs) for
manufacturing operations management -- Part 2:
Definitions and descriptions. Standard. ISO.
Lustig, I., Dietrich, B., Johnson, C. and Dziekan, C., 2010.
The Analytics Journey: An IBM View of the Structured
Data Analysis Landscape: Descriptive, Predictive and
Prescriptive Analytics. INFORMS Analytics Magazine,
(November-December), pp.11-18.
Mangematin, V., Ravarini, A.M. and Sharkey Scott, P.,
2017. Special Issue: Business Model Innovation.
Journal of Business Strategy, 38(2).
Osterwalder, A. and Pigneur, Y., 2014. Business Model
Generation: A Handbook for Visionaries, Game
Changers, and Challengers. Hoboken, NJ,US: Wiley.
Robertson, D. and Hjuler, P., 2009. Innovating a
Turnaround at LEGO. Harvard Business Review,
(September).
Rolls Royce, 2017. Power by Hour. [Online] Available at:
https://www.rolls-royce.com/media/our-stories/
discover/2017/totalcare.aspx [Accessed March 2019].
Su, Y. and Huang, S., 2006. Business Model Innovation
with Effective Innovation: An Exploratory Study on
TSMC. In 2006 IEEE International Symposium on
Semiconductor Manufacturing. Tokyo, pp. 483-486.
Using Enterprise Modeling in Development of New Business Models
533
