
Energy Efficiency: Do You Know Your Prospective User?
Julia Kantorovitch
a
and Janne Laine
b
VTT Technical Research Centre of Finland, Vuorimiehentie 3, Espoo, Finland
Keywords: Energy Efficiency, Smart Home, User Experience, Service Innovation.
Abstract: Smart homes are seen as an enabling technology and integrated part of future energy efficient system.
However, actual level of uptake of Smart home energy solutions is still low. New energy solutions must be
shown to be attractive and valuable before they will be accepted. To this end, the values and expectations of
prospective user must be understood better. Inspired by Design Science research, this paper presents a novel
method, found in synergy of scenario-based research, content analysing methods and user experience
mapping, which helps to assess if the vision for Smart home energy technology is widely coherent between
prospective users and industry.
1 INTRODUCTION
There have been significant technology
advancements in the recent years to enable new
disruptive solutions for the energy system, e.g. global
digital mapping/streetscape, digital analytics,
artificial intelligence and machine learning, etc.
Further to this, smart metering has recently
progressed through regulation, whilst storage, grid
investments and electric vehicles are generally
following economic incentives for profitability. In
parallel, the Internet of Things, cloud technology and
blockchain are fast becoming a common reality.
However, even with these technological
advancements, many industries are conservative and
risk-adverse because these technology advancements
are not adopted quick enough, preventing
advancement and acceleration. New solutions must
be shown to be attractive and valuable before radical
system changes and quantum-improvements will be
accepted.
Smart homes are seen as an enabling technology
and integrated part of future energy efficient system,
helping to optimise an overall demand response
towards flexibility in distributed generation, storage
and consumption of energy resources. Smart home
technologies are increasingly on sale across the
Europe, examples in Finland include smart home
platforms, solar panels with various installation
a
https://orcid.org/0000-1111-2222-3333
b
https://orcid.org/1111-2222-3333-4444
options included, intelligent automatic solutions to
control heating and water systems as well as
appliances and lighting, however, actual level of
uptake of smart home solutions is still low. According
to various market researches, the most significant
barriers to adoption include a lack of awareness about
available technology and its benefits, and also trust-
and the interoperability concern (Harms, 2015).
However, advertising and communicating benefits
alone may be insufficient to attract prospective users
of smart home energy technologies. Market players
such as energy providers, home platforms- and
individual solutions providers and consumers need to
collaborate to create awareness and in particular
common understanding about expectations towards
the smart home energy systems, their features and the
benefits of these systems. When solution providers
and retailers are marvelling at the passivity of
prospective users, latter are waiting for products that
match their values and expectations.
The new smart energy economy, thanks to
digitalization and novel technologies, causes utilities
and market participants to engage in a variety of new
relationships. These new relationships, ecosystems
and changing business models will be among the
important outcomes as the smart energy ecosystem
evolves. Such new business environment necessitates
the availability of data models and tools in place to
aid the capture of those opportunities as they arise.
Kantorovitch, J. and Laine, J.
Energy Efficiency: Do You Know Your Prospective User?.
DOI: 10.5220/0007771301990206
In Proceedings of the 8th International Conference on Smart Cities and Green ICT Systems (SMARTGREENS 2019), pages 199-206
ISBN: 978-989-758-373-5
Copyright
c
2019 by SCITEPRESS – Science and Technology Publications, Lda. All rights reserved
199

These tools and data models needs to encompass
various viewpoints and in particular the quality and
consistency of the user experience and consumer
motives, which need to be understood well.
Inspired by Design Science research, the novel
method, found in synergy of scenario-based research,
content analysing methods and user experience
mapping, is proposed to understand better the
consistency between prospective users’ perceptions,
values and motives and respective industry view on
the smart home energy technology represented by
their marketing material. The findings presented by
this research aim at emphasising the importance of
user experience research to be taken not only into the
design of respective technology but also into its
appropriate service proposition and support.
2 PROPOSED APPROACH
This research utilises the Design Science research
paradigm in which questions relevant to a particular
problem in an application domain are answered via
experimenting and the creation of innovative
artefacts, thereby contributing with new knowledge to
the body of scientific evidence (Hevner et al., 2004;
Hevner, 2007; Peffers et al., 2007). Sometimes design
science research is also about potentiality i.e. the
identification of new opportunities to improve
practice before any problem is recognized (Iivari,
2007). Artefacts may be models, methods, constructs
and instantiations. In our case, the business domain is
a Smart home and energy-efficient systems and the
created artefact is a proposed research approach,
which is grounded on several scientifically
recognised methods namely content analysis,
scenario-based research and experience mapping,
which are described in the following.
2.1 Web Content Analysis
The web content provides a comprehensive picture
of how respective industry is representing the
benefits, functions and use of products and services
they offer.
Content analysis is a widely used method for
studying documents and other communication media
such as text in various formats, picture, audio and
video. The qualitative and quantitative statistical
methods can be used to analyse the meaning of the
content by systematically labelling of the content with
specific descriptors or “keyword concepts”
(Krippendorff, 2004). Content analysis is used in
many fields ranging from market and media studies
to social and political science and sentiment analysis.
The examples of applications in the energy domain
include content analyses of online marketing by green
electricity- and smart home technology providers
(Herbes and Ramme, 2014, Wilson et al., 2017).
Accordingly, marketing material and products
descriptions from companies active in smart home
and energy market in Finland were qualitatively
studied with a support of the content analysis process
presented in (Bengtsson, 2016). Materials have
included companies’ web pages describing their
products by text and pictures and videos accompanied
by spoken or by written text. The 15 companies with
profiles of energy providers, solution providers and
retailers have been sampled. Their marketing
material was targeted mostly at the prospective users
i.e. householders. Sampled materials describe the
main benefit of Smart home energy solutions as
helping householders to monitor and control their
energy use. Products are also commonly marketed as
a means of improving household comfort (e.g.,
keeping individually adjustable environment
conditions), or as a means of enhancing self-
sufficiency (e.g., using own solar generated
electricity in case of electricity failure). This provides
benefits to users through money savings,
convenience, efficiency as well as general enjoyment
by doing things in “your own way”. The solutions are
also described as an easy to install and to use, “make
sense choice”, though the availability of professional
help in installation of products is emphasised.
As a results of content analysis a major set of
concepts associated with a question of research
(perceptions, values and motives), which describes
the view of industry on Smart home energy products
has been established as represented below:
Increasing comfort Easy to use, easy to
install, effortless
Money saving
Trustable, Safe
Useful, sensible,
making sense
Exciting, Inspiring,
Do It Yourself
Increasing self-
sufficiency
2.2 Scenarios
In a next step, in order to obtain a respective view,
experiences and expectations of prospective users, the
scenarios in form of storylines were defined. The
storylines describing the functions of products were
based on the existing products’ description and
marketing material used in the content analysis.
SMARTGREENS 2019 - 8th International Conference on Smart Cities and Green ICT Systems
200
The educational, communication and exploratory
functions of scenarios have gained an importance in
recent years. Scenarios are consistent and coherent
descriptions of alternative real or hypothetical
features that reflect different perspectives on past,
present and future development which can serve for
action (Van Notten, 2003). It is recognised that
scenarios can be used also as a scholarly research
methodology to produce interesting research, for
generating new ideas and arguments and broadening
the range of causal relationships that we study
(Ramirez et al., 2015).
Consequently, the created storylines have been
used for the evaluation purpose but also as an aid to
identify new research needs and generate new
knowledge towards stimulating new empirical or
theoretical work, action research and possibly even to
creating an ‘aha’ moment. The scenarios contain the
descriptions of three products currently widely
offered in Finnish market, namely “Smart home
automation”, “Solar panels for rent” and “Solar
system to invest”. Further two more future “products”
in form of life-style descriptions have been defined to
mirror the existing developments led by smart energy
districts research (Monti et al., 2017). A Smart
Energy District is a new model for energy generation
and delivery particularly in a campus- like living style
environment. The future developments of such
aspects as energy prices, various alternative energy
sources availability, self-sufficiency in energy, global
climate agreements and socio- technical trends will
influence people’ personal values and motives for
using certain future technology. Consequently, these
will influence styles and ways of living in such
districts and communities. The created scenarios
containing the descriptions of respective products are
presented in the Appendix.
Next, the developed scenarios were evaluated
with a prospective users. To collect a quantitative
data set, the survey instrument was structured in
three parts. Part one contained questions to measure
prospective users’ perceptions of Smart home
energy products offered in the market and a future
trends outlined earlier. The question regarding each
product under evaluation is asked in a form “What
kind of impression do you get from the product or
service or trend described..?”. In addition, part two
of the survey contained an open-ended question
asking respondents to provide a few words "that first
come to mind when you think about ‘Smart home
energy technologies’?". Part three was designed to
measure the perceived benefits and risks associated
with respective products and trends. The survey was
implemented online leveraging the Questback
software, https://www.questback.com/.
In the final step, the experience mapping software
tool was used for the survey data analysis. The
experience mapping is based on the principal
component analysis of experimental quantitative data
and is discussed in the following.
2.3 Experience Map
The experience mapping, a central theme in this
research approach, is a user-centric in the sense that it
ultimately aims to analyse, describe and take into
product design experiences evoked by different kinds
of systems in terms of perceived attributes and mental
impressions associated with them, arising from
interaction (physical or virtual) with the system. The
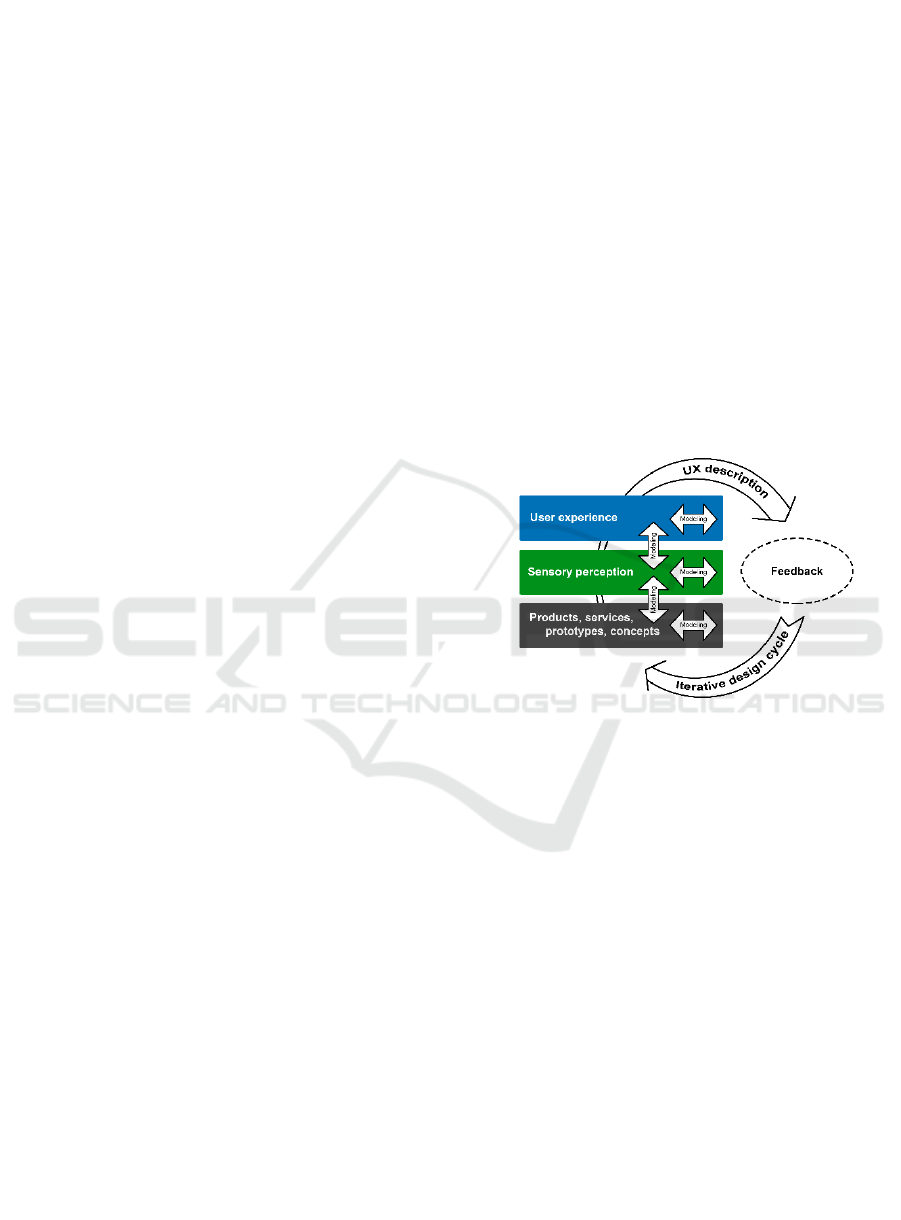
attributes are of different levels, as illustrated in
Figure 1.
Figure 1: The experience mapping approach.
The attributes at the bottom level describe the
physical properties, technical specifications, or
creative design variables of the products and services
being analysed and designed.
The mid-level attributes describe the sensory
perceptions evoked by the products. Visual attributes
are relevant, for example, when analysing the effect
of paper properties on the perceptions and
experiences evoked by printed products such as
magazines. Such attributes are also important in
analysis of effect of material on the perception of
physical product. In this case it is essential to consider
the multisensory nature of perception and include also
haptic attributes such as roughness and slipperiness,
loudness and softness or aggregated touch and feel
attributes (Civille and Dus, 1990; Mensonen et al.,
2010).
At the highest level the attributes describe the
samples in terms of higher-level user experience
dimensions. This research focuses on this type of
perception. At this level products may be described in
Energy Efficiency: Do You Know Your Prospective User?
201
terms of cognitive appraisal dimensions such as
perceived trustworthiness, interestingness, or
usefulness; in terms of emotions and moods evoked
by the interaction with the product, or more simply by
the look and feel of the product; in terms of attributes
related to aesthetic appreciation; or in terms of other
kinds of mental impressions associated with the
product, such as softness, luxury, efficiency,
convenience, or affordability, for example. Attributes
may also be related to such aspects of user experience
as attractiveness, engagement, flow, or transportation
(Steffen, 2007).
The concept of the experience mapping, similar to
preference mapping methods commonly used in
consumer research and sensory science (Carroll,
1972; Meullenet et al., 2008), was initially designed
as a research tool for analysing those aspects of user
experiences of digital and print media products and
services that arise out of visual and multisensory
perception (Laine, 2018). Here the experience
mapping is extended to provide with data-driven
insights to support identifying trends and
understanding consumer groups and their motives for
targeted service innovation in the Smart home and
energy sector.
Once the relevant product-related attributes have
been measured by means such as psychometric
experiments or user questionnaires, the relationships
between the different attributes as well as different
products are analysed by means of multivariate
statistical data analysis and then visualized in a
diagram known as an experience map. More
specifically, principal component analysis is applied
to map the locations of the evaluated samples
(products, services, concepts, or scenarios) from the
high-dimensional space where each attribute
corresponds to a single dimension to a lower-
dimensional principal component space. Principal
components are linear combinations of the attributes,
such that the first principal component explains as
much of the variance between the multivariate
observations of the samples as possible, the second
principal component then explains the maximum
possible amount of the remaining variance in the data,
and so on.
The questionnaires applying Osgood’s (1952)
semantic differential scale are often been applied in
collecting such attribute assessment data. The
semantic differential rating scale is typically
presented as a line whose end points are anchored by
attributes that can be considered to be opposites of
one another, e.g. warm and cold, simple and complex,
and interesting and boring. Many usability
questionnaires employ such rating scales (e.g., Chin
et al., 1988; Hassenzahl et al. 2003, Schrepp et al.
2006, Hassenzahl 2010).
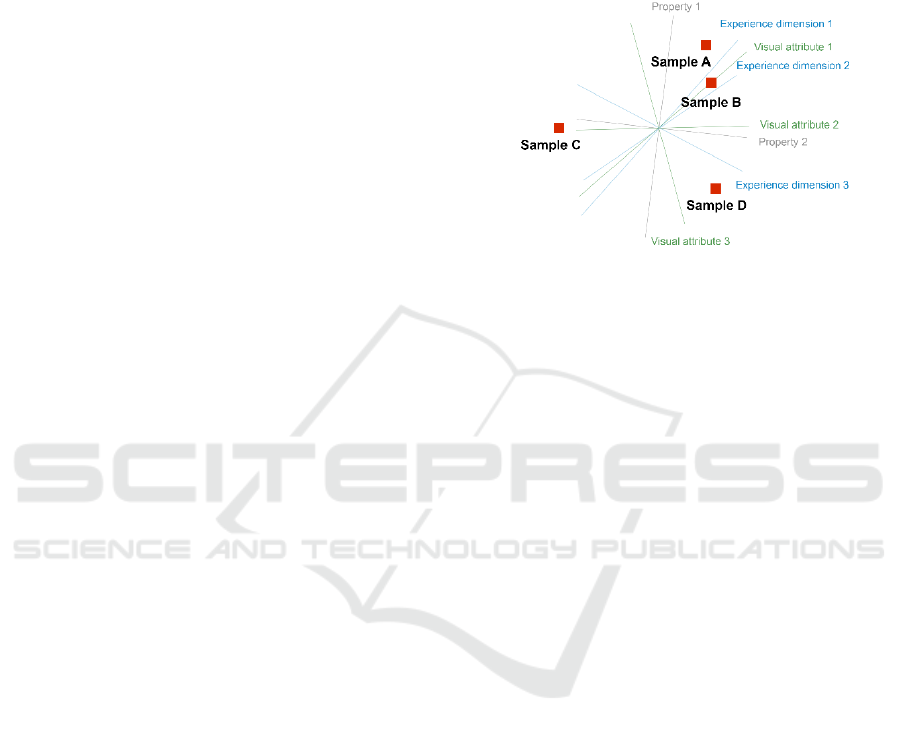
Figure 2 shows a sketch illustrating the basic
concept of the experience map. The horizontal and
vertical directions in the map correspond to the first
and second principal components, respectively.
Figure 2: The experience map diagram.
The product locations are denoted by red squares
(Sample A, B, etc.). The vectors of different lengths
and orientations originating from the origin of the
diagram correspond to different attributes
(cold/warm, interesting/boring). Attributes of
different levels are further distinguished by vectors of
different colors. The basic principle of interpreting
the map is that products located close to one another
evoked experiences that were relatively similar to one
another, while differing more from the experiences
evoked by products located farther apart in the map.
However, the numerical distances between the
samples on the map do not generally correspond to
perceived overall (dis)similarities between the
samples, but are only approximations. Attributes
whose vectors point in the direction of the given
products were generally more strongly associated
with those products than with other products. Further,
attribute vectors pointing in the same direction
indicate higher positive correlations between the
corresponding attributes, while attributes whose
vectors point in opposite directions were negatively
correlated in the data. Roughly perpendicular vectors
indicate low correlations between attributes or
uncorrelated attributes.
3 VALIDATION
Alignment between prospective users’ perceptions
and industry marketing is an important indication of
shared and consistent expectations for the Smart
home energy market (Wilson et al., 2017).
SMARTGREENS 2019 - 8th International Conference on Smart Cities and Green ICT Systems
202
As discussed earlier, the content analysis has
provided a systematic picture in form of extracted
concepts describing how industry is seeing and
representing the benefits and functionality of Smart
home energy products.
In order to obtain the correspondent view from
prospective users, the methodology described in
section 2.3 was followed. First, a set of experience
dimensions were formed. The dimensions were
based on the set of concepts resulted from the
content analysis described in section 2.1 (increasing
comfort, easy to use, safe/trustworthy, etc.). Next,
the respective attributes in form of opposites in a
scale of 1 to 7 were formed, such as, for example,
increases comfort (1) – doesn’t increase comfort (7),
easy to use (1) – difficult to use (7), etc. In addition
four more concepts were added, one to clarify a
general awareness of respondents about products
offered in the market and three others are to measure
respondents’ perceived interest in particular product
or trend in general and an associated impression
invoked by product such as if it is perceived trendy
or old-fashioned, luxurious or ordinary. These
additional attributes are not directly matched to the
concepts representing industry’ marketing material.
They are, however, interesting for the future
research, in particular in relation to the analysis of
life styles and sociological aspects of technology
use.
The quantitative assessment data were collected
using online questionnaires as described in section
2.2. The sample comprised n=42 respondents with
different professional background in the domains of
engineering, sociology, medicine and economy. The
age of respondents were in the range of 35-50
equally representing males and females. The results
of the analysis of respective concepts using
experience map tool are presented in Figure 3, where
the samples have been mapped from the original
high-dimensional attribute space to the plane of first
two principal components, as explained in section 2.
Here, the horizontal and vertical axes, not labelled
in the diagram to avoid clutter, correspond to the 1
st
and 2
nd
principal components, respectively. The
attribute vectors were similarly mapped to this
principal component space based on their principal
component coefficients, i.e., their contribution the
1
st
and 2
nd
principal components of the data set.
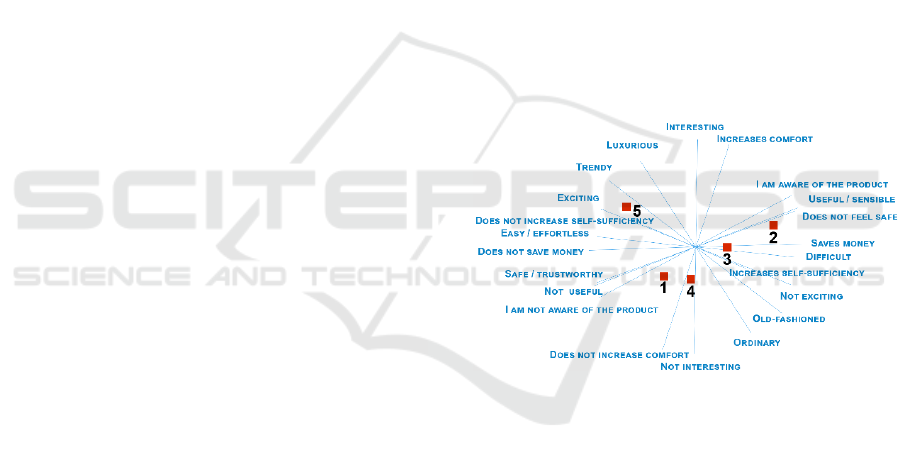
As an immediate observation, it can be seen that
products 2 and 3 evoked impressions that were
similar to one another, and in some ways opposite to
the impressions evoked by product 1. Both solar
panels-based products (2 and 3) were perceived as
more useful and making sense as well as saving
money than for example Smart home automation
system (1). Accordingly, users’ impressions or
experiences for the solar based products are better
aligned in these measures with industrial marketing.
It is interesting also to find, that in spite of that solar
technology is relatively new thing in Finland,
respondents are better aware of these types of
products compared to Smart home automation. On
the other hand, Smart home automation system is
perceived easier to use and more trustable compared
to other products. Moreover, the respondents see all
three products more difficult, old-fashioned and
ordinary than interesting, exciting and trendy, in
particular when compared to product/trend 5.
Furthermore, speaking about trends, “Age of
high-tech” community life-style (4) appeared to
invoke impressions that were rather similar to the
products existing in the market. On the other hand,
Do It Yourself & Smart scarcity way of living (5),
which emphasises immaterial values, practical
mind-set, do it yourself attitude and high
environmental standards found more interest in
respondents.
Figure 3: The experience of prospective users (1 – Smart
home automation; 2 – Solar panels for rent; 3 – Solar system
to invest; Styles: 4 – Age of high-tech; 5 – Do It Yourself
& Smart scarcity).
The comparative analysis resulted from
experience map has been complemented with
analysis of how prospective users perceive benefits
and risks of Smart home energy products.
As can be seen from Figure 4, respondents
perceive potential benefits of Smart home energy
technology to be rather general energy saving and
ecological reason than other benefits emphasised by
industry such as monitoring of energy use,
increasing comfort, money saving and property
value increase.
Energy Efficiency: Do You Know Your Prospective User?
203
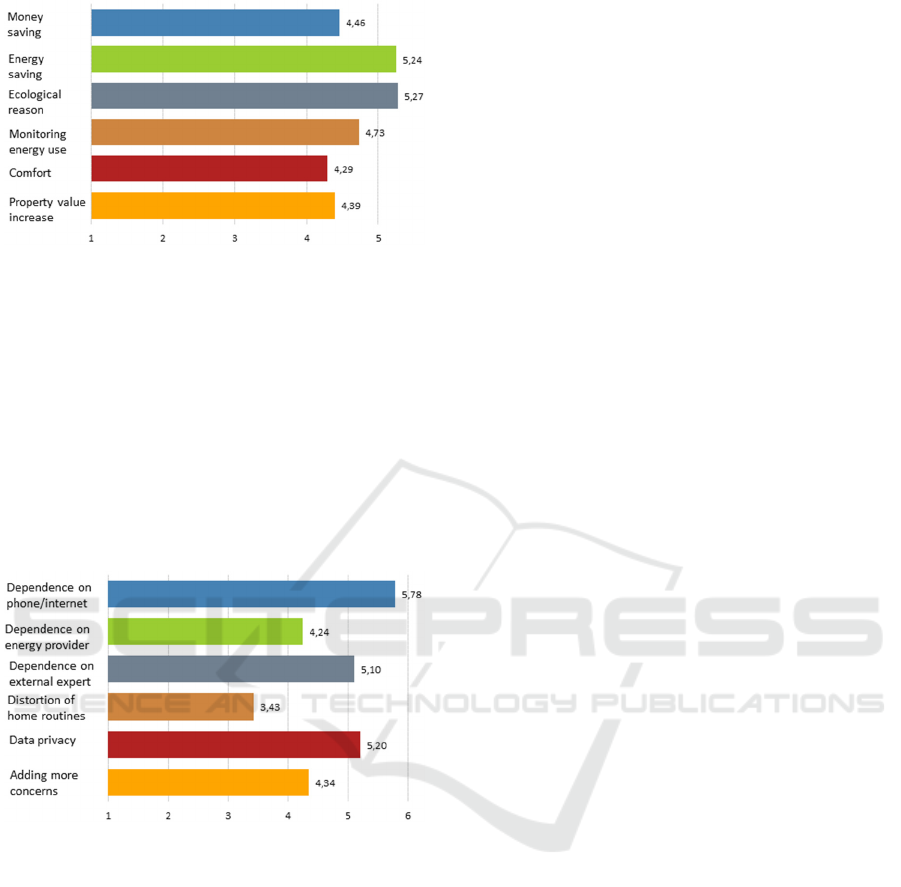
Figure 4: The experienced benefits of Smart home energy
system.
Further, a majority of industrial marketing
material puts emphasis on easiness of installation,
availability of professional support and use of mobile
internet applications. However, the results of
quantitative analysis (see Figure 5) indicate that
prospective users more strongly perceive potential
risks in exactly those areas, - in the increasing
dependency on mobile phone and internet as well as
on a help of external experts including energy
providers.
Figure 5: The experienced risks of Smart home energy
system.
The initial analysis of feedback given by
respondents upon an open-ended question asking to
provide a few words about what first come to mind
when you think about ‘Smart home energy
technologies’ revealed, that ‘Smart home’ and ‘Home
Energy products and services’ are seen as rather
separate concepts invoking different rather
disconnected impressions. This is something that
needs to be followed further by product developers,
retailers and energy policy makers.
4 CONCLUSIONS
To achieve the necessary energy transition in smart
homes and cities, it is essential to increase energy
systems interoperability and to push energy
performance levels significantly beyond the levels of
current building norms. However, these
transformations cannot be made without the
prospective user at the centre of the approach. In
many instances, solutions are developed with a focus
on the environmental and economic impact, however
the social impact to/of the user is very often
overlooked or not given the level of importance it
requires. In order to identify the best solution, it is
first necessary to understand consumer decisions and
motives. It is thereby important to recognise that a
decision to integrate new technologies is not a
separate decision but connected to other decisions in
the home and influenced by many factors. For the
overall majority of the homeowners, energy
efficiency or even cost reduction is not a main reason
to integrate smart technologies, but other values can
be the key objectives.
This research presented an approach which help
to understand better if the vision for Smart home in
energy domain is widely coherent between
prospective users and industry. Shared visions and
expectation for risks and benefits of Smart home
energy solutions are important for reducing
uncertainties with development and penetration of
technological innovations. To validate a proposed
approach, the quantitative analysis of a survey data on
prospective users’ perceived experiences of Smart
home energy products and services and a web content
analysis of respective marketing material offered by
smart home and energy solution providers were
performed. There are however limitations to the
interpretation insights introduced by this validation
due to the limited number of respondents
participating in the initial validation survey (n= 42).
Consequently, in the future we plan to evaluate the
approach with larger group of participants.
ACKNOWLEDGEMENTS
This research work has been supported by the
Government grants and the Finnish Academy of
Science.
SMARTGREENS 2019 - 8th International Conference on Smart Cities and Green ICT Systems
204

REFERENCES
Bengtsson, M., 2016. How to plan and perform a qualitative
study using content analysis, NursingPlus Open, 2, 8-
14.
Carroll, J. D., 1972. Individual differences and
multidimensional scaling. In: R. N. Shepard, A. K.
Romney, and S. BV. Nerlove (Eds.), Multidimensional
scaling: theory and applications in behavioural
sciences, 1, 105-155. New York, NY: Seminar Press.
Civille, G. V. and Dus, C. A., 1990. Development of
terminology to describe the hand-feel properties of
paper and fabrics, Journal of Sensory Studies, 5(1), 19-
32.
Harms, E., 2015. Smart home – good things come to those
who wait. In: Proceedings of the 8th International
Conference on Energy Efficiency in Domestic
Appliances and Lighting (EEDAL’15). Luzern,
Switzerland.
Hassenzahl, M., 2003. The thing and I: understanding the
relationship between user and product. In Funology (pp.
31-42). Springer Netherlands.
Hassenzahl, M., 2010. Experience Design: Technology for
All the Right Reasons, Morgan & Claypool.
Hevner, A.R., March, S.T., and Park, J., 2004. Design
research in information systems research, MIS
Quarterly, 28(1), 75–105.
Hevner, A.R., 2007. A Three Cycle View of Design Science
Research, Scandinavian journal of information systems,
19(2), 1-7.
Herbes, C. and Ramme, I., 2014. Online marketing of green
electricity in Germany—a content analysis of providers'
websites, Energy Policy, 66, 257–266.
Iivari, J., 2007. A Paradigmatic Analysis of Information
Systems as a Design Science. Scandinavian Journal of
Information Systems, 19(2), 1-6.
Krippendorff, K., 2004. Content Analysis: An Introduction
to Its Methodology. California: Sage.
Laine, J., 2018. From Visual Perception to User
Experience, Doctoral dissertation, Helsinki, Aalto
University Press.
Mensonen, A., Aikala, M., and Laine, J. S., 2010.
Multisensory evaluation of paper products. In:
Advances in Printing and Media Technology. Vol.
XXXVII: Proceedings of the 37th International
Research Conference of iarigai.
Meullenet, J. F., Xiong, R., and Findlay, C., 2008.
Multivariate and probabilistic analyses of sensory
science problems. Vol. 25. Jon Wiley & Sons.
Monti et al. 2017. Energy Positive Neighbourhoods and
Smart Energy Districts. 978-0-12-809951-3.
Osgood, C. E., 1952. The nature and measurement of
meaning. Psychological bulletin, 49(3), 197.
Peffers, K., Tuunanen, T., Rothenberger, M., and
Chatterjee, S., 2007. A Design Science Research
Methodology for Information Systems Research.
Journal of Management Information Systems, 24(3),
45-77.
Ramirez et al., 2015. Scenarios as a scholarly methodology
to produce “interesting research, Futures, 71, pp. 70-87.
Schrepp, M., Held, T., and Laugwitz, B., 2006. The
influence of hedonic quality on the attractiveness of
user interfaces of business management software.
Interacting with Computers, 18(5), p. 1055–1069.
Steffen, D., 2007. Design semantics of innovation, product
language as a reflection on technical innovation and
socio-cultural change. World Congress in Semiotics
Communication: Understanding, Misunderstanding
(pp. 369-378). Helsinki. Kahapaino.
van Notten et al., 2003. An Updated Scenario Topology.
Futures, 35, 423–443
Wilson, C., Hargreaves, T., and Hauxwell-Baldwin, R.
2017. Benefits and risks of smart home technologies.
Energy Policy, 103, 72-83.
APPENDIX
The original scenarios evaluated with respondents
were defined in Finnish language (along with a
concepts and experience dimensions presented during
validation). The scenarios below is a translated
version created for a sake of clarity of discussions
presented in this publication.
Product 1 – Smart home automation
Nowadays, Smart home technology, as well as
measurable and controllable equipment can be
installed in old and new apartment buildings. You can
manage your home's functions with your computer or
smartphone from anywhere, for example, to check if
a home device is left un-switched when needed. In
addition, the lights and home appliances can be
switched off and on or the electric car can be pre-
charged remotely. The service follows the evolution
of the market price of electricity every hour, so in
addition to monitoring, residents can transfer
electricity use to less expensive hours. For example,
if it is possible to wash the laundry in the middle of
the day. After logging in to the online service of the
Smart home application, you will see the current
day's data on the consumption of electricity and hot
and cold water. With knowledge, residents have the
opportunity to better understand where to save. The
system is estimated to allow an average of 15% lower
electricity and water consumption per apartment.
Other benefits of the system include the construction
of additional functions and services over time. It
could be useful, for example, in elderly care: if the
coffee machine isn’t turned on at the usual time, the
caregiver can check to see if the resident has
everything right. The remote control service requires
measurement and control equipment for electrical
equipment installed in the house. The cost of the
Energy Efficiency: Do You Know Your Prospective User?
205

solution is between EUR 2 000 and EUR 3 000 per
apartment.
Product 2 - Solar panels for rent
An individual can now produce electricity without
having to build a system of its own. You can rent your
own nameplate from the solar power station. In
practice, renting is done online by clicking on the
solar panel map. The price is about 4-4.5 € / KK. Your
panel produces electricity all year round, including
on sunny winter days. You can keep track of the
production of power plants on the web, even with a
mobile phone or tablet. In addition, you can compare
your solar panel production to your own electricity
consumption. The electricity generated by your solar
panel is credited to the electricity bill according to
the stock price. Production varies by season. The
average payback is about € 1 per month. On average,
the output of a single solar panel is 230 kilowatt-
hours per year, which is enough for running, for
example, 230 washing machines or a 163-day
television marathon.
Product 3 – Solar panel package to invest
In addition, residents have the option of acquiring a
solar panel. Energy companies offer solar panels of
various sizes that make it easy to produce solar
power. Solar packages include a photovoltaic system
and electric storage. When buying a package, the
companies guarantee the right length and width of the
panel for your roof. The package also includes an
electric storage facility that will help the small
producer gain more. For example, it can be used to
store electricity and use it later in the evening when
the sun is no longer shining. Through the electric
storage, you can monitor the use and consumption of
electricity. Electricity storage can save you at the
time of trouble if you hit a power outage. Depending
on the size of the house and the number of panels, the
package price is on average 400 € per month.
Smart Energy Communities – year 2030
There is strong public demand to reduce greenhouse
gas emissions and global warming. It is well noticed
that renewable electricity generation maintains a
steady pace of growth. When new districts are built,
the builder designs energy production of a district
tailored to this specific area and regulations. If the
area is suitable for wind or solar energy, they are
chosen. Wood and biogas if found is also an option in
the area. This results in forming of smart energy
communities around cities and in rural areas.
Communities are well connected to each other and
cooperate in various ways around energy and food
production and consumption.
Product 4 - Age of high-tech
Local solutions using renewable energy sources are
becoming widespread with local ownership and
commercial services for maintenance and operation.
Electricity consumers enthusiastically limit their
energy use and generate their own energy. As the
energy production became locally owned by the
members of the community, a new sense of
connectedness emerged. The culture of energy
efficiency as a status values emerges from energy-
smart technologies. This includes fuel-cell-powered
sports cars, home automation and personal
electronics along with certificates of the energy and
resources used for their production. A whole new
level of technology and product development is
reached with this new willingness to pay. The culture
of consumerism gives way to culture of valuing smart
innovation and new cultures and communities. Novel
technology made mobile electronics and gadgets
energy independent by enabling them to harvest
power from their surroundings. High-tech countries
and companies thrive.
Product 5 – Do It Your Self & Smart Scarcity
Immaterial values have gain more emphasis in
steering technological, economic and social
developments. Communities are densely built with
lots of shared public spaces. Lifestyles are localised.
Travelling long distances is rare. Shared electricity
cars is a way to go. Within communities, smart
scarcity is the driving principle. Everything is
recycled with almost zero-waste. Solar panels,
windmills parks and other means of renewable energy
harvesting provide communities with plenty of
energy. Food is produced and consumed locally and
according to seasons. The world is built bottom-up in
a ‘do it yourself’ manner. Engineering skills and a
practical mind-set are highly valued. ‘Do it yourself’
people are communal nomads who constantly
develop new projects while helping others. Together,
people innovate, get feedback and achieve
increasingly high environmental standards in the
spirit and the philosophy of continuous improvement.
SMARTGREENS 2019 - 8th International Conference on Smart Cities and Green ICT Systems
206
