
A Real Data Analysis in an Internet of Things Environment
Jo
˜
ao Victor Poletti
2 a
, Lucas Mauricio Castro e Martins
1 b
, Samuel Almeida
2 c
,
Maristela Holanda
2 d
and Rafael Tim
´
oteo de Sousa J
´
unior
1 e
1
Department of Electrical Engineering, University of Bras
´
ılia, Brazil
2
Department of Computer Science, University of Bras
´
ılia, Brazil
Keywords:
Internet of Things, Middleware, Data collector, Data Management, Heterogeneity, Challenges, Devices,
Analysis.
Abstract:
The Internet of Things (IoT) emerged as a consequence of the advanced development of increasingly intercon-
nected intelligent devices. These devices integrate within our environment to achieve specific goals that can
relate to the areas of object tracking, health care, security, transport, and recreation. However, the amount of
devices connected to the Internet and their variety is a problem that needs attention. The purpose of this paper
is to present analysis based on real data retrieved from devices inside an IoT universe. The paper proposes a
strategy for data extraction as well as a method for handling the information by filtering it and applying an
analysis in order to identify different types of measuring devices and techniques to validate the measurements
retrieved from the objects. Two techniques from the data mining were used, linear regression and clustering,
and another one was developed. The results give different alternatives for the distribution of data in hypothet-
ical devices that were inferred.
1 INTRODUCTION
Even though there is no universal definition for IoT,
works such as (Whitmore et al., 2015) and (Misra
et al., 2016) describe it as composed of the combi-
nation of networks of several objects that is capable
of identifying, detecting, connecting, data processing,
besides being capable of exchanging data with each
other and with other services on the Internet. This set
of things can be very heterogeneous and have several
purposes. For example, it could be a health care sen-
sor network, monitoring inpatients health and sending
feedback containing patient health data to an applica-
tion in which the patient’s family could follow closely
by smartphone, computer, smartwatch, or tablet. An-
other example could be a smart home system, com-
posed of several devices able to change temperature
and luminosity of the environment, as well as choos-
ing the movie the user wants to watch based on his/her
preferences.
To achieve this, these devices must be arranged
a
https://orcid.org/0000-0001-5402-1139
b
https://orcid.org/0000-0001-6436-7408
c
https://orcid.org/0000-0001-9159-143X
d
https://orcid.org/0000-0002-0883-2579
e
https://orcid.org/0000-0003-1101-3029
harmoniously in the network. There are different
ways to accomplish such connection in IoT, as Radio-
Frequency Identification (RFID) technology, used
widely to track objects, and Wireless Sensors Net-
work (WSN). Furthermore, biometric identification
could also be used to ensure security and customiza-
tion (Cooper and James, 2009). Nonetheless, it is
necessary to use an appliance able to achieve unity
between the device (hardware, physical layer) and the
developer (application layer). This appliance is called
middleware.
The IoT environment contains a large number of
heterogeneous devices that are constantly creating a
massive quantity of data, varied both in type and size.
Basically, middleware helps with the process of in-
tegrating these objects and data, hiding from the de-
veloper’s side the technological details of the physi-
cal devices (Huacarpuma et al., 2016). Thereby, this
piece of software creates abstractions and resources
that allow the developer to create IoT services with-
out needing to write different lines of code for each
type of device or format of data.
The current work aims to perform data analysis on
a real IoT environment focusing on generating knowl-
edge through data previously collected. Naturally,
the IoT atmosphere is capable of generating a high
volume of information. However, as the volume in-
438
Poletti, J., Martins, L., Almeida, S., Holanda, M. and Sousa Júnior, R.
A Real Data Analysis in an Internet of Things Environment.
DOI: 10.5220/0007800304380445
In Proceedings of the 4th International Conference on Internet of Things, Big Data and Secur ity (IoTBDS 2019), pages 438-445
ISBN: 978-989-758-369-8
Copyright
c
2019 by SCITEPRESS – Science and Technology Publications, Lda. All rights reserved

creases, the level of comprehension of the raw data
starts to decrease. With regard to this, this paper is
focused in means to assist the extraction of useful in-
formation through datasets created from devices in a
real IoT environment as well as verifying the qual-
ity and utility of this data and, if possible, estimating
the accuracy of previsions of new data. New solu-
tions to these issues are indeed important to dynam-
ically define by software the resource allocation in
IoT network instances, thus addressing ever evolv-
ing communications, processing and storage require-
ments with software defined networks (SDN) and dat-
acenters (SDDC).
The paper is organized as follows: in Section 2,
we present related works and in Section 3, a descrip-
tion of the main characteristics and features of a mid-
dleware. In Section 4, a few methods to accomplish
an analysis of a large set of data. In Section 5, the
methodology used to perform the extraction and anal-
ysis of data. In Section 6, we present the results with
our considerations. Finally, in Section 7, we present
the central conclusions obtained from this paper and
suggestions for future work are highlighted.
2 RELATED WORK
In this section, we present related works that address
such issues and we discuss the difference between
those works and ours.
In (Alam et al., 2016) is proposed a study of the
applicability of eight well-known data mining algo-
rithms to real IoT data, such as: SVM, KNN, NB,
C4.5, C5.0, LDA, ANN and DLANN. The paper pro-
vides a preliminary examination of whether these al-
gorithms are capable of working with IoT datasets, or
if new families of data mining algorithms are required
to do so.
In (Hromic et al., 2015) a proof-of-concept solu-
tion is provided for the process of transforming raw
data into an usable piece of information by using an
analytic interface to enable real time interpretation
of IoT data. The use case for evaluating the pro-
posed solution is a mobile crowd-sensing application
for air quality monitoring in a smart city environment,
where users provide data streams with wearable sen-
sors. The real data acquired during a system trial is
analyzed and visualized.
The authors in (Luong et al., 2016) present a sur-
vey of the economic models for solving data col-
lection and communication in IoT. The issues are
orgnized in four main sections, i.e., data exchange
and topology formation, resource and power alloca-
tion, sensing coverage, and security. Finally, they ad-
dress some related problems in IoT networks, such as:
faulty sensor detection, pervasive monitoring, service
utility maximization, and deployment evaluation, as
well as the Machine-to-Machine (M2M) resource al-
location.
The aim of (Plageras et al., 2018) is to address
WSN, a subset of IoT, that consists of small sensing
devices, with few resources which are wireless con-
nected to each other. Furthermore, the WSN technol-
ogy can be converged in entire systems to support and
implement efficient solutions for smart cities. The pa-
per tries to investigate new systems for collecting and
managing sensors’ data in a smart building which op-
erates in IoT environment.
Still, on (Mahdavinejad et al., 2018) the main fo-
cus is on targeting the various machine learning meth-
ods that use the concept of smart cities as their leading
case study. Additionally, they provide a taxonomy of
the main algorithms in machine learning and how dif-
ferent techniques are applied to better increase knowl-
edge from raw data provided by the IoT environment.
Our paper differs from these works in that we im-
plement a more generic way of analyzing the mea-
sures from any given device in the lab using linear
regression, clustering and a newly developed method
that will be explained later in this study. Moreover,
we do not restrict our observation to any model, such
as economics or communication, or a specific tech-
nology, like WSN, since we objectively address the
data retrieved from the object.
3 MIDDLEWARE
In IoT, middleware is conceptually understood as
the software layer between the application layer and
physical layer (Fersi, 2015; Huacarpuma et al., 2017),
as shown in Figure 1. The application layer, can pro-
vide service and device automatic discovery, as well
as the services the devices offer. On the other hand,
the physical layer comprises the devices and their
hardware singularities. Hence the purpose of the mid-
dleware is to make the communication between de-
vices and applications possible, as well as to provide
tools and abstractions to facilitate the integration be-
tween such heterogeneous technologies and devices.
The dialogue between these different layers is usu-
ally achieved with messages which can be in JSON or
XML languages. Moreover, the communication be-
tween those layers is made by request-response pat-
tern (Huacarpuma, 2017). When the application layer
receives a request, it is forwarded to the middleware
which analyzes and delivers it to the physical layer
in an understandable pattern. The physical layer then
A Real Data Analysis in an Internet of Things Environment
439
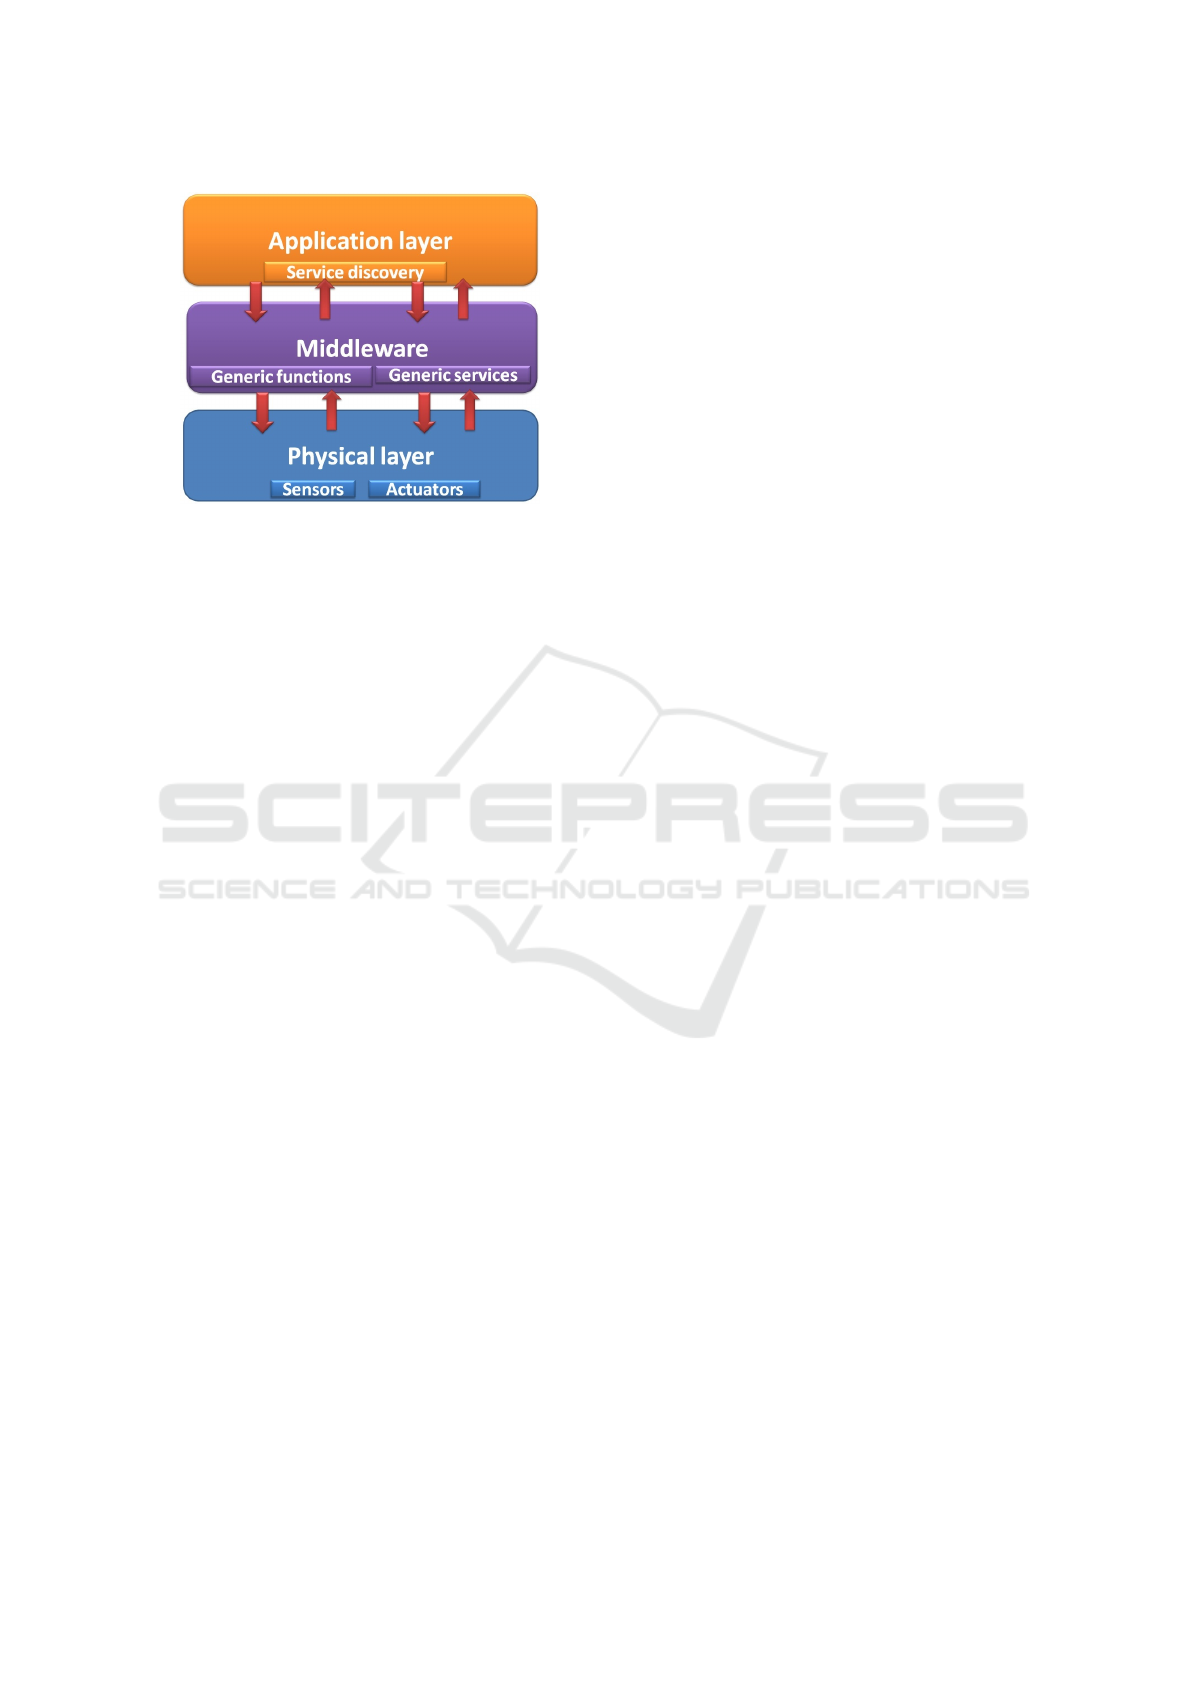
Figure 1: Basic Middleware structure (Fersi, 2015).
processes the request and sends its response message,
which will be forwarded to the middleware and deliv-
ered to the application layer (Huacarpuma, 2017).
When performing these tasks, the middleware
hides the technological details in order to allow the
application developer to solely focus on the task re-
garding the software layer, without having to deal
with the integrity of different objects on a hardware
level. Moreover, the main role and services that are
provided by the middleware may be related to the data
management - how they are collected, stored, filtered
and organized -, to the access control and to the dis-
covery of new services - automated detection of de-
vices and services on the network. In this context, it
is necessary to create middleware that is capable of
involving a large variety of modern objects as well as
new intelligent devices that may be created in the fu-
ture (Chaqfeh and Mohamed, 2012).
Since the IoT environment has an increasing
amount of connected devices - in 2020 there will be
around 50 billion objects connected to the Internet
(Fersi, 2015) - it is fundamental that the middleware
can administrate efficiently the problems of scalabil-
ity as well as being able to handle this increase in the
number of “things” in a way that respects the func-
tionalities of the service on every level. That is, it
must have space to expand without having to compro-
mise on efficiency and also be capable of following
the increase on data flow on a uniform matter.
4 DATA ANALYSIS
IoT environment has a high variety of fields generat-
ing data and the congestion of this flow of informa-
tion occurs quite often. Therefore, the development
of techniques and tools to assist in extracting useful
insights from this constantly growing volume of data
is required.
There are already research fields that focus on
the production of knowledge through data. In other
words, they focus on the mapping of raw data, which
are typically bigger and hard to understand, to more
compact, abstract and familiar formats for the final
user (Fayyad et al., 1996) (like a report or a graphic
illustration). The data mining field largely uses this
process, since it consists of the application of data
analysis and discovery algorithms, which are subject
to acceptable computational efficiency limitations, ca-
pable of producing a particular enumeration of pat-
terns (models) in the data (Fayyad et al., 1996).
From this process it is possible to, in many cases,
estimate the accuracy of predictions on data as well
as its utility. Next, two methods that can be used to
perform a forecast analysis and data description are
presented.
Fundamentally, the regression method consists of
performing a search for linear functions capable of
mapping records of a data set to real values, being
restricted only to continuous attributes (Goldschmidt
and Passos, 2015). Furthermore, it can be applied to
the forecast of future values and probability estima-
tion.
Clustering method seeks to identify a finite set of
cluster categories to describe data. The categories can
be mutually exclusive or possess a richer representa-
tion like the hierarchy and the overlapping of these
groups (Goldschmidt and Passos, 2015). In other
words, it seeks the partitioning of data in different sets
in such a way that the objects belonging to the same
cluster are more similar to each other than to objects
belonging to other clusters (Huang, 1997).
5 METHODOLOGY
In order to prepare this paper, two steps of develop-
ment were created. As shown in Figure 2, the first step
consists of extracting data from Couchbase Server’s
buckets, Client, Data and Service. Couchbase Server
is a NoSQL database, distributed and document ori-
ented. The second step involves the data analysis to
determine the existing devices in the laboratory as
well as to perform measurement previsions over col-
lected data.
To extract data, an algorithm was designed that
connects with the database Couchbase Server and col-
lects from the main buckets all the data that was in-
serted by UIoT middleware defined in (Silva et al.,
2016). Couchbase Python SDK library allowed the
Python application to access a Couchbase cluster -
Couchbase Python SDK version 2.3.5.
IoTBDS 2019 - 4th International Conference on Internet of Things, Big Data and Security
440
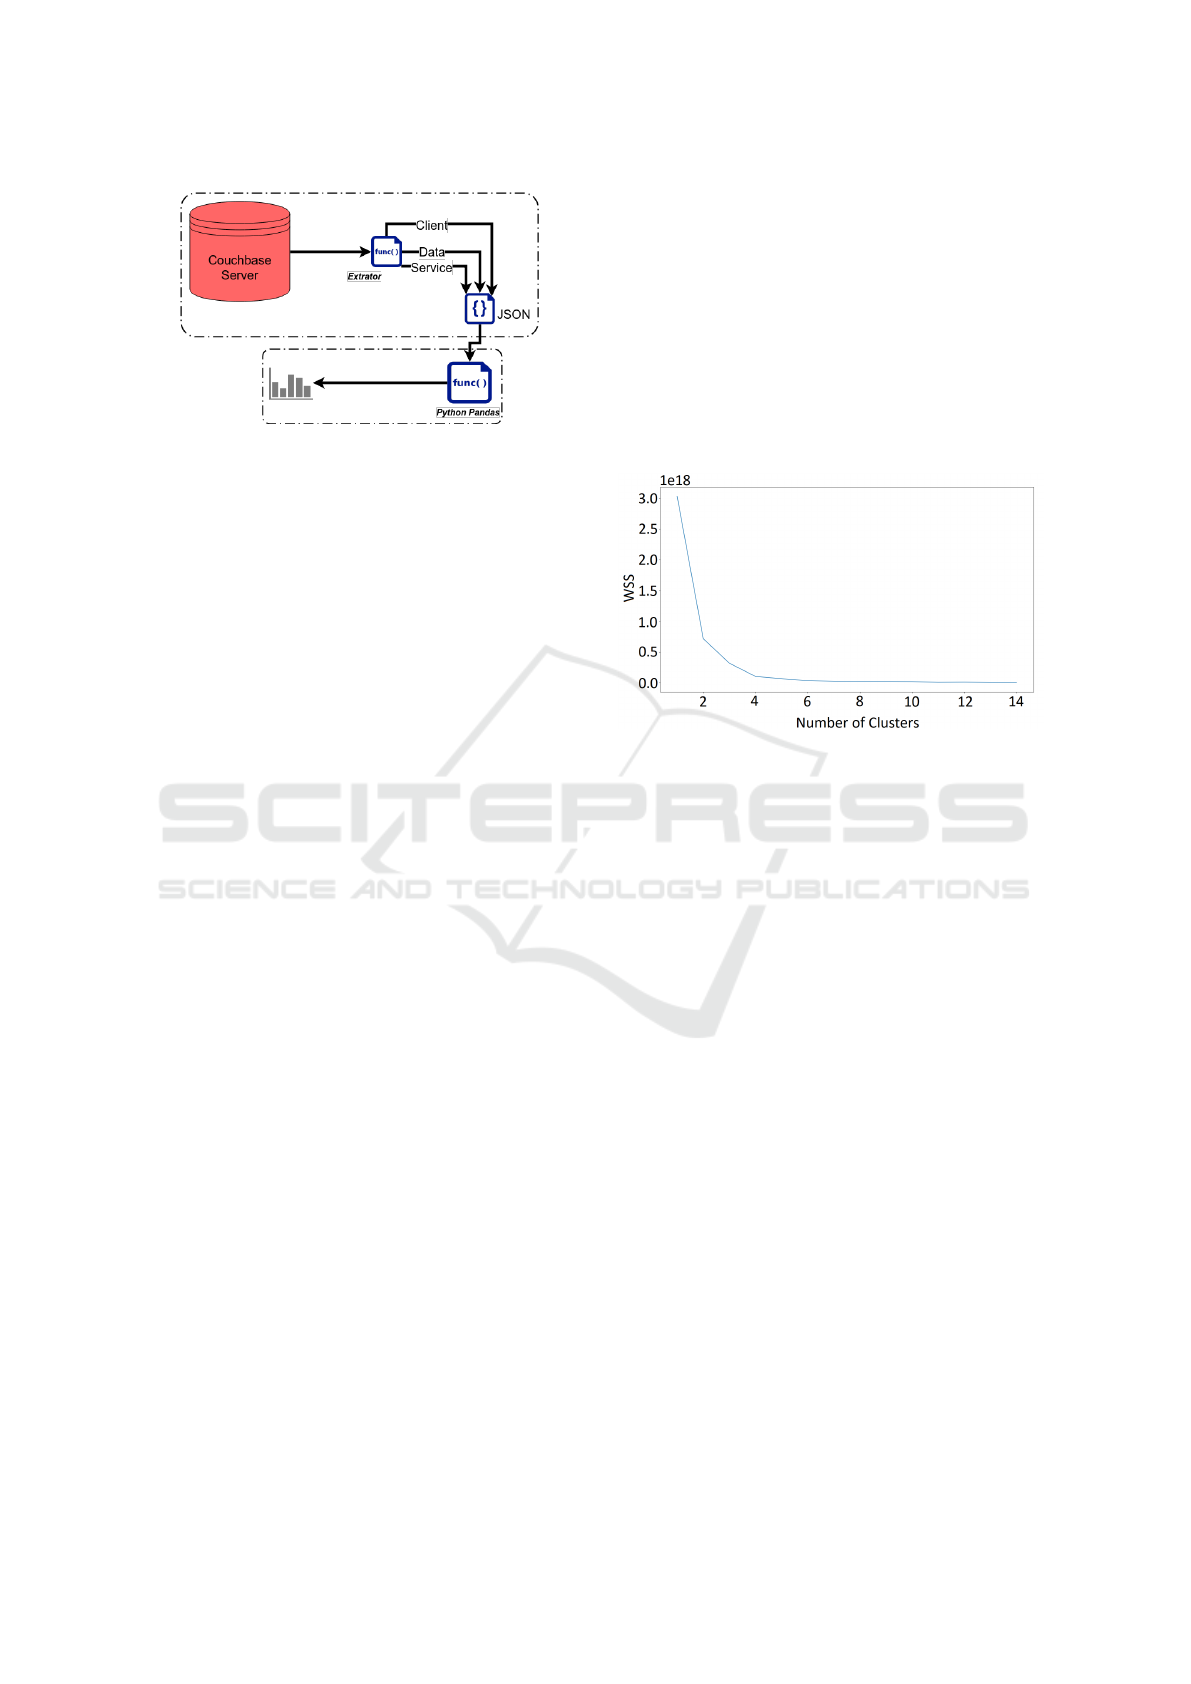
Figure 2: Extraction and analysis methodology.
Information inside the buckets are originated from
multiple devices, called clients (Arduinos and Rasp-
berry Pi), which can provide different services such
as humidity level, pressure, temperature, luminosity,
soil humidity and even carbon dioxide levels. In ad-
dition, the bucket data stores the actual measurements
of each client’s services.
In the laboratory’s current architecture, each time
a device is connected, it goes through a registration
process, without validating whether it was already a
registered device that for some reason became tem-
porarily unavailable. This results in a large number of
undetectable redundancies in bucket client. Further-
more, also inherent to the architecture, no piece of
data keeps a consistent identification of its generating
device.
Thus the identification of different devices from
the complete dataset of values is a challenge to this
study. From specific parameters’ data, it is possible
to use statistic methods in order to determine groups
of devices. To this end, the data have to be submit-
ted to a cleaning process and since it is in JSON for-
mat, some of its tags are removed. The field “param-
eters” contained, in some cases, the MAC address of
the device responsible for the measurement followed
immediately by the tag of what it represents. These
tags were initially parsed, but since the identification
of the device was not representing valid information,
they were not used, keeping only the identification of
similar dimensions of data and grouping these. In this
work, the primary fields of the JSON structure are
“parameters”, “serverTime” and “values”.
Once the data processing of collected data had fin-
ished, two data analysis methods were used, since
they are widely exploited in data mining processes:
linear regression and clustering. The first one was
applied with the aim of validating the collected mea-
surements from objects, besides executing a temporal
forecast of values relating to moments that a device
was unable to gather data. On the other hand, the sec-
ond method was used not only to verify the measure-
ments, but also to identify a finite set of categories
to describe data and detect the object that collected
this set of measurements. In order to perform the data
set grouping, the Elbow method was applied, which
consist of finding the ideal number of clusters in one
dataset. Basically, this method works by testing the
data variance relative to the number of clusters. A
category number is considered to be ideal when the
increase in the cluster number does not represent a
significant gain. Figure 3 illustrates the method’s op-
eration to a dataset originating from devices that col-
lect air humidity measurements.
Figure 3: Elbow method.
As shown, starting from four clusters, the dis-
tances of quadratic errors become approximately sta-
ble, showing that from that point, there is not a signif-
icant discrepancy in terms of variance. Therefore, the
ideal number of clusters to this data set is four.
It is important to point out that in order to execute
the clustering process, the KMeans algorithm of the
Scikit-learn was used. This method is defined by an it-
erative reallocation that divides the data set in K clus-
ters, reducing the mean quadratic distance between
the data points and the clusters’ centroids (Basu et al.,
2002). Scikit-learn is a Python library that integrates
a large variety of highly used algorithms in the field
of machine learning (Pedregosa et al., 2011). Further-
more, it has simple and efficient tools for mining and
data analysis. In addition, it is an unsupervised algo-
rithm, which means it does not use class information
to train or create the model.
Alternatively, in order to divide devices more
evenly over time, an analysis method was created
based on the fluctuation of statistics over time. This
method consists of sorting data in ascending order
according to their timestamp followed by their data
grouping in devices, in such a way that the statistical
characteristics regarding each device did not have big
variations. This method conceived specially for data
such as humidity or luminosity, in which sensors lo-
cated in the same place would not have data with large
standard deviations.
A Real Data Analysis in an Internet of Things Environment
441
Thus it is possible to set a limit beneath a data
set standard deviation in order to identify data orig-
inated from the same devices. Whenever data is too
discrepant, considering the limit defined, it is consid-
ered as originating from another device, and then each
device is defined according to data groups. The data
distribution over the devices over time is more homo-
geneous than the one using clustering. However, the
parameter definition for this method still, further im-
provement, such as specifying the device number and
generating a tolerance automatically.
6 RESULTS
As stated in this work, a huge amount and variety of
data is generated by devices in an IoT environment.
The IoT data extracted from the clients’ buckets for
use in this work are categorized as ‘services’, for ex-
ample, air humidity, temperature, luminosity, soil hu-
midity, electric current, and carbon dioxide level of
an environment. One million data records were ac-
quired, which correspond to values of measurements
made by devices and their respective category. This
dataset is represented in a 500 MB JSON file.
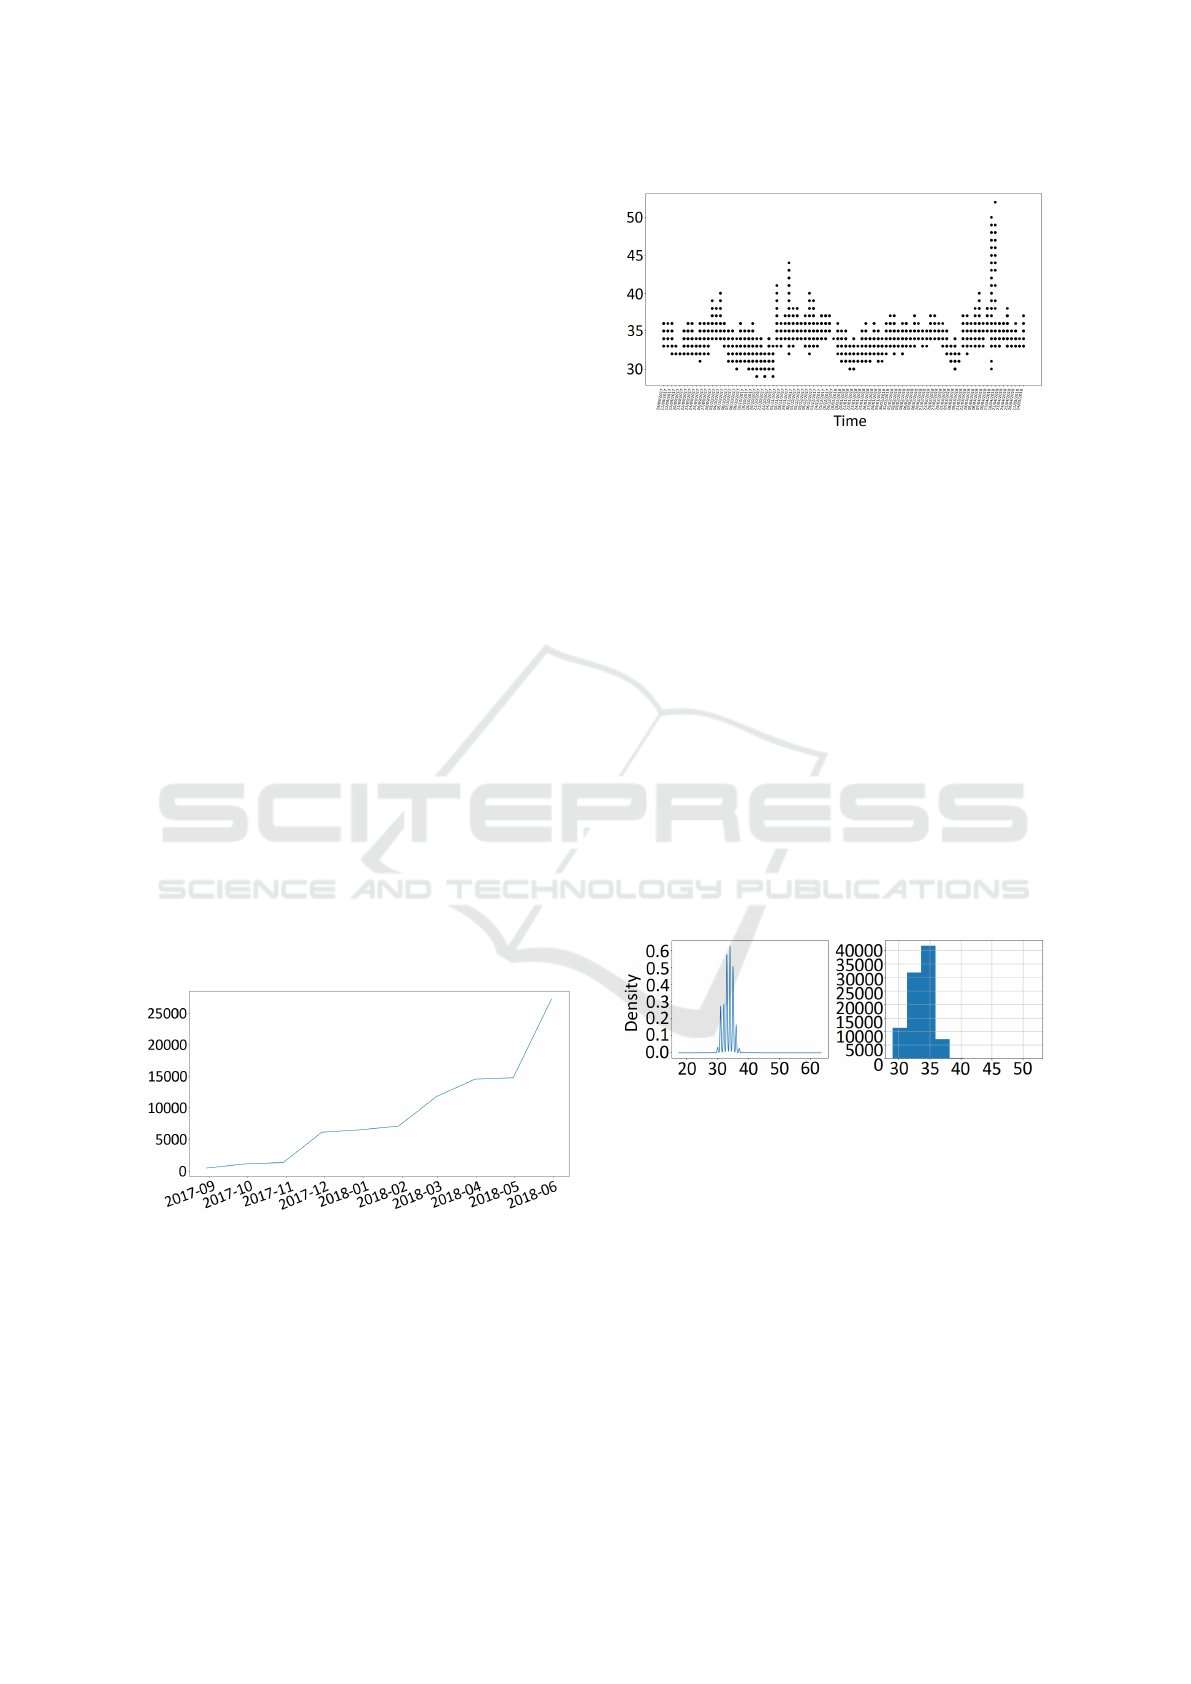
Firstly a temporal data analysis was implemented,
verifying the amount of services that was inserted
and registered by month in the database which can
be seen through in Figure 4. Over time, the number
of services published on the platform increased sig-
nificantly. The graph reinforces the premise that the
amount of information provided by the devices in an
IoT environment is enormous.
Figure 4: Amount of services × Month of insertion.
Next, an analysis of the amount of data retrieved
took place, as did a study of the range of values ob-
tained through these measurements. For example, the
air humidity service was considered which uses the
specification set called ZigBee, since it possesses the
greatest amount of data collected over time. This
analysis can be observed in Figure 5.
The Y axis represents the values of humidity ob-
Figure 5: Value measured × Moment of collection.
tained from the devices. On the other hand, the X
axis presents the moment at which this value was ob-
served. However, on some dates the data was not
collected, which may indicate inconsistency of device
operation. Furthermore, it is possible to see a few dis-
crepant values, which can indicate a malfunction of
the objects in question. So, the devices require con-
stant attention in order to verify their activity. Other-
wise collection errors can occur and a misinterpreta-
tion of the results obtained from the measures is more
likely to happen as well.
The next review aims to visualize more clearly the
amount of data retrieved from the humidity sensors,
as seen in Figure 6. The image on the left show a data
density distribution, where the Y axis illustrates the
frequency with which the point on the X axis occurs.
On the other hand, the image on the right shows the
gross amount on the Y axis of each measurement on
the X axis.
Figure 6: Measures visualization.
In total, 92,018 (corresponding to 9% of all col-
lected data) were obtained from air humidity records.
Once this quantitative analysis to showcase the
volume of data generated from the humidity devices
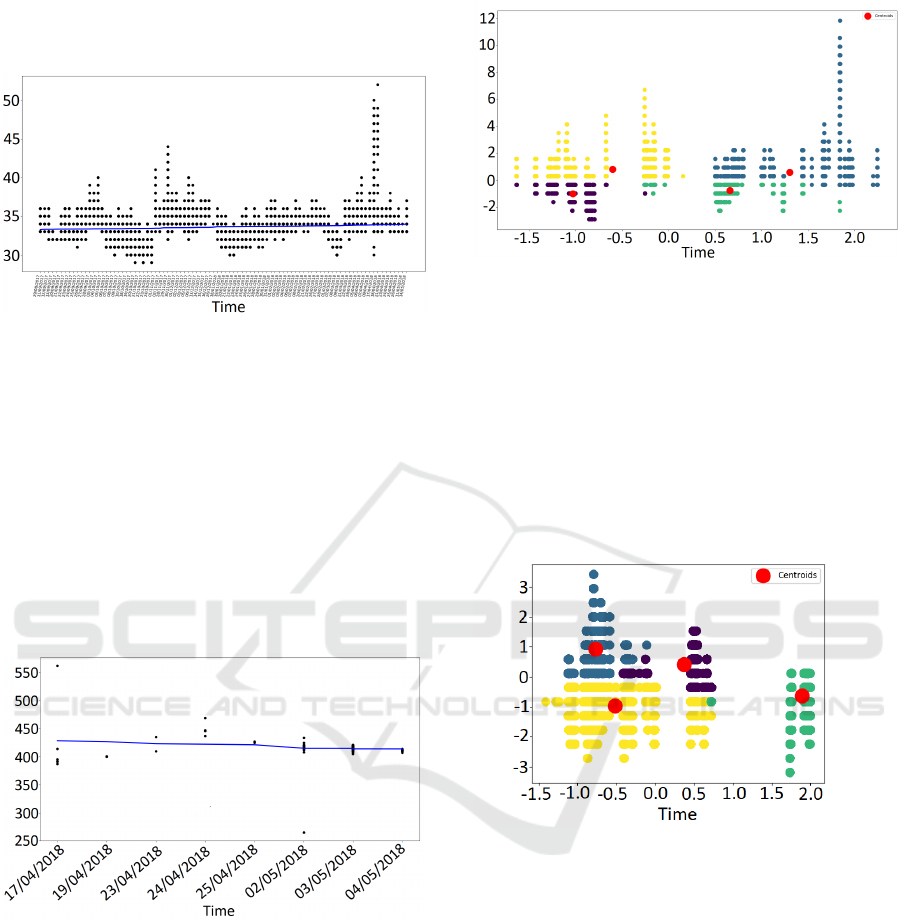
was done, the next step took place. The Linear regres-
sion method was implemented in order to estimate the
expected value (conditional) on moments that the de-
vice did not perform a collection, as well as to vali-
date the measures retrieved from the objects. Figure 7
demonstrates the application of this technique the air
humidity devices. In order to accomplish this task a
Python program was written using the Pandas library.
Pandas is a Python licensed open source library that
provides high performance as well as a wide range of
IoTBDS 2019 - 4th International Conference on Internet of Things, Big Data and Security
442
data structures and functions to perform data analysis
and graphic creation (McKinney, 2012).
Figure 7: Linear regression on humidity data.
The Y axis corresponds to the measures obtained
in percentage. Nonetheless, it can be seen on the X
axis that the collection dates do not have a constant
cadence, thus the method used helps in predicting mo-
ments when the device did not retrieve information.
Moreover, the points that are located far away from
the line need attention, since they can be interpreted
as a device malfunction or a local anomaly around
the location on which the object is installed. For ex-
emplification purposes, Figure 8 illustrates the same
method using the dataset of devices working with ser-
vices that capture ambient carbon dioxide levels.
Figure 8: Linear regression of data on carbon dioxide levels.
It is easy to see that with a smaller amount of data,
a more regulated data collection and without large dis-
crepancies, the points in the graph stay closer to the
regression curve.
Alongside the linear regression method, the clus-
tering technique was used on the datasets in order to
categorize and form clusters on top of the values ob-
tained. To accomplish this goal a Python program
was written using the Pandas library. In addition, the
method was also applied to the air humidity devices
as shown in Figure 9.
Before using the clustering method, a data pre-
processing took place in order to standardize the val-
Figure 9: Clustering on air humidity data.
ues leaving them on the same scale and with low
standard deviation. The measures shown in the axes
also changed the scale to assure a better performance
for the method. The data showcased on the graph
are grouped in four clusters. A reasonable prediction
would be that there are at least four devices collecting
air humidity measures in the UIoT laboratory.
For illustrative purposes, Figure 10 below demon-
strates the clustering method for the dataset of objects
collecting temperature measurements.
Figure 10: Clustering on temperature data.
Like the air humidity devices, the Clustering chart
of temperature measurement objects has at least four
clusters.
Of the 92,018 records, the method programmed
in Python to separate the devices based on statistical
characteristics of the series returned exactly eleven
devices to a tolerance of 50%. The main goal was
to obtain a result between 2 and 4 devices, as indi-
cated by the Elbow method explained in the previous
section of this paper. However, when analyzing the
number of records in each set of data exhibited in Ta-
ble 1, it is clear that the largest four would represent
the expected objects since they account for more than
99% of the total dataset. The data from the fifth to
the eleventh group are interpreted as intrinsic discrep-
ancies from the sensors or as cases where there was
a peak in measurement, and it is difficult to associate
A Real Data Analysis in an Internet of Things Environment
443
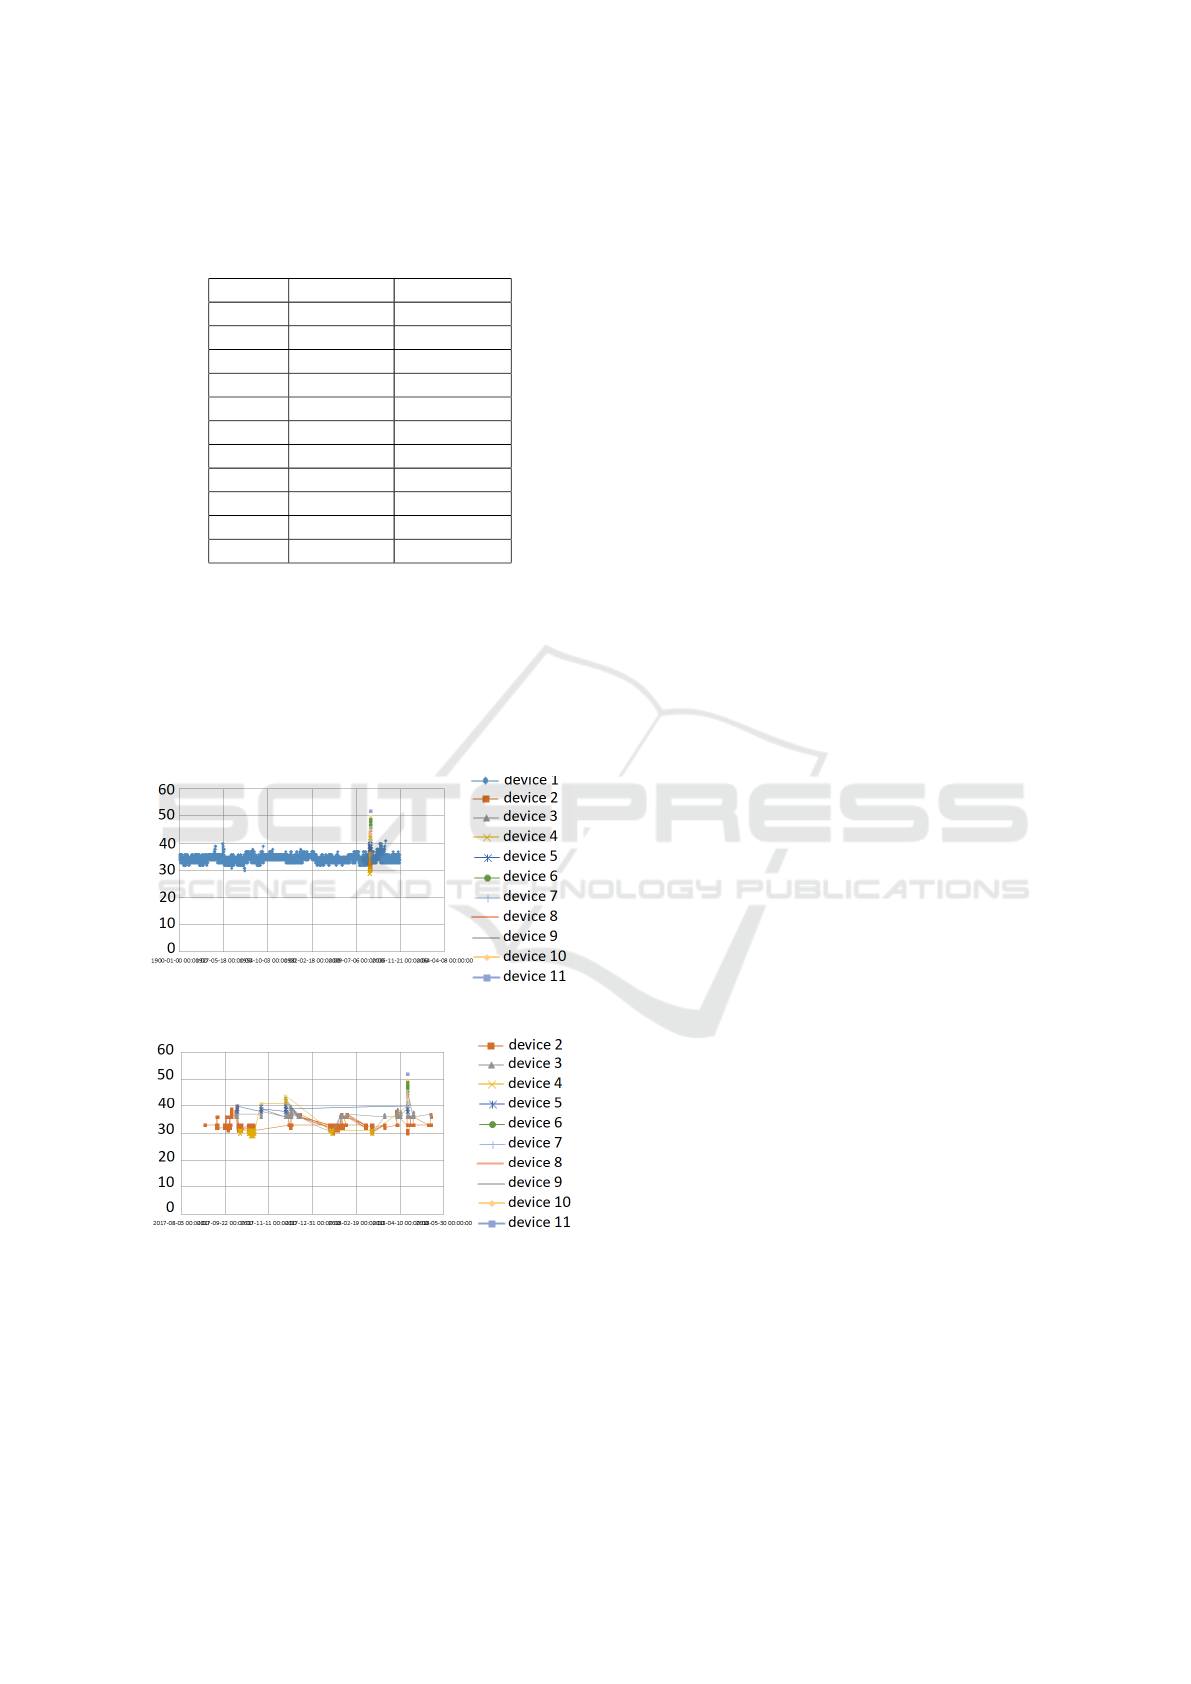
them with any specific device.
Table 1: Distribution of the data by group.
Group Measures Percentage
1 49,738 54.0525
2 29,917 32.5121
3 4,065 4.4176
4 8,174 8.8830
5 60 0.0652
6 26 0.0283
7 12 0.0130
8 15 0.0163
9 9 0.0098
10 1 0.0011
11 1 0.0011
The visualization is divided since the dots on the chart
often overlap. It is possible to see in Figure 11 that
the first object identified takes much of the view of
all the others. That is because it accounts for more
than 50% of the total dataset. On the other hand, Fig-
ure 12 showcases the data distribution without device
number one.
Figure 11: Devices separated by the method presented.
Figure 12: Devices 2 to 11 defined by the method presented.
7 CONCLUSIONS
From a complex IoT architecture managed by quite
restrictive middleware, it was possible to sustain a
strategy for data extraction as well as handling the in-
formation by filtering it and applying the analysis in
order to identify different types of measuring devices
and techniques to validate the data retrieved from the
objects. Two techniques from the data mining uni-
verse were used, Linear Regression and Clustering,
and another one was developed. These three tools
have a highly statistical nature. The results give dif-
ferent alternatives for the distribution of data in hypo-
thetical devices.
Along with the study, possible improvements on
the lab architecture were observed, such as the need
for the implementation of an algorithm that identifies
and records the objects correctly. Furthermore, the
need to define a cadence in order to better control the
collection time of the devices is noted. If the previous
task is achieved in a more harmonious manner, it will
be easier to extract knowledge from the dataset.
Additionally, in the present work, it was possible
to note the importance of techniques to analyze data
with the purpose of extracting useful knowledge from
raw data generated by heterogeneous devices. More-
over, it is clear that the IoT universe has a great capac-
ity for creating a wide range of information that needs
to be absorbed by humans.
Finally, as future work we plan on increasing the
reach of this research to other types of data mining
technologies. Moreover, an inventory of the existing
devices can be done in order to verify if the results
are, indeed, consistent to the reality not only of the
data displayed here, but for other groups of objects.
Additionally, with the inventory it would be possible
to validate the Elbow method and the other techniques
used here. On another note, a better configuration for
the method developed here is required in order to al-
low as main parameter the amount of devices on the
environment. Furthermore, the dynamic definition of
an optimal tolerance for the base data may also be ap-
plicable in this case.
ACKNOWLEDGEMENTS
This research work has the support of the Brazil-
ian research and innovation Agencies FAPDF – Re-
search Support Foundation of the Federal District
(Grants 0193.001366/2016 UIoT – Universal Internet
of Things and 0193.001365/2016 SSDDC – Secure
Software Defined Data Center), CAPES – Coordina-
tion for the Improvement of Higher Education Per-
sonnel (Grant 23038.007604/2014-69 FORTE – Tem-
pestive Forensics Project), CNPq — National Council
for Scientific and Technological Development (Grant
465741/2014-2 CyberSecINCT – Science and Tech-
nology National Institute on Cybersecurity), as well
as the Institutional Security Office of the Presidency
IoTBDS 2019 - 4th International Conference on Internet of Things, Big Data and Security
444

of the Republic of Brazil (Grant 002/2017) and the
DPGU — Brazilian Union Public Defender (Grant
066/2016).
REFERENCES
Alam, F., Mehmood, R., Katib, I., and Albeshri, A. (2016).
Analysis of eight data mining algorithms for smarter
internet of things (iot). Procedia Computer Science,
98:437–442.
Basu, S., Banerjee, A., and Mooney, R. (2002). Semi-
supervised clustering by seeding. In In Proceedings
of 19th International Conference on Machine Learn-
ing (ICML-2002. Citeseer.
Chaqfeh, M. A. and Mohamed, N. (2012). Challenges in
middleware solutions for the internet of things. In
Collaboration Technologies and Systems (CTS), 2012
International Conference on, pages 21–26. IEEE.
Cooper, J. and James, A. (2009). Challenges for database
management in the internet of things. IETE Technical
Review, 26(5):320–329.
Fayyad, U., Piatetsky-Shapiro, G., and Smyth, P.
(1996). From data mining to knowledge discovery in
databases. AI magazine, 17(3):37.
Fersi, G. (2015). Middleware for internet of things: A
study. In Distributed Computing in Sensor Systems
(DCOSS), 2015 International Conference on, pages
230–235. IEEE.
Goldschmidt, R. and Passos, E. (2015). Data Mining. Else-
vier Brasil.
Hromic, H., Le Phuoc, D., Serrano, M., Antoni
´
c, A.,
ˇ
Zarko,
I. P., Hayes, C., and Decker, S. (2015). Real time anal-
ysis of sensor data for the internet of things by means
of clustering and event processing. In Communica-
tions (ICC), 2015 IEEE International Conference on,
pages 685–691. IEEE.
Huacarpuma, R. C. (2017). Proposic¸
˜
ao de um modelo e
sistema de gerenciamento de dados distribu
´
ıdos para
internet das coisas – GDDIoT. PhD thesis, University
of Bras
´
ılia, Bras
´
ılia, DF, Brazil.
Huacarpuma, R. C., de Sousa J
´
unior, R. T., Holanda, M.,
Albuquerque, R. d. O., Garc
´
ıa Villalba, L., and Kim,
T.-H. (2017). Distributed data service for data man-
agement in internet of things middleware. Sensors,
17(5):977.
Huacarpuma, R. C., de Sousa J
´
unior, R. T., Holanda, M.,
and Lifschitz, S. (2016). Concepc¸
˜
ao e desenvolvi-
mento de um servic¸o distribu
´
ıdo de coleta e trata-
mento de dados para ambientes de internet das coisas.
In SBBD, pages 28–39.
Huang, Z. (1997). A fast clustering algorithm to cluster very
large categorical data sets in data mining. DMKD,
3(8):34–39.
Luong, N. C., Hoang, D. T., Wang, P., Niyato, D., Kim,
D. I., and Han, Z. (2016). Data collection and wireless
communication in internet of things (iot) using eco-
nomic analysis and pricing models: A survey. IEEE
Communications Surveys & Tutorials, 18(4):2546–
2590.
Mahdavinejad, M. S., Rezvan, M., Barekatain, M., Adibi,
P., Barnaghi, P., and Sheth, A. P. (2018). Ma-
chine learning for internet of things data analysis:
A survey. Digital Communications and Networks,
4(3):161–175.
McKinney, W. (2012). Python for data analysis:
Data wrangling with Pandas, NumPy, and IPython.
”O’Reilly Media, Inc.”.
Misra, G., Kumar, V., Agarwal, A., and Agarwal, K. (2016).
Internet of things (iot)–a technological analysis and
survey on vision, concepts, challenges, innovation di-
rections, technologies, and applications (an upcom-
ing or future generation computer communication sys-
tem technology). American Journal of Electrical and
Electronic Engineering, 4(1):23–32.
Pedregosa, F., Varoquaux, G., Gramfort, A., Michel, V.,
Thirion, B., Grisel, O., Blondel, M., Prettenhofer,
P., Weiss, R., Dubourg, V., et al. (2011). Scikit-
learn: Machine learning in python. Journal of ma-
chine learning research, 12(Oct):2825–2830.
Plageras, A. P., Psannis, K. E., Stergiou, C., Wang, H.,
and Gupta, B. B. (2018). Efficient iot-based sen-
sor big data collection–processing and analysis in
smart buildings. Future Generation Computer Sys-
tems, 82:349–357.
Silva, C. C. d. M., Ferreira, H. G. C., de Sousa J
´
unior,
R. T., Buiati, F., and Villalba, L. J. G. (2016). De-
sign and evaluation of a services interface for the in-
ternet of things. Wireless Personal Communications,
91(4):1711–1748.
Whitmore, A., Agarwal, A., and Da Xu, L. (2015). The
internet of things — a survey of topics and trends. In-
formation Systems Frontiers, 17(2):261–274.
A Real Data Analysis in an Internet of Things Environment
445
