
Profile Extraction and Deep Autoencoder Feature Extraction for
Elevator Fault Detection
Krishna Mohan Mishra, Tomi R. Krogerus and Kalevi J. Huhtala
Unit of Automation Technology and Mechanical Engineering, Tampere University, Tampere, Finland
Keywords:
Elevator System, Deep Autoencoder, Fault Detection, Feature Extraction, Random Forest, Profile Extraction.
Abstract:
In this paper, we propose a new algorithm for data extraction from time series signal data, and furthermore
automatic calculation of highly informative deep features to be used in fault detection. In data extraction
elevator start and stop events are extracted from sensor data, and a generic deep autoencoder model is also
developed for automated feature extraction from the extracted profiles. After this, extracted deep features
are classified with random forest algorithm for fault detection. Sensor data are labelled as healthy and faulty
based on the maintenance actions recorded. The remaining healthy data are used for validation of the model
to prove its efficacy in terms of avoiding false positives. We have achieved 100% accuracy in fault detection
along with avoiding false positives based on new extracted deep features, which outperforms results using
existing features. Existing features are also classified with random forest to compare results. Our developed
algorithm provides better results due to the new deep features extracted from the dataset compared to existing
features. This research will help various predictive maintenance systems to detect false alarms, which will in
turn reduce unnecessary visits of service technicians to installation sites.
1 INTRODUCTION
In recent years, elevator systems have been used more
and more extensively in apartments, commercial fa-
cilities and office buildings. Nowadays 54% of the
world’s population lives in urban areas (Desa, 2014).
Therefore, elevator systems need proper maintenance
and safety. The next step for improving the safety of
elevator systems is the development of predictive and
pre-emptive maintenance strategies, which will also
reduce repair costs and increase the lifetime whilst
maximizing the uptime of the system. Elevator pro-
duction and service companies are now opting for a
predictive maintenance policy to provide better ser-
vice to customers. They are remotely monitoring
faults in elevators and estimating the remaining life-
time of the components responsible for faults. Eleva-
tor systems require fault detection and diagnosis for
healthy operation.
Fault diagnosis methods based on deep neural net-
works (Jia et al., 2016) and convolutional neural net-
works (Xia et al., 2018) feature extraction method-
ology are presented as state of the art for rotatory
machines similar to elevator systems. Support vec-
tor machines (Mart
´
ınez-Rego et al., 2011) and ex-
treme learning machines (Yang and Zhang, 2016) are
also used as fault detection methods for rotatory ma-
chines. However, we have developed an intelligent
deep autoencoder random forest based feature extrac-
tion methodology for fault detection in elevator sys-
tems to improve the performance of traditional fault
diagnosis methods.
Acceleration profile extraction for health moni-
toring is a major issue in automated industrial ap-
plications like elevator system, computer numerical
control, machinery and robotics. Although rotating
machine have been running for decades, but accel-
eration profile extraction and processing methods are
not widely available. Acceleration profile extraction
methods have applied in electric vehicles (Bingham
et al., 2012), computer numerical control systems
(Nam and Yang, 2004) and horizontal planes (Soyka
et al., 2011). Kalman filter (Wang et al., 2015) is one
of the methods being used for acceleration profile ex-
traction. However, we have developed an off-line pro-
file extraction algorithm based on low-pass filtering
and peak detection to extract elevator start and stop
events from sensor data.
In the last decade, neural networks (Calimeri
et al., ) have extracted highly meaningful statisti-
cal patterns from large-scale and high-dimensional
datasets. Neural networks has also been used to im-
Mishra, K., Krogerus, T. and Huhtala, K.
Profile Extraction and Deep Autoencoder Feature Extraction for Elevator Fault Detection.
DOI: 10.5220/0007802003130320
In Proceedings of the 16th International Joint Conference on e-Business and Telecommunications (ICETE 2019), pages 313-320
ISBN: 978-989-758-378-0
Copyright
c
2019 by SCITEPRESS – Science and Technology Publications, Lda. All rights reserved
313

prove elevator ride comfort via speed profile design.
Neural networks (Lee, 2014) has been applied suc-
cessfully to nonlinear time series modeling. A deep
learning network can self-learn the relevant features
from multiple signals. Deep learning algorithms are
frequently used in areas such as signal processing
(Rivas-Perez et al., 2011), biotechnology (Sahba and
Venetsanopoulos, 2010), speech recognition (Maha
et al., 2010) and image classification (Hbali et al.,
2013). Autoencoding is a process for nonlinear di-
mension reduction with natural transformation archi-
tecture using feedforward neural network (H
¨
anninen
and K
¨
arkk
¨
ainen, 2016). Autoencoders have proven
powerful as nonlinear feature extractors. Autoen-
coders can increase the generalization ability of ma-
chine learning models by extracting features of high
interest as well as making possible its application to
sensor data. Autoencoders were first introduced by
LeCun (Fogelman-Soulie et al., 1987), and have been
studied for decades. Traditionally, feature learning
and dimensionality reduction are the two main fea-
tures of autoencoders. Recently, autoencoders have
been considered one of the most compelling subspace
analysis techniques because of the existing theoreti-
cal relations between autoencoders and latent variable
models. Autoencoders have been used for feature ex-
traction from the data in systems like induction mo-
tor (Sun et al., 2016) and wind turbines (Jiang et al.,
2018) for fault detection, different from elevator sys-
tems as in our research.
In our previous research, raw sensor data, mainly
acceleration signals, were used to calculate elevator
key performance and ride quality features, which we
call here existing features. Random forest was used
for fault detection based on these existing features.
Existing domain specific features are calculated from
raw sensor data, but that requires expert knowledge
of the domain and results in a loss of information to
some extent. To avoid these implications, we have de-
veloped an algorithm for profile extraction from the
raw sensor data rides and a generic algorithm with
deep autoencoder random forest approach for auto-
mated feature extraction from raw sensor data profiles
for fault detection in elevator systems. The rest of
this paper is organized as follows. Section II presents
the methodology of the paper including profile extrac-
tion, deep autoencoder and random forest algorithms.
Then, section III includes the details of experiments
performed, results and discussion. Finally, section IV
concludes the paper and presents the future work.
2 METHODOLOGY
In this study, we have utilised 12 different existing
features derived from raw sensor data describing the
motion and vibration of an elevator for fault detection
and diagnostics of multiple faults. We have developed
an automated feature extraction technique for raw
sensor data in this research as an extension to the work
of our previous research (Mishra et al., 2019) to com-
pare the results using new extracted deep features. In
addition, we have analyzed almost two months of the
data from five traction elevators in this research as
an extension to one elevator in our previous research.
Each elevator usually produces around 200 rides per
day. Each ride used in analysis contains around 5000
rows of the data, which proves robustness of the al-
gorithm over large dataset. We have used 70% of the
data for training and rest 30% for testing. Figure 1
shows the fault detection approach used in this pa-
per, which includes raw sensor data rides extracted
based on time periods provided by the maintenance
data from all floor patterns. Rides collected from an
elevator system are fed to the algorithm for profile ex-
traction. These extracted profiles from all five trac-
tion elevators are then fed to the deep autoencoder
model for feature extraction, and then random forest
performs the fault detection task based on extracted
deep features. We only extract start and stop profiles
from the rides because of the different lengths of rides
for each floor combination due to the constant speed
phase, which is longer when there is longer travel.
2.1 Profile Extraction Algorithm
Raw sensor data collected from elevator systems typi-
cally encompass a large collection of data points sam-
pled at high frequency. In order to feed large sensor
data to cloud-based applications, it is often desirable
to pre-process the data and perform compression be-
fore transmission, for example in the form of edge
computing performed in the device end. Here we as-
sume that raw data is in the form of a one-dimensional
time series vector with equidistant sampling times.
The goal of the proposed method is to compress the
raw time series obtained from machinery while main-
taining the information about key events, and sec-
ondly, to make the data more applicable for machine
learning.
The algorithm works in two stages. In the first
stage, the signal is pre-processed and normalized, fol-
lowed by low-pass filtering in order to reduce noise
spikes. The low-pass filtered signal is used for peak
detection, which for each elevator travel detects a lo-
cal minimum and maximum, corresponding to accel-
SIGMAP 2019 - 16th International Conference on Signal Processing and Multimedia Applications
314
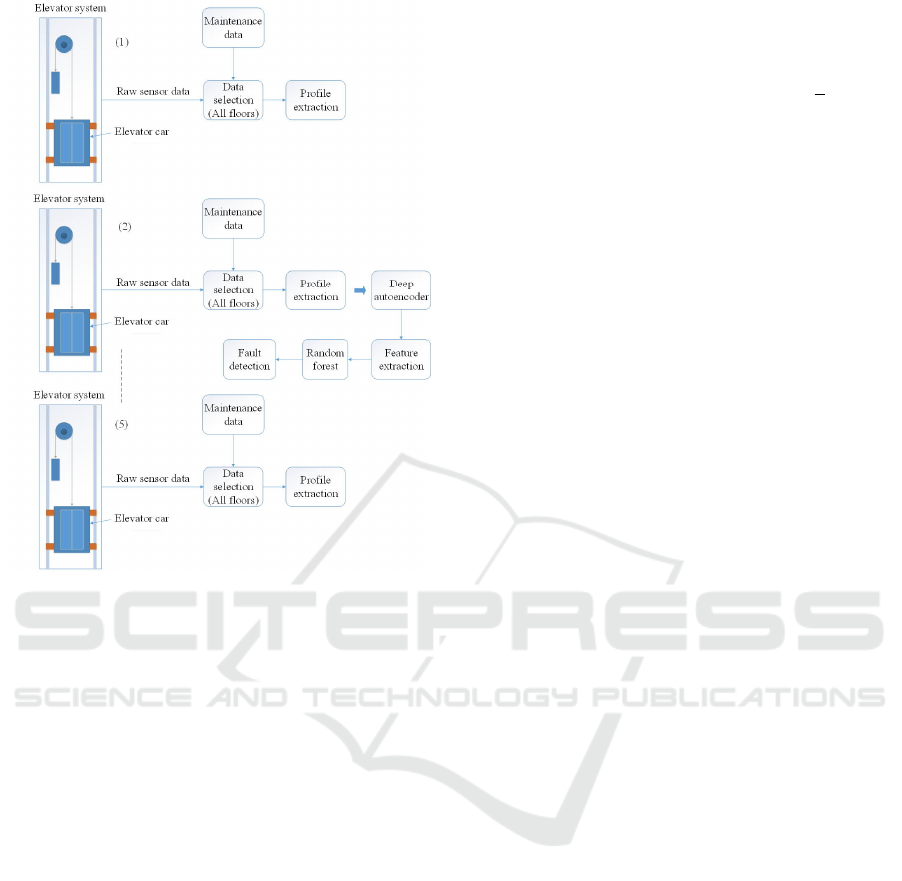
Figure 1: Fault detection approach.
eration and deceleration (start and stop) events.
In the second stage, alignment and collection of
equal length profiles is performed based on window-
ing of the acceleration signal near the peak events.
In this stage, the raw acceleration signal is used in-
stead of the filtered signal. A number of time domain
alignment methods have been proposed in the litera-
ture. Dynamic time warping (DTW) has been com-
monly applied, e.g. in speech recognition (Di Mar-
tino, 1985), whereas various alignment techniques for
sensor data have been presented in (Rhudy, 2014).
Here, alignment is performed against a reference pro-
file, which is initialized to the known approximate
length of the acceleration and deceleration windows.
The reference profile is aligned against the raw data
in the window of the detected peaks. The criterion
for optimal alignment was defined as the alignment
that minimizes the sum of the Euclidean or L
2
norm.
The output from this operation is an n×m matrix of
aligned profiles describing n acceleration and decel-
eration events of length m.
In order to improve the alignment accuracy, the
reference profile is updated iteratively following each
run. Each sequence in the profile matrix is of the same
sample size and closely synchronized in time and can
hence be considered a repetition of the same signal.
Using signal averaging, the new reference profile is
calculated as the mean of the n extracted profiles. This
both maintains the main characteristics of the signal
and reduces the noise. Assuming white noise and per-
fect synchronization, signal averaging improves the
signal-to-noise ratio (SNR) by a factor of
√
n. The ref-
erence profile is updated on-line during the alignment
stage or in batch mode by multiple iterations through
the same dataset.
The off-line profile extraction algorithm is de-
scribed as follows.
Off-line Profile Extraction Algorithm.
Pre-procession
1. Read a vector of raw acceleration data contain-
ing k elevator travels. Define the zero mean trans-
formed dataset as X.
2. Perform low-pass filtering on X and obtain de-
noised dataset Y.
Initialization
3. Define parameters for reference profile. Set
window length to m samples and height h to the 99th
percentile of the low-pass filtered dataset.
4. Set threshold limit t for triggering peak detec-
tion as a fraction of h.
5. Define alignment window size a and set k=1.
Iteration
6. From Y(k), detect peak acceleration points y
min
and y
max
satisfying abs(y
min
,
max
) ≥t
7. Align reference profile R against raw dataset X
in the vicinity of detected peaks by minimizing the L
2
norm according to
min
a/2
∑
i=−a/2
m
∑
j=1
[−r
j
−x
min+i+j
]
2
(1)
min
a/2
∑
i=−a/2
m
∑
j=1
[r
j
−x
max+i+j
]
2
(2)
8. Add aligned data points from X(k) as rows into
an n×m profile matrix, alternatively separate matrices
according to direction of travel (min/max).
9. Set travel window k=k+1 and repeat steps 6-8
until end of dataset.
10. Update reference profile with the signal-
averaged profile obtained from the column-wise mean
of the new profile matrix. Set k=1 and continue with
new batch iterations by repeating steps 6-9.
2.2 Deep Autoencoder
The deep autoencoder model is based on deep learn-
ing autoencoder feature extraction methodology. A
basic autoencoder is a fully connected three-layer
feedforward neural network with one hidden layer.
Profile Extraction and Deep Autoencoder Feature Extraction for Elevator Fault Detection
315
Typically, the autoencoder has the same number of
neurons in the input and output layer and reproduces
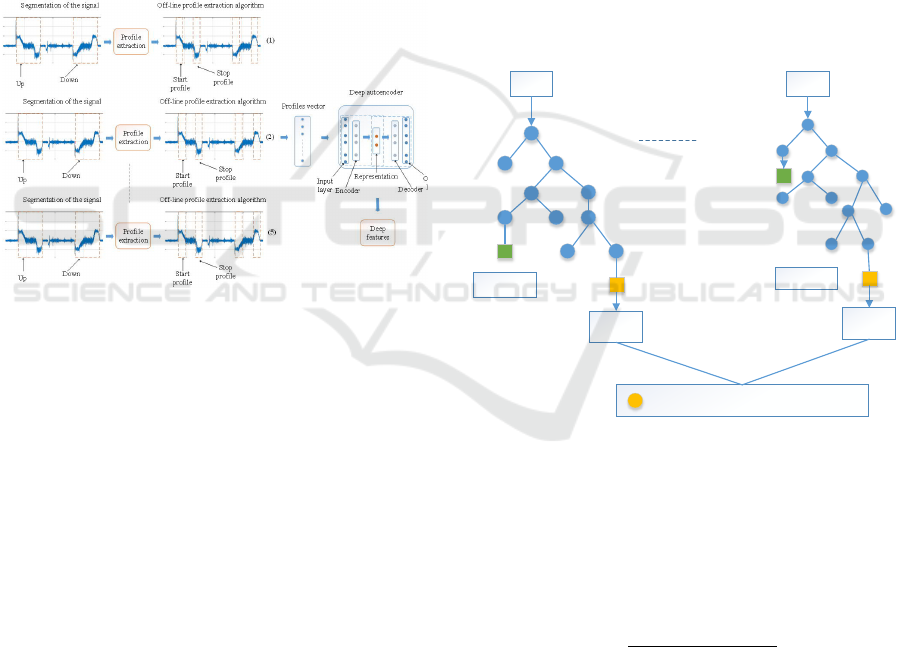
its inputs as its output. We are using a five layer deep
autoencoder (see Figure 2) including input, output,
encoder, decoder and representation layers, which is
a different approach than in (Jiang et al., 2018), (Vin-
cent et al., 2008). In our approach, we first analyze
the data to find all floor patterns and then feed the
segmented raw sensor data windows in up and down
directions separately to the algorithm for profile ex-
traction. Extracted profiles are fed to the deep autoen-
coder model for extracting new deep features. Lastly,
we apply random forest as a classifier for fault detec-
tion based on new deep features extracted from the
profiles. We have combined healthy and faulty pro-
files as a vector from all five traction elevators before
feature extraction.
Figure 2: Off-line profile extraction and deep autoencoder
feature extraction approach.
The encoder transforms the input x into corrupted
input data x
’
using hidden representation H through
nonlinear mapping
H = f (W
1
x
’
+ b) (3)
where f(.) is a nonlinear activation function as the
sigmoid function, W
1
∈R
k*m
is the weight matrix and
b ∈ R
k
the bias vector to be optimized in encoding
with k nodes in the hidden layer (Vincent et al., 2008).
Then, with parameters W
2
∈ R
m*k
and c ∈ R
m
, the
decoder uses nonlinear transformation to map hidden
representation H to a reconstructed vector x
”
at the
output layer
x
”
= g(W
2
H + c) (4)
where g(.) is again nonlinear function (sigmoid func-
tion). In this study, the weight matrix is W
2
=W
1
T
,
which is tied weights for better learning performance
(Japkowicz et al., 2000).
2.3 Random Forest
Random forest includes an additional layer of ran-
domness to bagging. It uses different bootstrap sam-
ples of the data for constructing each tree (Breiman,
2001). The best subset of predictors is used to split
each node in random forest. This counterintuitive
strategy is the best feature of random forest, which
makes it different from other classifiers as well as ro-
bust against overfitting. It is one of the most user-
friendly classifiers because it consists of only two
parameters: the number of variables and number of
trees. However, it is not usually very sensitive to their
values (Liaw and Wiener, 2002). The final classifi-
cation accuracy of random forest is calculated by av-
eraging, i.e. arithmetic mean of the probabilities of
assigning classes related to all the produced trees (e).
Testing data (d) that is unknown to all the decision
trees is used for evaluation by the voting method (see
Figure 3).
Vote 1
Vote e
Tree 1
Tree e
Assign Class (Majority Vote)
d d
Figure 3: Classification phase of random forest classifier.
Specifically, let sensor data value v
l
e
have training
sample l
th
in the arrived leaf node of the decision tree
e ∈ E , where l ∈ [1,...,L
e
] and the number of train-
ing samples is L
e
in the current arrived leaf node of
decision tree e. The final prediction result is given by
(Huynh et al., 2016):
µ =
∑
e∈E
∑
l∈[1,...,L
e
]
v
l
e
∑
e∈E
L
e
(5)
All classification trees providing a final decision
by voting method are given by (Liu et al., 2017):
H(a) = argmax
y
j
∑
i∈[1,2,...,Z]
I(h
i
(a) = y
j
) (6)
where j= 1,2,...,C and the combination model is H(a)
, the number of training subsets are Z depending on
SIGMAP 2019 - 16th International Conference on Signal Processing and Multimedia Applications
316
which decision tree model is h
i
(a) , i ∈ [1,2, ...,Z]
while output or labels of the P classes are y
j
, j=
1,2,...,P and combined strategy is I(.) defined as:
I(x) =
(
1, h
i
(a) = y
j
0, otherwise
(7)
where output of the decision tree is h
i
(a) and i
th
class
label of the P classes is y
j
, j= 1,2,...,P .
2.4 Evaluation Parameters
Evaluation parameters used in this research are de-
fined with the confusion matrix in Table 1.
Table 1: Confusion matrix.
Predicted (P) (N)
Actual (P) True positive (TP) False negative (FN)
(N) False positive (FP) True negative (TN)
The rate of positive test result is sensitivity,
Sensitivity =
T P
T P + FN
∗100% (8)
The ratio of a negative test result is specificity,
Speci f icity =
T N
T N + FP
∗100% (9)
The overall measure is accuracy,
Accuracy =
T P + T N
T P + FP + T N + FN
∗100% (10)
3 RESULTS AND DISCUSSION
In this research, we first selected all floor patterns like
floor 2-5, 3-8 and so on from the data, some of which
are shown in Table 2.
Table 2: Floor patterns.
Start floor Stop floor
0 1
2 5
3 8
4 6
The next step includes the selection of faulty rides
from all floor patterns based on time periods provided
by the maintenance data. An equal amount of healthy
rides are also selected. Only the vertical component
of acceleration data is selected in this research be-
cause it is the most informative aspect, consisting of
significant changes in vibration levels as compared to
other components. Healthy and faulty rides are fed to
the algorithm for profile extraction separately. Start
and stop profiles are of equal length, irrespective of
floor combination.
3.1 Up Movement
We have analyzed up and down movements separately
because the traction based elevator usually produces
slightly different levels of vibration in each direction.
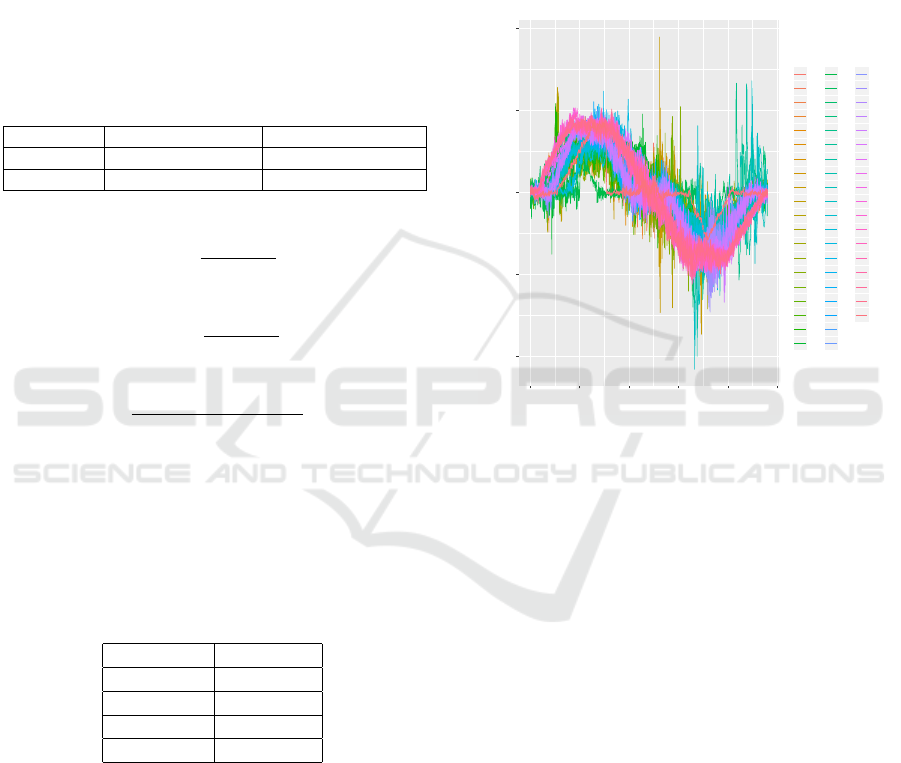
First, we have selected faulty rides based on time pe-
riods provided by the maintenance data, including all
floor patterns, which is fed to the algorithm for profile
extraction, as shown in Figure 4.
-2000
-1000
0
1000
2000
0 250 500 750 1000 1250
Samples
Acc vertical
variable
V1
V2
V3
V4
V5
V6
V7
V8
V9
V10
V11
V12
V13
V14
V15
V16
V17
V18
V19
V20
V21
V22
V23
V24
V25
V26
V27
V28
V29
V30
V31
V32
V33
V34
V35
V36
V37
V38
V39
V40
V41
V42
V43
V44
V45
V46
V47
V48
V49
V50
V51
V52
V53
V54
V55
V56
V57
V58
All floor faulty profiles-up
Figure 4: Profiles from faulty rides (Acc represents acceler-
ation signal).
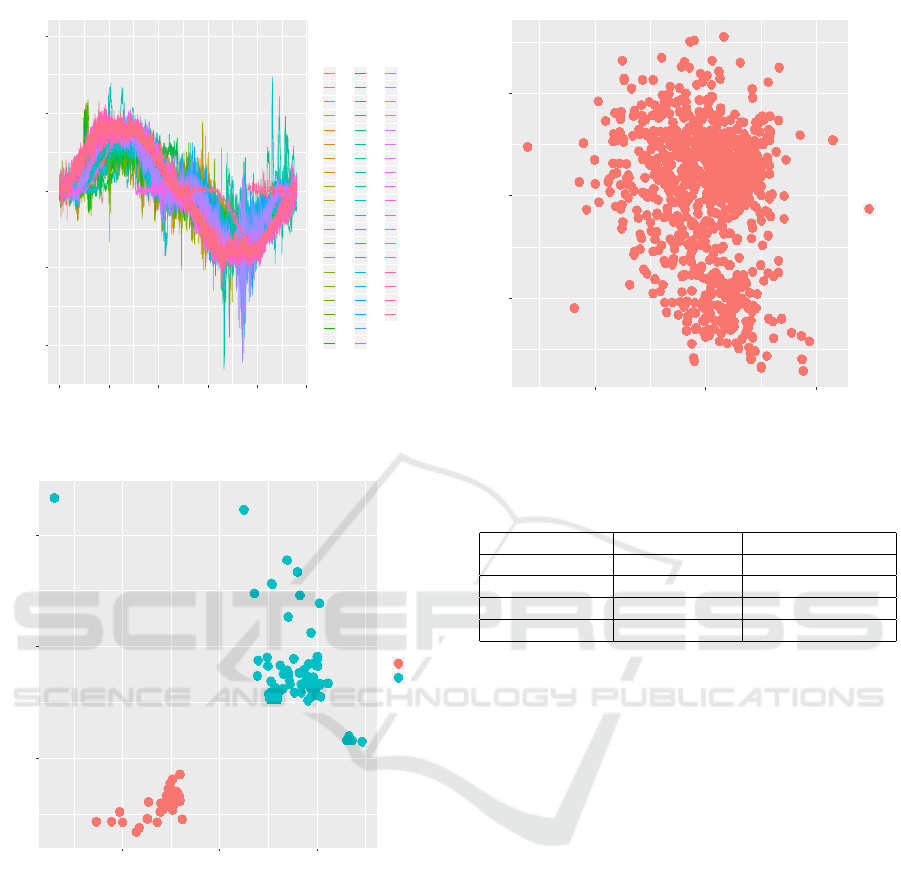
Then we have selected an equal number of rides
for healthy data, and the extracted profiles are shown
in Figure 5.The next step is to label both the healthy
and faulty profiles with class labels 0 and 1 respec-
tively. Healthy and faulty profiles with class labels are
fed to the deep autoencoder model and the generated
deep features are shown in Figure 6. These are called
deep features or latent features in deep autoencoder
terminology, which shows hidden representations of
the data. In Figure 6, we can see that both features
with class labels are perfectly separated, which results
in better fault detection.
Extracted deep features are fed to the random for-
est algorithm for classification, and the results pro-
vide 100% accuracy in fault detection in Table 3. We
have compared accuracy in terms of avoiding false
positives from both features and found that new deep
features generated in this research outperform the ex-
isting features. We have used the remaining healthy
rides for extracting profiles to analyze the number of
false positives. These healthy profiles are labelled as
class 0 and fed to the deep autoencoder to extract new
deep features from the profiles, as shown in Figure 7.
These new deep features are then classified
Profile Extraction and Deep Autoencoder Feature Extraction for Elevator Fault Detection
317
-2000
-1000
0
1000
2000
0 250 500 750 1000 1250
Samples
Acc vertical
variable
V1
V2
V3
V4
V5
V6
V7
V8
V9
V10
V11
V12
V13
V14
V15
V16
V17
V18
V19
V20
V21
V22
V23
V24
V25
V26
V27
V28
V29
V30
V31
V32
V33
V34
V35
V36
V37
V38
V39
V40
V41
V42
V43
V44
V45
V46
V47
V48
V49
V50
V51
V52
V53
V54
V55
V56
V57
V58
All floor healthy profiles-up
Figure 5: Profiles from healthy rides.
0.0
0.1
0.2
-0.2 0.0 0.2
Feature axis 1
Feature axis 2
class
0
1
Deep features-up
Figure 6: Extracted deep autoencoder features (visualiza-
tion of the features w.r.t class variable).
with the pre-trained deep autoencoder random forest
model to test the efficacy of the model in terms of
false positives. Table 3 presents the results for up-
ward movement of the elevator in terms of accuracy,
sensitivity and specificity. We have also included the
accuracy of avoiding false positives as an evaluation
parameter for this research. The results show that the
new deep features provide better accuracy in terms
of fault detection and avoiding false positives from
the data, which is helpful in detecting false alarms
for elevator predictive maintenance strategies. It is
extremely helpful in reducing unnecessary visits by
maintenance personnel to installation sites.
-0.4
0.0
0.4
-0.5 0.0 0.5
Feature axis 1
Feature axis 2
class
0
Features from the remaining healthy profiles-up
Figure 7: Extracted deep features (only healthy profiles).
Table 3: Fault detection analysis (False positives field re-
lated to analyzing remaining healthy profiles after the train-
ing and testing phase).
Deep features Existing features
Accuracy 1 0.50
Sensitivity 1 0.53
Specificity 1 0.47
False positives 1 0.43
3.2 Down Movement
For downward motion, we have repeated the same
analysis procedure as in the case of upward motion.
We feed both healthy and faulty profiles with class la-
bels to the deep autoencoder model for the extraction
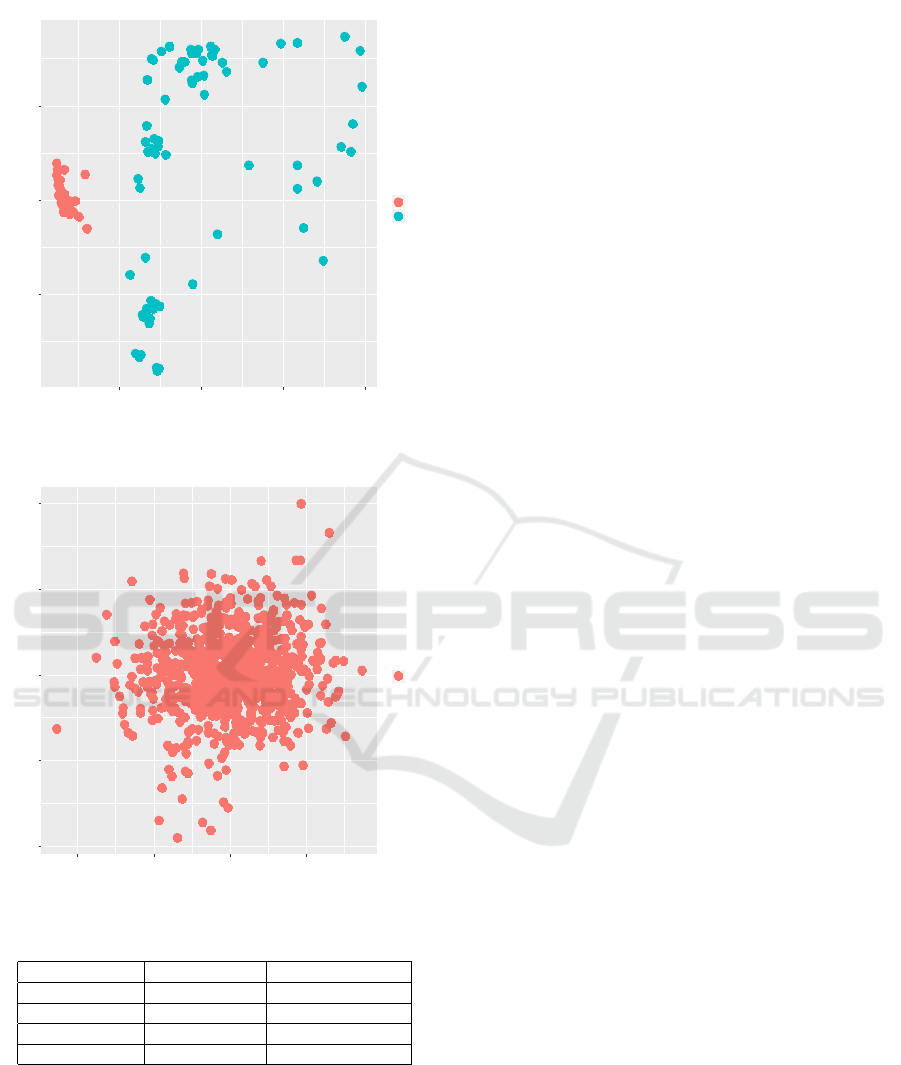
of new deep features, as shown in Figure 8.
Finally, the new extracted deep features are clas-
sified with random forest model and the results are
shown in Table 4. After this, the remaining healthy
rides are used to analyze the number of false positives.
The extracted deep features are shown in Figure 9.
Table 4 presents the results for fault detection with
deep autoencoder random forest model in the down-
ward direction. The results are similar to the upward
direction but we can see significant change in terms
of accuracy of fault detection and when analyzing the
number of false positives with new deep features.
SIGMAP 2019 - 16th International Conference on Signal Processing and Multimedia Applications
318
-0.5
0.0
0.5
-0.5 0.0 0.5 1.0
Feature axis 1
Feature axis 2
class
0
1
Deep features-down
Figure 8: Extracted deep features.
-0.6
-0.3
0.0
0.3
0.6
-0.50 -0.25 0.00 0.25
Feature axis 1
Feature axis 2
class
0
Features from the remaining healthy profiles-down
Figure 9: Extracted deep features (only healthy profiles).
Table 4: Fault detection analysis.
Deep features Existing features
Accuracy 1 0.41
Sensitivity 1 0.36
Specificity 1 0.46
False positives 1 0.54
4 CONCLUSIONS AND FUTURE
WORK
This research focuses on the health monitoring of ele-
vator systems using a novel fault detection technique.
The goal of this research was to develop generic mod-
els for profile extraction and automated feature ex-
traction for fault detection in the health state monitor-
ing of elevator systems. Our approach in this research
provided 100% accuracy in fault detection and also
in the case of analyzing false positives for all floor
combinations with new extracted deep features. The
results support the goal of this research of developing
generic models which can be used in other machine
systems for fault detection. The results are useful
in terms of detecting false alarms in elevator predic-
tive maintenance. The approach will also reduce un-
necessary visits of maintenance personnel to installa-
tion sites if the analysis results are utilized to allocate
maintenance resources. Our developed models can
also be used for different predictive maintenance so-
lutions to automatically generate highly informative
deep features for solving diagnostics problems. Our
models outperform others because of new deep fea-
tures extracted from the dataset as compared to ex-
isting features calculated from the same raw sensor
dataset. The automated feature extraction approach
does not require any prior domain knowledge. It
also provides dimensionality reduction and is robust
against overfitting characteristics. The experimental
results show the feasibility of our generic models,
which will increase the safety of passengers as well
as serve the public interest.
In future work, we will extend our approach on
other real-world big data cases to validate its potential
for other applications and improve its efficacy.
REFERENCES
Bingham, C., Walsh, C., and Carroll, S. (2012). Impact of
driving characteristics on electric vehicle energy con-
sumption and range. IET Intelligent Transport Sys-
tems, 6(1):29–35.
Breiman, L. (2001). Random forests. Machine learning,
45(1):5–32.
Calimeri, F., Marzullo, A., Stamile, C., and Terracina, G.
Graph based neural networks for automatic classifica-
tion of multiple sclerosis clinical courses. In Proceed-
ings of the European Symposium on Artificial Neural
Networks, Computational Intelligence and Machine
Learning (ESANN 18)(2018, forthcoming).
Desa (2014). World urbanization prospects, the 2011 revi-
sion. Population Division, Department of Economic
and Social Affairs, United Nations Secretariat.
Di Martino, J. (1985). Dynamic time warping algorithms
for isolated and connected word recognition. In New
systems and architectures for automatic speech recog-
nition and synthesis, pages 405–418. Springer.
Fogelman-Soulie, F., Robert, Y., and Tchuente, M. (1987).
Automata networks in computer science: theory and
Profile Extraction and Deep Autoencoder Feature Extraction for Elevator Fault Detection
319

applications. Manchester University Press and Prince-
ton University Press.
H
¨
anninen, J. and K
¨
arkk
¨
ainen, T. (2016). Comparison
of four-and six-layered configurations for deep net-
work pretraining. In European Symposium on Artifi-
cial Neural Networks, Computational Intelligence and
Machine Learning.
Hbali, Y., Sadgal, M., and Fazziki, A. E. (2013). Mark-
erless augmented reality based on local binary pat-
tern. In Signal Processing and Multimedia Applica-
tions (SIGMAP), 2013 International Conference on,
pages 137–141. IEEE.
Huynh, T., Gao, Y., Kang, J., Wang, L., Zhang, P., Lian,
J., and Shen, D. (2016). Estimating ct image from
mri data using structured random forest and auto-
context model. IEEE transactions on medical imag-
ing, 35(1):174.
Japkowicz, N., Hanson, S. J., and Gluck, M. A. (2000).
Nonlinear autoassociation is not equivalent to pca.
Neural computation, 12(3):531–545.
Jia, F., Lei, Y., Lin, J., Zhou, X., and Lu, N. (2016). Deep
neural networks: A promising tool for fault character-
istic mining and intelligent diagnosis of rotating ma-
chinery with massive data. Mechanical Systems and
Signal Processing, 72:303–315.
Jiang, G., Xie, P., He, H., and Yan, J. (2018). Wind turbine
fault detection using a denoising autoencoder with
temporal information. IEEE/ASME Transactions on
Mechatronics, 23(1):89–100.
Lee, C.-C. (2014). Gender classification using m-estimator
based radial basis function neural network. In Signal
Processing and Multimedia Applications (SIGMAP),
2014 International Conference on, pages 302–306.
IEEE.
Liaw, A. and Wiener, M. (2002). Classification and regres-
sion by randomforest. R news, 2(3):18–22.
Liu, Z., Tang, B., He, X., Qiu, Q., and Liu, F. (2017).
Class-specific random forest with cross-correlation
constraints for spectral–spatial hyperspectral image
classification. IEEE Geoscience and Remote Sensing
Letters, 14(2):257–261.
Maha, C., Maher, E., Mohamed, K., and Chokri, B. A.
(2010). Dct based blind audio watermarking scheme.
In Signal Processing and Multimedia Applications
(SIGMAP), Proceedings of the 2010 International
Conference on, pages 139–144. IEEE.
Mart
´
ınez-Rego, D., Fontenla-Romero, O., and Alonso-
Betanzos, A. (2011). Power wind mill fault detection
via one-class ν-svm vibration signal analysis. In Neu-
ral Networks (IJCNN), The 2011 International Joint
Conference on, pages 511–518. IEEE.
Mishra, K. M., Krogerus, T., and Huhtala, K. (2019). Fault
detection of elevator systems using deep autoencoder
feature extraction. In Research Challenges in Infor-
mation Science (RCIS), 2019 International Confer-
ence on. IEEE.
Nam, S.-H. and Yang, M.-Y. (2004). A study on a
generalized parametric interpolator with real-time
jerk-limited acceleration. Computer-Aided Design,
36(1):27–36.
Rhudy, M. (2014). Time alignment techniques for experi-
mental sensor data. Int. J. Comput. Sci. Eng. Survey,
5(2):1–14.
Rivas-Perez, M., Linares-Barranco, A., Jimenez-
Fernandez, A., Civit, A., and Jimenez, G. (2011). Aer
spike-processing filter simulator: Implementation of
an aer simulator based on cellular automata. In Signal
Processing and Multimedia Applications (SIGMAP),
2011 Proceedings of the International Conference on,
pages 1–6. IEEE.
Sahba, F. and Venetsanopoulos, A. (2010). Breast mass de-
tection using bilateral filter and mean shift based clus-
tering. In Signal Processing and Multimedia Appli-
cations (SIGMAP), Proceedings of the 2010 Interna-
tional Conference on, pages 88–94. IEEE.
Soyka, F., Giordano, P. R., Beykirch, K., and B
¨
ulthoff,
H. H. (2011). Predicting direction detection thresh-
olds for arbitrary translational acceleration profiles in
the horizontal plane. Experimental brain research,
209(1):95–107.
Sun, W., Shao, S., Zhao, R., Yan, R., Zhang, X., and Chen,
X. (2016). A sparse auto-encoder-based deep neural
network approach for induction motor faults classifi-
cation. Measurement, 89:171–178.
Vincent, P., Larochelle, H., Bengio, Y., and Manzagol, P.-
A. (2008). Extracting and composing robust features
with denoising autoencoders. In Proceedings of the
25th international conference on Machine learning,
pages 1096–1103. ACM.
Wang, X., Wu, S., and Wang, K. (2015). A run-to-run
profile control algorithm for improving the flatness of
nano-scale products. IEEE Transactions on Automa-
tion Science and Engineering, 12(1):192–203.
Xia, M., Li, T., Xu, L., Liu, L., and de Silva, C. W.
(2018). Fault diagnosis for rotating machinery us-
ing multiple sensors and convolutional neural net-
works. IEEE/ASME Transactions on Mechatronics,
23(1):101–110.
Yang, Z.-X. and Zhang, P.-B. (2016). Elm meets rae-elm:
A hybrid intelligent model for multiple fault diagnosis
and remaining useful life predication of rotating ma-
chinery. In Neural Networks (IJCNN), 2016 Interna-
tional Joint Conference on, pages 2321–2328. IEEE.
SIGMAP 2019 - 16th International Conference on Signal Processing and Multimedia Applications
320
