
Mini-term 4.0. A Real-time Maintenance Support System to
Prognosticate Breakdowns in Production Lines
E. Garcia
1 a
and N. Montes
2 b
1
Ford Spain, Poligono Industrial Ford S/N, CP 46440, Almussafes, Valencia, Spain
2
Department of Mathematics, Physics and Technological Sciences, University CEU Cardenal Herrera,
C/ San Bartolome 55, Alfara del Patriarca, Valencia, Spain
Keywords:
Mini-term, Breakdown, Mini-term 4.0, Prognosis, Maintenance Support Systems (MSS).
Abstract:
This paper presents a Real-time Maintenance Support System (MSS) to prognosticate breakdowns in pro-
duction lines. The system is based on the sub-cycle time monitoring, mini-terms, and how the sub-cycle
time variability can be used as a deterioration indicator that could describe the dynamic of the failure for the
machine parts. A Real-time MSS has been installed at Ford factory located in Almussafes (Valencia), the
so-called Mini-term 4.0. At present, three plants, Body 1,2 and 3 have hundreds of mini-terms sensed by the
system. The connected production line elements are the welding guns, elevators, screwdriver and scissor ta-
bles. Mini-term 4.0 uses the well-known k-means algorithm to detect change points. The K-means constructs
two groups and, when centroid values differ more than 7 % (orange alert), or 18 % (red alert), an e-mail is
sent to maintenance team to schedule the maintenance task. Some examples of the different change point
topologies detected are shown at the end of the paper.
1 INTRODUCTION
A production line is composed of a set of sequential
operations established in a factory whereby materials
are put through a refining process to produce an end-
product.
During the lifespan of the line, which could be
decades, the throughput depends on an amount of pa-
rameters like, maintenance policy, downtime events,
machine breakdowns, deteriorating systems, dynamic
bottleneck behavior, bowl phenomenon, market de-
mand, etc. There are open questions to be resolved
that are not treated in literature in depth, which pro-
duces an enormous gap between academic theory and
real plant problems. This gave rise to active research
topic, where maintenance and replacement problems
of deteriorating systems are some of them.
Maintenance operations have a direct influence on
production performance in manufacturing systems.
Maintenance task prioritization is crucial and impor-
tant, especially when availability of maintenance re-
sources is limited. Generally, maintenance can be
categorized into two major types: corrective mainte-
a
https://orcid.org/0000-0002-4210-9835
b
https://orcid.org/0000-0002-0661-3479
nance (CM) and preventative maintenance (PM). CM
is performed when a machine fails. It usually involves
replacing or repairing the component that is responsi-
ble for the failure of the overall system. However, PM
is performed before machine failure. The objective of
PM is to achieve continuous system production. In
condition-based maintenance framework, a deteriora-
tion indicator that correctly describes the dynamic of
the failure process is required. Usually, this efficient
indicator can be constructed from collected informa-
tion on various deterioration-related monitoring pa-
rameters such as vibration, temperature, noise levels,
etc. However, the need of continuous monitoring may
increase the system costs when expensive monitoring
devices are required (A. K. S. Jardine et al., 2006).
In fact, that is the main drawback in PM when using
these techniques.
Over the last two decades, numerous prognos-
tic approaches have been developed. Prognostic is
a major scientific challenge for industrial implemen-
tation of maintenance strategies in which the RUL
(Remaining Useful Life) estimation is an important
task. For environmental, economic and operational
purposes, the prognostic and the remaining useful
lifetime prediction arouse a big interest. In the frame-
work of prognostic and health management (PHM),
180
Garcia, E. and Montes, N.
Mini-term 4.0. A Real-time Maintenance Support System to Prognosticate Breakdowns in Production Lines.
DOI: 10.5220/0007808801800187
In Proceedings of the 16th International Conference on Informatics in Control, Automation and Robotics (ICINCO 2019), pages 180-187
ISBN: 978-989-758-380-3
Copyright
c
2019 by SCITEPRESS – Science and Technology Publications, Lda. All rights reserved
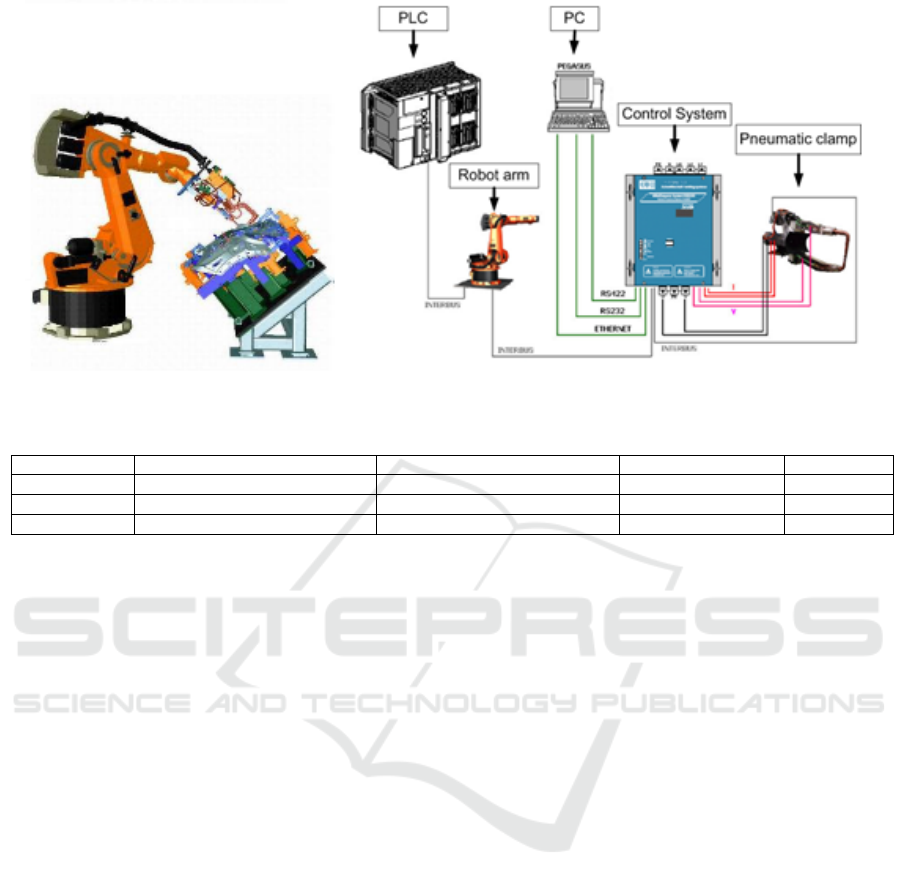
Figure 1: Welding station (Left). Experimental Setup (Right).
Table 1: Rules for the Knowledge-driven MSS. Welding station case.
mini-term mean rules variance rules variance threshold normality rule
Robot Motion µ
C
= µ
P1
= µ
P2
= µ
P3
= µ
P4
< µ
P5
S
2
C
= S
2
P1
= S
2
P3
= S
2
P5
< S
2
P2
< S
2
P4
s > 25.4 · 10
−3
− − −−
Welding Motion µ
C
= µ
P5
< µ
P1
< µ
P3
< µ
P2
< µ
P4
S
2
C
= S
2
P1
= S
2
P3
= S
2
P5
< S
2
P2
< S
2
P4
s 3 [47 · 10
−4
74 · 10
−4
] P4 f ail
Welding task µ
P2
< µ
P4
< µ
C
= µ
P3
< µ
P5
< µ
P1
S
2
C
= S
2
P3
= S
2
P5
< S
2
P2
= S
2
P4
< S
2
P1
s > 12.9 · 10
−3
P1 f ail
we find many prognostic techniques which are basi-
cally classified into three principal types: data-driven
approaches, model-based approaches and experience-
based approaches. These can also be classified in two
groups, non-probabilistic methods and probabilistic
methods, see (K. L. Son, 2013). In non-probabilistic
methods the deterioration phenomenon is not ran-
dom and in most observations the deterioration can
be fuzzy. With probabilistic methods, the deteriora-
tion phenomenon is considered to be random and with
stochastic tools it is considered a random behavior. In
this case the prognostic is based on the future behav-
ior of the stochastic deterioration process and can give
results in terms of probabilities, see (K. L. Son, 2013).
2 PREVIOUS WORKS
2.1 From the Micro-term to the
Long-term
The literature classifies the data used in the analysis
of the manufacturing process into two types, the long-
term data (long-terms) and the short-term data (short-
terms). Long-term data are used mainly for pro-
cess planning while short-term data are used mainly
for process control. There is abundant literature that
works with the analysis of long-term times, in com-
parison with the literature that uses short-term times.
Following the definition of (L. Li et al., 2009), the
short-term data refer to a time not long enough for the
failure period of the machine and where the cycle time
of the machine is considered short-term time. In (E.
Garcia, 2016) the short term is redefined in two new
terms, the mini-term and the micro-term. A mini-term
can be defined as the time that a part of the machine
needs to perform their own task. These miniterm sub-
division can be selected based on a policy of preven-
tive maintenance or in a breakdown, in which it could
be replaced in an easy and faster way than another
sub-divided part of the machine. Also a mini-term
could be defined as a sub-division that allows us to
understand and study the machine behavior. In the
same way, a micro-term is defined as the time that
each part of the mini-term in which could be divided
itself, see Fig. 2. This model has been published in
(E. Garcia and N. Montes, 2017).
2.2 Mini-term for Breakdown
Prognosis. Pre-test
The mini-term, by definition, is a sub-cycle time and
had only been used to improve production. In our
previous work, (E. Garcia et al., 2018), a test was
developed in an isolated welding station, see Fig. 1
(left). The welding unit was divided into three mini-
terms, the robot arm, the welding movement and the
welding action. Fig. 1 (right) shows the experimen-
tal setup to measure the cycle time of each mini-term
in the welding station, where the PLC and the PC are
Mini-term 4.0. A Real-time Maintenance Support System to Prognosticate Breakdowns in Production Lines
181
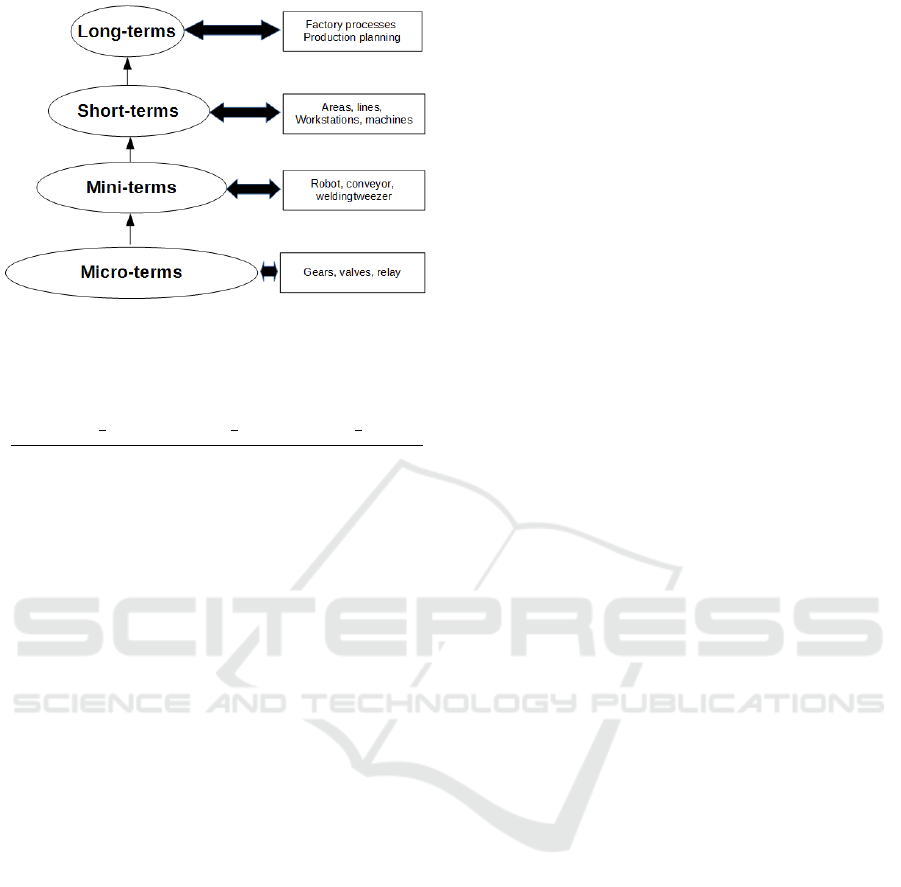
Figure 2: From Micro-term to Long-term.
Table 2: Measurements of the Experimental Test for each
mini-term and pathology.
Robot Movement Clamp movement Welding clamp
(x, S) (x, S) (x, S)
C 35.5497;0.0215 0.4158;0.0061 1.4373;0.0109
P
1
35.5472;0.0336 0.4302;0.0060 4.0523;0.1585
P
2
35.5496;0.0257 1.4087;0.0488 1.1391;0.0783
P
3
35.5492;0.0361 0.4643;0.0070 1.4389;0.0119
P
4
35.5485;0.0302 1.5594;0.0489 1.2945;0.0665
P
5
46.3314;0.0314 0.4185;0.0060 1.4489;0.0110
used to measure time. To carry out this study, compo-
nents with an advanced lifetime were selected. These
components are in normal production where nobody
notices a failure in their behavior. These pathologies
are: the failure of the proportional valve, the cylin-
der stiffness, loss of insulation in the welding trans-
former, loss of pneumatic pressure and loss of robot
speed. Table 2 shows the measurements of experi-
mental results for each mini-term and for each one
of the pathologies. C are the measurements without
pathology and P
1
,P
2
,P
3
,P
4
,P
5
are the measurements
obtained for each of the pathologies analyzed.
In our previous work, (E. Garcia et al., 2018),
the experimental samples were analyzed to under-
stand how the pathologies affect the cycle time and to
generate rules that allow us to determine the pathol-
ogy. The statistical tests used in our previous work
were ANOVA, Shaphiro-Wilk, Tukey, Levene, χ
2
tests and variance contrast hypothesis. A summary
of the statistical rules obtained is shown in Table 1
where the first two columns show the rules that clas-
sify mean and variance values according to the pathol-
ogy. Column four shows threshold values to deter-
mine whether there are pathologies or not and the
last column shows extra rules like for instance, when
pathology 4 occurs, the data do not pass the normality
test.
By means of these rules, a Bayesian model that
mixes the gaussians was proposed in our previous
work, (M. Alacreu et al., 2018), to determine which
pathology occurs in real-time.
3 GOAL OF THE PAPER
Industry 4.0 is a current trend and data exchange
in manufacturing technologies. It includes cyber-
physical systems, the internet of things and cloud
computing creating what has been called a ”smart
factory”. Following this tendency, the ideal way for
maintenance prognosis would be to do it continuously
and automatically. However, as indicated in (R. Ah-
mad and S. Kamaruddini, 2012) it is very expensive
since many sensors and devices are needed to carry
it out. The most used sensors to perform the main-
tenance prognosis are: vibration, noise, temperature,
pressure, flow, etc. Fortunately, as we have explained
in (E. Garcia et al., 2018), when components have an
advanced lifetime, it affects the cycle time but with an
important advantage: the mini-term is easy and cheap
to be installed than other sensors. It is cheap because
no additional hardware installation is required to mea-
sure the sub-cycle time, just the use of the PLC and
sensors installed for the automated production pro-
cess, and it is easy because we only need to code extra
timers into the PLC.
The results presented in (E. Garcia et al., 2018)
generated a great expectation in Ford Motor Com-
pany, allowing us to analyze in depth the capabili-
ties of the mini-term for failure prognosis. Section 4
shows the setup to measure mini-terms at Ford plant in
Almussafes factory, the so-called Mini-term 4.0. The
system was switched on in April 2018 and began to
monitor thousands of mini-terms. Section 5 shows
a summary of the different kinds of pathologies that
through the mini-terms we have been able to detect
since the system was switched on. In section 6 we
can see the conclusions showing special emphasys on
future works.
4 MINI-TERM 4.0 DEFINITION
4.1 Machine Learning Techniques
Pattern recognition and machine learning can be
viewed as two facets of the same field and they only
depend on the field of application. The pattern recog-
nition term is mainly used in engineering meanwhile
the machine learning term is mainly used in computer
science problems. In any case, it can be defined as
a program or an algorithm that is capable of learn-
ing with minimum or no additional support (Webb
ICINCO 2019 - 16th International Conference on Informatics in Control, Automation and Robotics
182
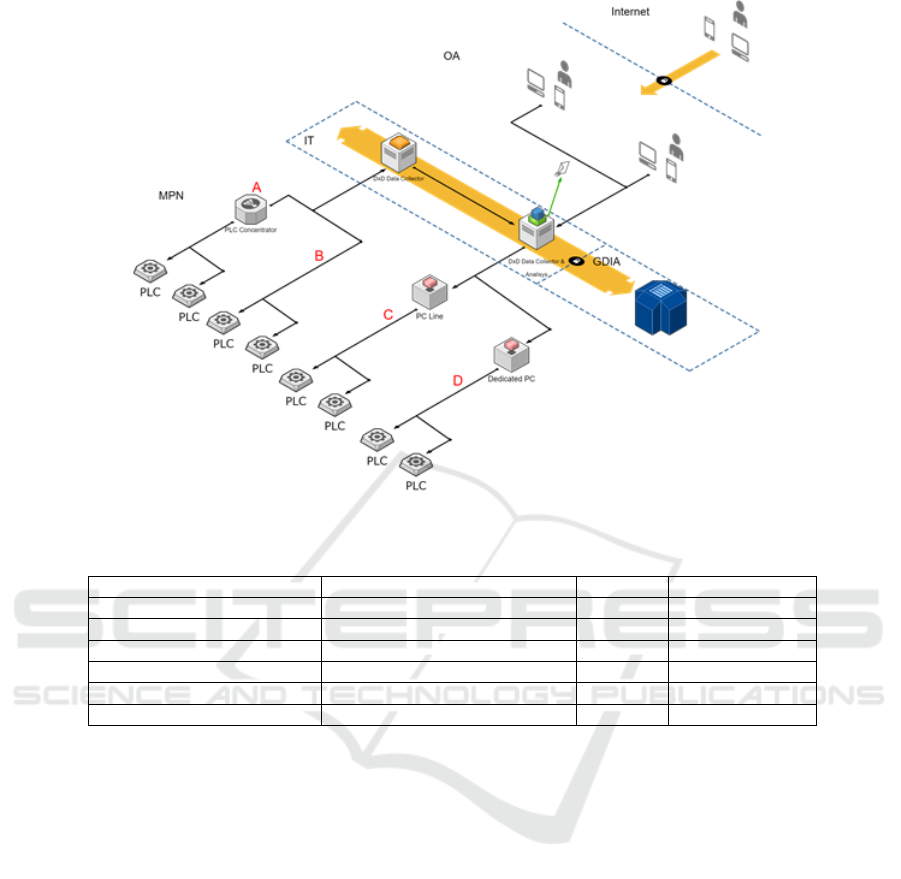
Figure 3: Architecture for Mini-term 4.0.Mini-terms in Real-time collected at Ford factories.
Table 3: Mini-terms monitored at Ford Almussafes (Valencia).
Mini-term Required sensors PLC code New HW or SW?
Pneumatic welding gun Time Limit sensor Timer NO
Elevators Time Limit sensor Timer NO
Cylinder Time Limit sensor and actuation valve Timer NO
Turn Table Time Limit sensor Timer NO
Scissors Table Time Limit sensor Timer NO
NutRunners Time Limit sensor Timer NO
and Copsey, 2011). In our previous works, (E. Gar-
cia et al., 2018), (M. Alacreu et al., 2018) it was
demonstrated that by means of machine learning tech-
niques, we were able to develop a real-time MSS for
failure prognosis that determined not only that some-
thing wrong occurred, but also which pathology has
occurred in the machine. Mini-term 4.0 has the chal-
lenge to generalize these preliminary results for what-
ever machine or element installed in a factory so a
machine learning process is implied. There are two
questions to be solved using machine learning tech-
niques and mini-terms in maintenance systems:
• What kind of pathology produces the change
point?
• How much time does the maintenance worker
have to replace it before breakdown?
Therefore, after defining the hardware architec-
ture to collect data, a learning process should be
switched on in 2 steps. First, a watchdog system
alerts the maintenance workers that some mini-term
has a pathology and secondly, after the damaged com-
ponent is replaced by the maintenance worder, the
pathology is saved into the Mini-term 4.0 to enrich
the learning process. Figure 5 shows a schema about
that.
4.2 Mini-term 4.0 Installation Setup
One of the main drawbacks for industry 4.0 is the cost
of introducing sensors into machines and how to in-
tegrate this with the system installed in the produc-
tion line. In big manufacturing industries like Ford,
there are a lot of memory and I/O restrictions for the
PLC. Everything is standardized with a lot of proto-
cols for all the plants around the world. Therefore, the
success of whatever industry 4.0 technique depends
mainly on the intrusiveness in the existing produc-
tion lines. In our particular case, the standardization
consists on reserving memory space for the mini-term
measurements in the Standard that Ford has in the
PLC Coding. Nowadays, we can measure the mini-
terms for whatever element that Ford has in its facto-
ries. In the same way, there is a hardware architecture
Mini-term 4.0. A Real-time Maintenance Support System to Prognosticate Breakdowns in Production Lines
183
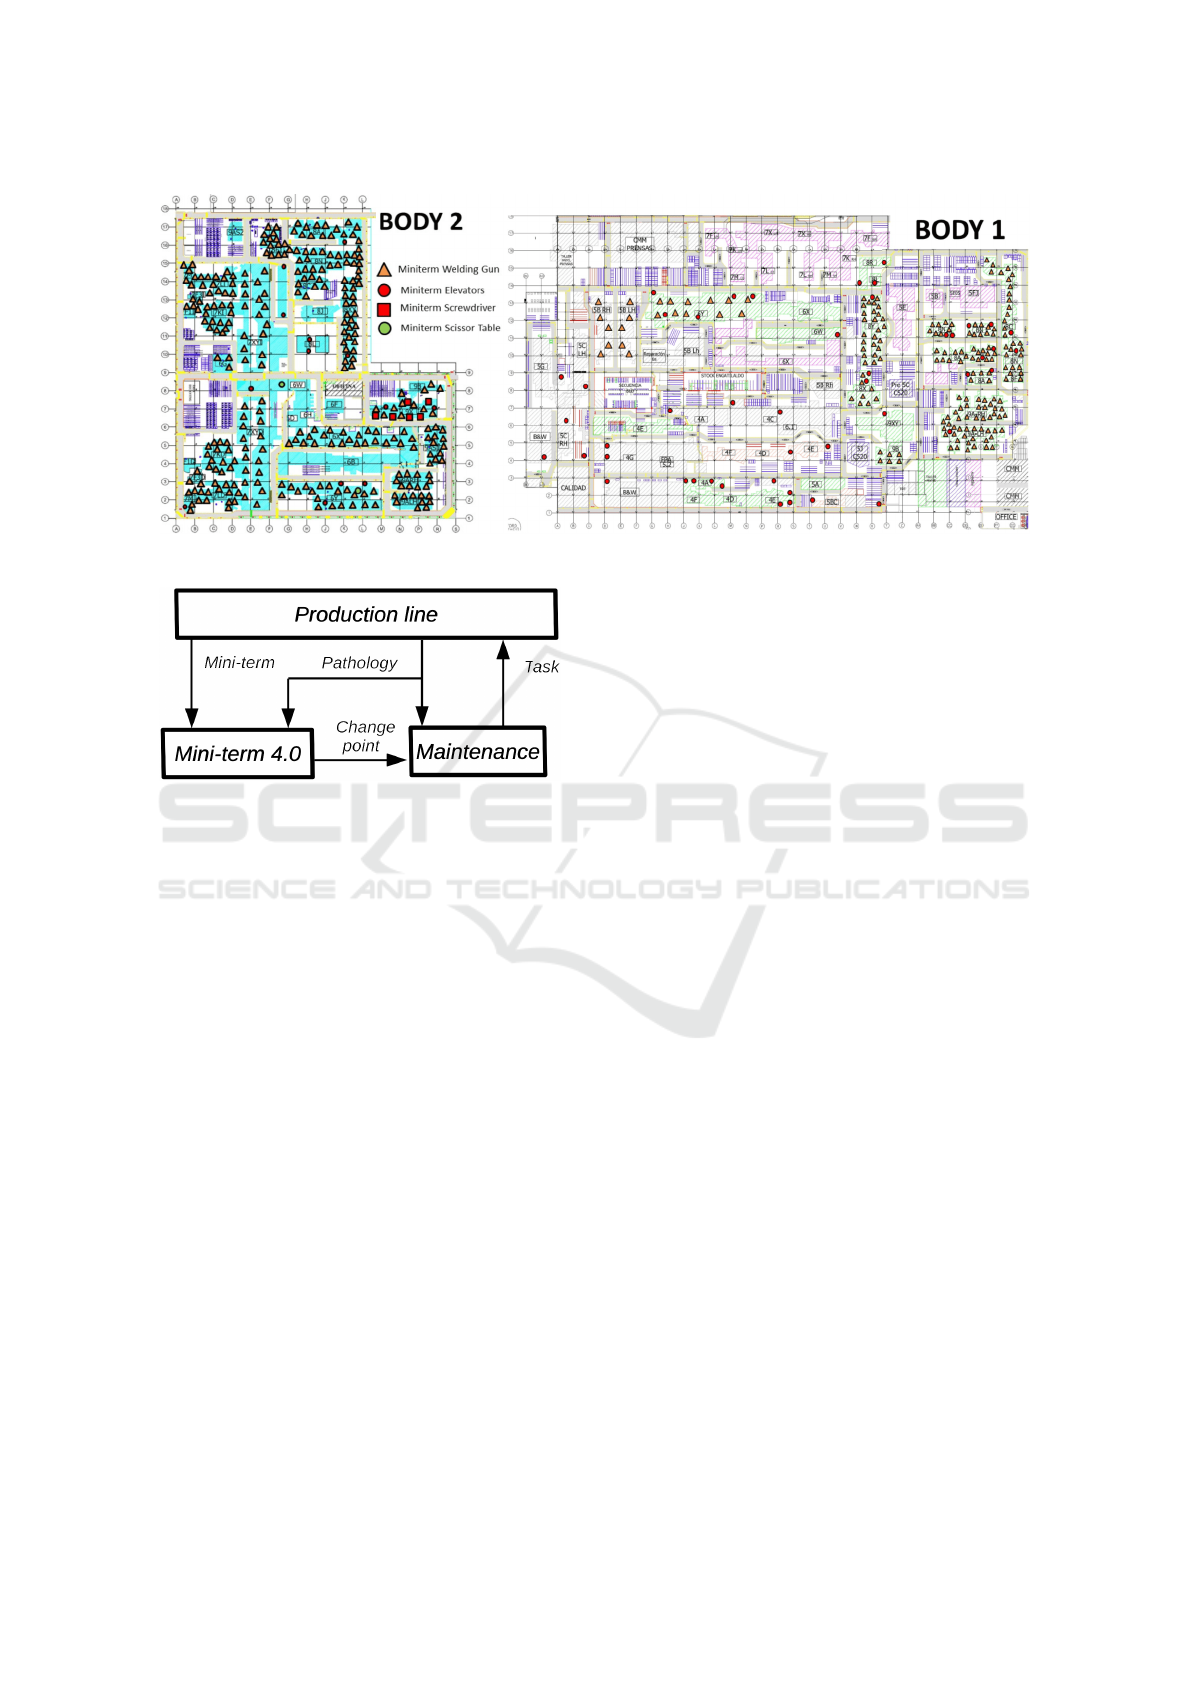
Figure 4: Mini-terms collected at Body1 and Body 2 plant.
Figure 5: Learning process for MSS based on mini-terms.
to collect data from the PLC that is used also to col-
lect mini-terms, see figure 3. In the first layer there
are PLCs that control the machines and measure mini-
terms. The second layer is an intermediate layer with
one single objective: connect the PLC with the third
layer, the Database collector. In this sense, there are
four possibilities, see figure 3;
• The PLC is connected directly with the Database
collector figure 3 (B),
• The PLC and the Database collector use a PLC
concentrator between them, figure 3 (B),
• A PC Line is used to extract the data from the
PLC, figure 3 (C),
• A dedicated PC extracts the Data, figure 3 (D)
In the third layer, Database collectors send the
data to a Database collector that is able also to an-
alyze the mini-terms and send messages to mainte-
nance workers. This database collector is connected
to the fourth layer, where the developers and the man-
agers of each plant can supervise and improve the sys-
tem. The last layer is the internet connection that al-
lows to connect different plants around the world as
well as to monitor the process out of the factory. The
whole system is well known as mini-term 4.0. Figure
6 shows the interface used in the third layer to monitor
and analyze the mini-terms where, in that particular
case is the welding motion mini-term.
4.3 Mini-term Degradation Path. A
Change Point
Prediction and analysis of degradation paths are im-
portant to condition-based maintenance (CBM). It is
well known that the degradation paths are non-linear.
It means that in the degradation path, a sudden change
point appears when the RUL (Remaining Useful Life)
is near the end, see (X. Zhao, 2018), (X. Zhao, 2014).
Before the change point, the component works in op-
timal conditions and after the change point the com-
ponent works in bad conditions announcing that the
failure is near, see Figure 7.
The change point in the physical part of the ma-
chine components produces a similar effect in the sub-
cycle time, that is, a change point in the mini-term,
Figure 8 shows examples measured at Ford Almus-
safes factory. These change points in the mini-terms
can be detected using common data analysis tech-
niques, see (X. Zhao, 2018), (X. Zhao, 2014). When
a change point in the mini-term is detected, an alarm
must be activated for the maintenance workers in or-
der to replace it, as soon as possible.
4.3.1 K-means for Change Point Detection
Change point detection techniques for time series are
a wide area of research where applications are nu-
merous and diverse; there are many different mod-
els and operational constraints (on precision, com-
plexity,...). In (S. Aminikhanghahi and D. J. Cook,
2017) the most relevant change point techniques are
analyzed and categorized in deep. In general, there
are two main groups: supervised and unsupervised
ICINCO 2019 - 16th International Conference on Informatics in Control, Automation and Robotics
184
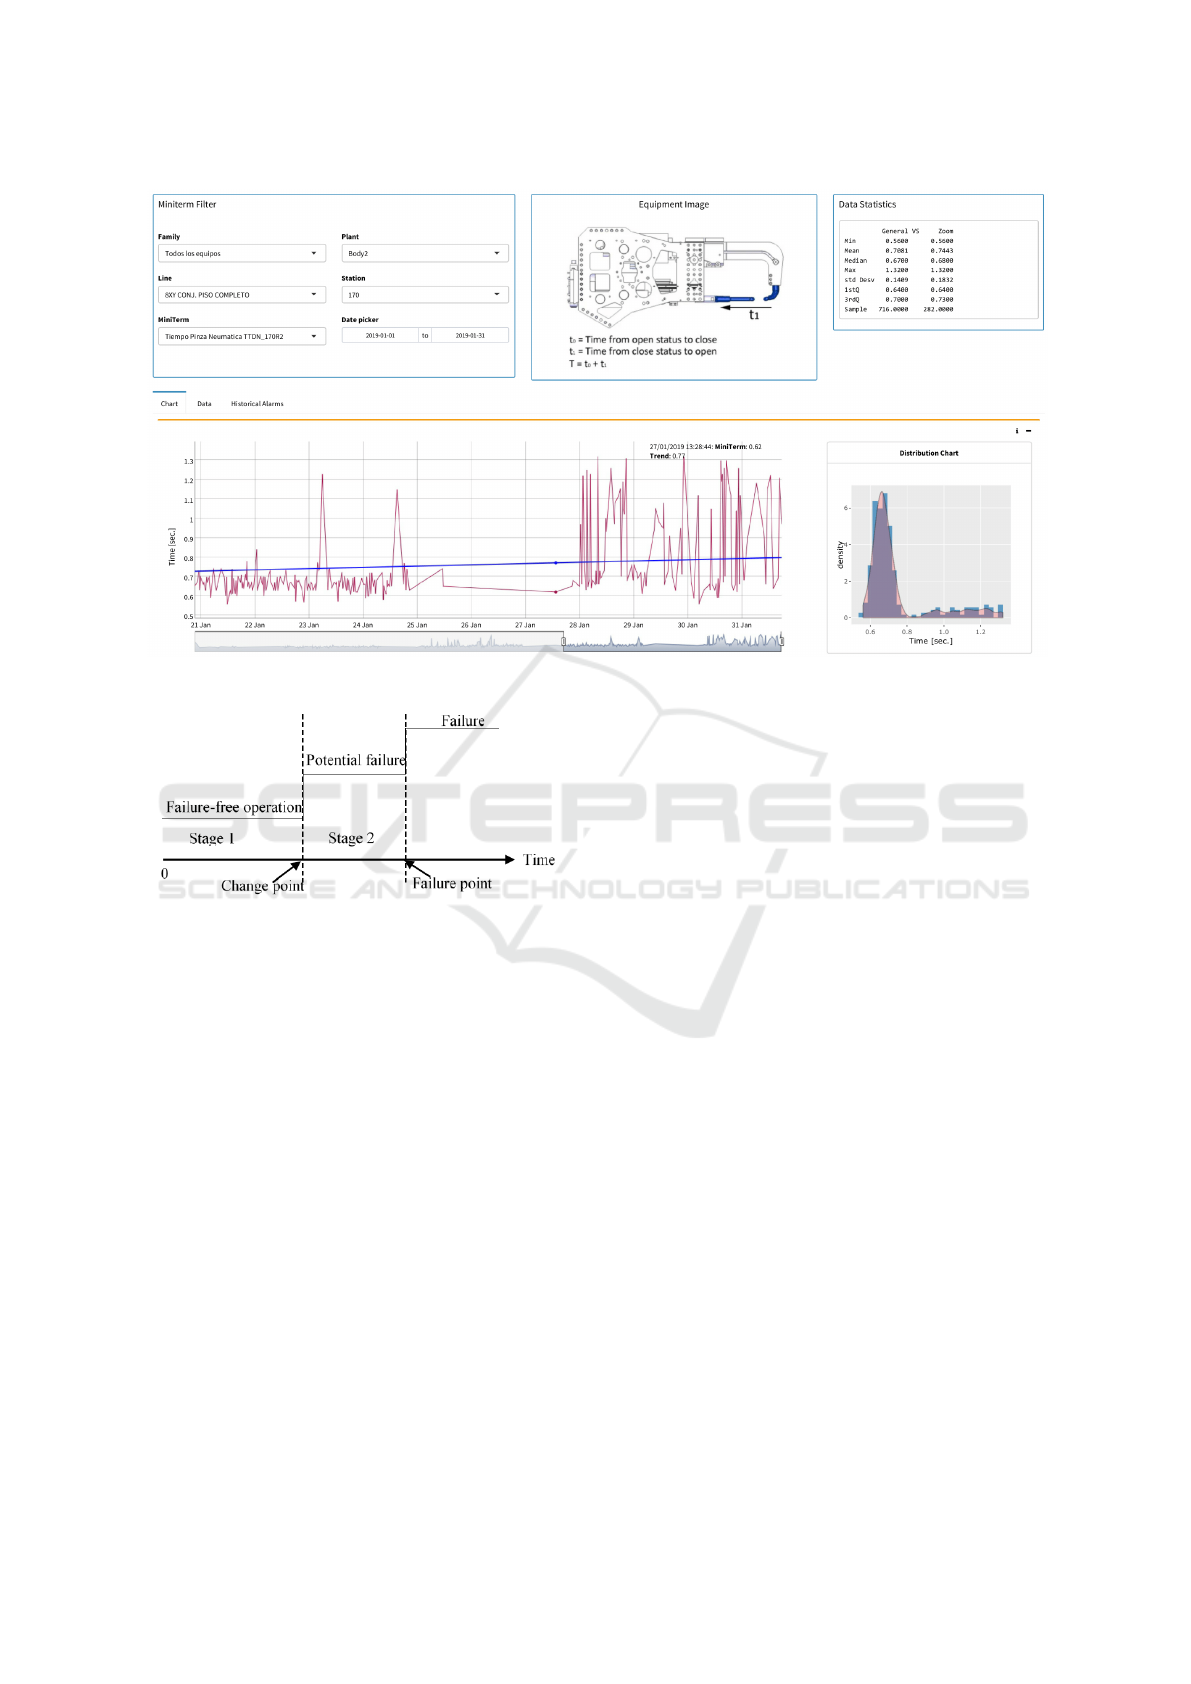
Figure 6: Interface to analyze the Mini-terms. A welding clamp motion Mini-term case.
Figure 7: Change point.
methods. Supervised learning algorithms are machine
learning algorithms that learn a mapping from input
data to a target attribute of the data, which is usually
a class label. Unsupervised learning algorithms are
typically used to discover patterns in unlabeled data.
In the context of change point detection, such algo-
rithms can be used to segment time series data, thus
finding change points based on statistical features of
the data. Unsupervised segmentation is attractive be-
cause it may handle a variety of different situations
without requiring prior training for each situation.
In the case of using mini-terms for failure progno-
sis, there is a huge variety of change points with os-
cillations, peaks, etc, depending on the pathology. In
addition to that, when the maintenance task is done,
the mini-terms value could be different than before
the change point but it does not mean necessarily that
themini-terms have a pathology. Figure 8 shows some
cases measured at Ford Almussafes factory. The first
case shows the lubricant deterioration in the welding
clamp and how, once lubricated correctly, its nominal
value is recovered. The second one is an internal leak
in the clamp cylinder. The third one is a mechanical
deterioration in a scissor table. The fourth one shows
the deterioration of a proportional valve controlling
the welding gun.
One of the unsupervised methods is the cluster-
ing method. The problem of change point detec-
tion can be considered as a clustering problem with
a known or unknown number of clusters, so obser-
vations within clusters are identically distributed, and
observations between adjacent clusters are not. One
of the most common algorithms, and the selected one
for the present paper, is k-means. The k-means clus-
tering algorithm uses iterative refinement to produce
a final result. The algorithm inputs are the number
of clusters k and the time series with n samples, from
time t to t-n. The algorithms start with initial esti-
mates for the k centroids, which can either be ran-
domly generated or randomly selected from the data
set. This algorithm is guaranteed to converge to a
result. In our particular case, k=2, meaning that K-
means have to construct two groups, with and without
pathology, and n are the samples collected for the last
9 days., that is, 7 days of production and 2 days for
a weekend. K-means always cluster the data into two
groups so, a threshold mean value is established in
two levels. When centroid values differ more than 7
%, an orange alert is activated and, when the centroid
values are more than 18 %, a red alert is activated.
Mini-term 4.0. A Real-time Maintenance Support System to Prognosticate Breakdowns in Production Lines
185
Figure 8: Example of mini-term pathologies detected using
mini-term 4.0.
5 REAL-TIME MINI-TERM MSS
AT FORD MOTOR COMPANY
The process to collect and analyze mini-terms started
a few months ago at Almussafes factory. At present,
three plants, Body 1,2 and 3 have hundreds of mini-
terms collected in the Mini-term 4.0. The components
analyzed are: the welding guns, elevators, screw-
driver and scissor tables. Table 3 shows the mini-
terms collected, the sensors used to measure the time
as well as if the measurement requires any additional
software and hardware installation. As we can see, the
mini-term measurement uses the sensors used for the
automated machine and a timer in the PLC. There-
fore, neither new hardware nor software need to be
installed.
Figure 4 shows layouts of the mini-terms located
at Body 1 and 2 plants in that moment. The type and
number of mini-terms are increasing continuously.
The systems analyze the mini-terms and send an
e-mail to the maintenance worker when a red alert is
activated in one of them. The maintenance worker
checks the component and acts if a failure is found.
Maintenance team reports the pathology detected to
the Mini-term 4.0. Until now, k-mean algorithm al-
lows to detect different kinds of change point topolo-
gies. Figure 9 shows some samples where red points
are the samples that switch on the red alarm. The first
Figure 9: Summary of different change point topologies de-
tected in the mini-term 4.0 using k-means.
example is the most common one, an abrupt change
point. The second one is a change point where the
change is smooth. The third one is a change point but
with oscillations and the fourth one is a change point
combining peaks and normal values.
As the mini-term 4.0 is not able to determine the
pathology at the moment, therefore the maintenance
team must guess the pathology based on its expe-
rience. If the pathology is not clear, maintenance
workers try to lubricate the machine first. Figure 10
shows the effect of lubrication on the mini-term when
the pathology is not due to lubrication. In the first
case, the mini-term was improved but the initial val-
ues were not recovered. In the second one, the initial
values were recovered but some days after, the pathol-
ogy appeared again noticing that the action that had
been done during the weekend would only hide the
real pathology.
ICINCO 2019 - 16th International Conference on Informatics in Control, Automation and Robotics
186

Figure 10: Maintenance trial and error process.
6 CONCLUSIONS AND FUTURE
WORKS
This paper shows a real-time Maintenance Support
System (MSS) to prognosticate breakdowns in pro-
duction lines. The system is based on the sub-cycle
time (mini-terms) monitoring where, a k-means al-
gorithm is used to detect change points. The real-
time system is called Mini-term 4.0. It started to de-
tect anomalies in machines a few months ago at Al-
mussafes factory (Valencia). At present, three plants,
Body 1,2 and 3 have hundreds of mini-terms sensed
by this system. The system is able to detect many
kinds of pathologies like for instance, lubricant de-
terioration in the welding clamp, internal leak in the
clamp cylinder, mechanical deterioration in a scis-
sor table, the deterioration of a proportional valve,
etc. When the change point is detected, Mini-term 4.0
sends an e-mail to the maintenance team warning that
something wrong is happening. The system allows to
prognosticate the breakdown before it occurs.
Although the system produces a great improve-
ment which allows to avoid breakdowns, Mini-term
4.0 is now in a learning process phase in which the
information about the pathologies as well as the time
series are stored to learn. The system detects change
points and sends an e-mail to the maintenance work-
ers. They repair the machine and report the pathology
detected to the system, increasing its knowledge.
There are still some questions to be solved regard-
ing the use of mini-terms in MSS,
• What kind of pathology produces the change
point?
• How does it affect the production rate?
• How much time does the maintenance worker
have to replace it before breakdown?
Answer these questions will be the focus for our fu-
ture works.
ACKNOWLEDGEMENTS
The authors wish to thank Ford Espa
˜
na S.L. and in
particular the Almussafes Factory for the support in
the present research.
REFERENCES
A. K. S. Jardine, D. Lin, and D. Banjevic (2006). A review
on machinery diagnostics and prognostics implement-
ing condition-based maintenance. . Mechanical Sys-
tems and Signals processing, 20(7):1483–1510.
E. Garcia (2016). An
´
alisis de los sub-tiempos de ciclo
t
´
ecnico para la mejora del rendimiento de las l
´
ıneas
de fabricaci
´
on. PhD.
E. Garcia and N. Montes (2017). A tensor model for au-
tomated production lines based on probabilistic sub-
cycle times. Nova Science Publishers, 18(1):221–234.
E. Garcia, N. Montes, and M. Alacreu (2018). Towards
a knowledge-driven maintenance support system for
manufacturing lines. International COnefrence on In-
formatics in Control, Automation and Robotics, pages
499–511.
K. L. Son (2013). Remaining useful life estimation based on
stochastic deterioration models: A comparative study.
Reliability Engineering and System Safety, 112:165–
175.
L. Li, Q. Chang, and J. Ni. (2009). Real time production im-
provement through bottleneck control. International
Journal of production research, 47(21):6145–6158.
M. Alacreu, N. Montes, E. Garcia, and A. Falco (2018). A
pattern recognition bayesian model for the appearence
of pathologies in automated systems. Mathematical
modelling in engineering & human behaviour, pages
213–218.
R. Ahmad and S. Kamaruddini (2012). An overview of
time-based and condition-based maintenance in in-
dustrial application. Computers & industrial engi-
neering, pages 135–149.
S. Aminikhanghahi and D. J. Cook (2017). A survey
of methods for time series change point detection.
Knowledge and Information Systems, 51-2:339–367.
Webb, A. and Copsey, K. (2011). Statistical pattern Recog-
nition. Wiley, New York, 3nd edition.
X. Zhao (2014). Localized structural damage detection: A
change point analysis. Computer-Aided Civil and In-
frastructure Engineering, 29:416–432.
X. Zhao (2018). Optimal replacement policies for a shock
model with a change point. Computers & Industrial
Engineering, 118:383–393.
Mini-term 4.0. A Real-time Maintenance Support System to Prognosticate Breakdowns in Production Lines
187
