
A MEG Study of Different Motor Imagery Modes in Untrained Subjects
for BCI Applications
Alexander E. Hramov
1 a
, Elena N. Pitsik
1 b
, Parth Chholak
2
, Vladimir A. Maksimenko
1 c
,
Nikita S. Frolov
1 d
, Semen A. Kurkin
1 e
and Alexander N. Pisarchik
1,2 f
1
Neuroscience and Cognitive Technology Laboratory, Innopolis University, 1 Universitetskaya str., Innopolis, 420500,
The Republic of Tatarstan, Russia
2
Center for Biomedical Technology, Technical University of Madrid, Campus Montegancedo, 28223 Pozuelo de Alarc
´
on,
Madrid, Spain
Keywords:
Brain-computer Interface, MEG, Motor Imagery, Exoskeleton, HCA, Artificial Neural Network, Wavelet
Analysis.
Abstract:
Motor imagery is a most commonly studied neurophysiological pattern that is used in brain-computer inter-
faces as a command for exoskeletons, bioprostheses, wheelchair and other robotic devices. The mechanisms
of motor imagery manifestation in human brain activity include dynamics of motor-related frequency bands
in various brain areas, among which the most common is sensorimotor rhythnm. In present work we con-
sider time-frequency structure of magnitoencephalographical (MEG) motor imagery in untrained subjects.
We conduct series of experiments to collect MEG motor imagery dataset in untrained subjects. We confirm
the emergence of two types of motor imagery – visual (VI) and kinesthetic (KI), which cause different types
of event-related potentials (ERP) dynamics and require different approaches to classification using mashine
learning methods. We also reveal the impact of dataset optimization on the artificial neural network perfor-
mance, which is essential topic in brain-computer interface (BCI) development. We show that developing
classification stratedy based on time-frequency features of the particular MEG signal can increase classifica-
tion accuracy of the VI mode to the level of the KI.
1 INTRODUCTION
Known brain-computer interfaces (BCIs) applications
under study include: mental control of robotic de-
vices such as exoskeletons and prostheses for peo-
ple with motor disabilities, which allows to perform
basic tasks such as relocation in a wheelchair, limbs
movement etc. (Mirza et al., 2015); real-time recog-
nition of cognitive activity, i.e. emotions, alertness
and concentration (Victorino et al., 2015), which is
widely used in support systems for education and pro-
fessional skills training; neurofeedback for rehabilita-
tion based on motor imagery (Yu et al., 2015). The
focus of this study is active BCIs, which provide feed-
back to the user based on the brain activity measure-
a
https://orcid.org/0000-0003-2787-2530
b
https://orcid.org/0000-0003-1850-2394
c
https://orcid.org/0000-0002-4632-6896
d
https://orcid.org/0000-0002-2788-1907
e
https://orcid.org/0000-0002-3438-5717
f
https://orcid.org/0000-0003-2471-2507
ments and feature extraction in order to alter this ac-
tivity in the ”right direction” (Nijboer et al., 2009).
The most widely used pattern is motor imagery (MI)
for application in BCI for exoskeleton or robotic con-
trol (Frolov et al., 2017; Meng et al., 2016). Recog-
nition and classification of MI using artificial intelli-
gence methods is a challenging task, despite that some
of the features of this pattern are well-known.
Sensorimotor rhythm (SMR) is perhaps the most
common in the scientific literature in the context of
motor imagery application in BCI (McFarland and
Wolpaw, 2005; K
¨
ubler et al., 2005). SMR is an os-
cillatory idle rhythm of synchronized electromagnetic
brain activity. It appears in spindles in recordings
of EEG, MEG, and ECoG with the frequency range
of 7 − 13 Hz (Arroyo et al., 1993). SMR training
for BCI is widely employed technique for BCI-based
therapy, which often includes muscle stimulation or
exoskeleton control (Norman et al., 2018). Any mo-
tor action, including real movements, motor prepara-
tion and motor imagery, are resulting in changes in
188
Hramov, A., Pitsik, E., Chholak, P., Maksimenko, V., Frolov, N., Kurkin, S. and Pisarchik, A.
A MEG Study of Different Motor Imagery Modes in Untrained Subjects for BCI Applications.
DOI: 10.5220/0007810001880195
In Proceedings of the 16th International Conference on Informatics in Control, Automation and Robotics (ICINCO 2019), pages 188-195
ISBN: 978-989-758-380-3
Copyright
c
2019 by SCITEPRESS – Science and Technology Publications, Lda. All rights reserved

SMR dynamics: so-called event-related desynchro-
nization and synchronization (ERD/ERS). It is nec-
essary to emphasize that real motor action is not re-
quired for changes in the SMR amplitude (Yi et al.,
2016;
¨
Ozt
¨
urk and Yilmaz, 2018). The user of the BCI
can train to generate ERD or ERS in SMR (Penaloza
et al., 2018; Tacchino et al., 2017) in response for ex-
ternal stimulation, which can be biological feedback
integrated in BCI.
One of the most important problem which accom-
panies the development of SMR-based BCI is the
variability of the neural activity from one subject to
another(Ferreira et al., 2008; Ranky and Adamovich,
2010; Murphy et al., 2017). This variability is es-
pecially well pronounces in case of untrained sub-
jects, because such BCI user may try different ways
to perform MI without knowing which one of them
BCI will ”understand”. It is known that training can
partially resolve this issue (Duann and Chiou, 2016).
The other possible solution is to use additional in-
formation about the nature of the signals. Recently,
the practice of dividing MI modes on visual (VI) or
kinesthetic imagery (KI) has become widespread (La
Touche et al., 2018; Mehler et al., 2019a). These
two perspectives are significantly different and are
pronounced in neurophysiological activity in differ-
ent ways (Filgueiras et al., 2018): during the VI,
the subject imagines him/herself performing an ac-
tion from the from the third-person point of view, or
”looks throughout his/her own eyes” (Callow et al.,
2017). During the KI the subject imagines the feeling
and experience of movements without overt move-
ment (Mehler et al., 2019b; Hanakawa, 2016).
In present work, we consider time-frequency
structure of the MEG signal corresponding to these
two MI modes in untrained subjects. We evaluate
changes in event-related potentials amplitude in sen-
sorimotor rhythm, particularly focusing on µ− and
β−frequency bands, where ERD during motor activ-
ity emerges (Duann and Chiou, 2016; Maksimenko
et al., 2018). Then, we applied machine learning algo-
rithms to detect clusters among selected features and
then check how different frequency components af-
fect the artificial neural networks performance. The
results and observations focused in present paper pro-
vide the deeper insight into the VI and KI modes of
motor imagery and allow us to implement an optimal
classification approach for both groups of subjects.
2 METHODS
2.1 Experimental Setup and Data
Preparation
First, we performed series of experiments to collect
magnetoencephalographical (MEG) MI dataset in un-
trained subjects. All experimental work was con-
ducted using the equipment of the Laboratory of Cog-
nitive and Computational Neuroscience (CTB, Tech-
nical University of Madrid, Spain). Seven volunteers
in age of 20–31 participated in the experimental study.
During the experimental sessions, participants were
sitting in the chair in the comfortable posture, which
allows to minimize any motor activity throughout the
experiment. A screen was installed in front of the
chair, which is used to transmit commands at each
stage of the experiment. To divide one trial from an-
other, audio signals were tuned on at random intervals
of 6-8 seconds.
The whole experimental session consisted of four
parts, each part included equal number of left or right
arm motor imagery tasks. Each part was preceded by
the announcement on the screen in front of the sub-
ject, and short audio signals was informing subjects
about the trial start.
306-channel (204 planar gradiometers and 102
magnetometers) MEG-recordings with sampling fre-
quency 1000 Hz was collected using Vectorview
MEG system (Elekta AB, Stockholm, Sweden). An
online anti-alias filter with cutoffs between 0.1 Hz
and 300 Hz was applied. Further preparations of the
data was conducted using Brainstorm application for
MATLAB and included selection of 5-seconds trials
corresponding to each motor imagery task and 20-
seconds fragments corresponding to the resting state
with closed eyes according to the experimental proto-
col.
2.2 Time-frequency Wavelet-based
Analysis
We used wavelet-based approach to perform time-
frequency analysis of obtained data. For each MEG-
channel X
n
(t) the wavelet energy spectrum was calcu-
lated:
E
n
( f ,t) =
q
W
n
( f ,t)
2
) (1)
where W
n
( f ,t):
W
n
( f ,t) =
p
f
t−
4
f
Z
t+
4
f
X
n
(t)ψ
∗
( f ,t)dt, (2)
A MEG Study of Different Motor Imagery Modes in Untrained Subjects for BCI Applications
189
is complex-valued wavelet coefficients with MEG
channel number n = 1,...,102, ∗ standing for complex
conjugation and ψ( f ,t) is a mother wavelet function,
which in our case is the Morlet wavelet with central
frequency ω
0
= 2π, f
0
= 2π:
ψ( f ,t) =
p
f π
1/4
e
jω
0
f (t−t
0
)
e
f (t−t
0
)
2
/2
, (3)
Morlet wavelet is often used in medicine for
analysis of neurological data and a heartbeat be-
haviour (Morlet et al., 1993).
Since we considering ERP in the context of mo-
tor imagery, we calculated values of wavelet energy
E
n
µ
(t) and E
n
β
(t) for each channel n in frequency bands
β (8–13 Hz), and µ (15–30 Hz), where ERD and ERS
are well-known to be observed during both real and
imagery motor activity:
E
n
µ,β
(t) =
1
∆ f
Z
f ∈µ,β
E
n
( f ,t)d f . (4)
0
20 40
-20
-40
0
-20
-40
-60
20
40
60
80
4
5
1
7
2
3
6
∆β, %
∆μ,%
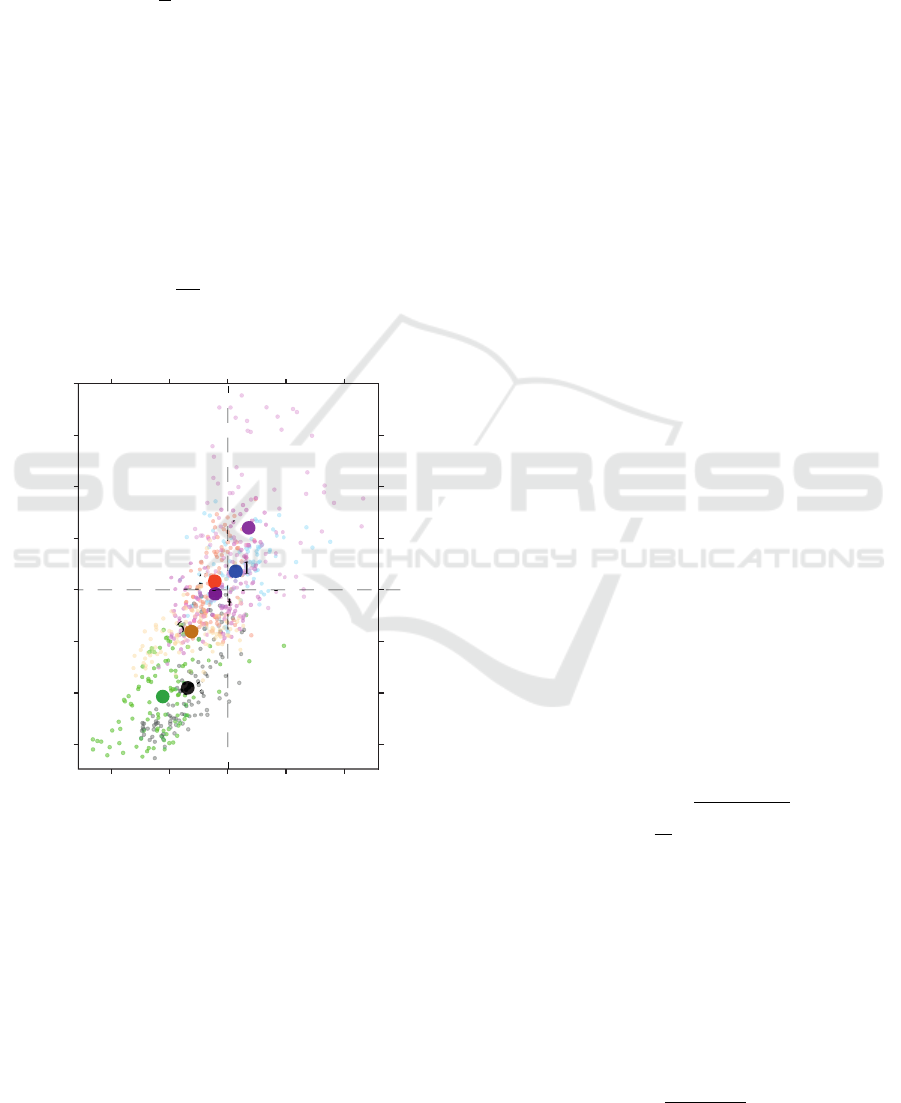
Figure 1: MI wavelet energy differences for each of 7 sub-
jects.
The values of ERP for each type of trial, i.e. left
hand (L
n
µ
(t) and L
n
β
(t)), right hand (R
n
µ
(t) and R
n
β
(t))
and resting state (B
n
µ
(t) and B
n
β
(t)), were values of
wavelet energies E
n
µ
(t) and E
n
β
(t) averaged over the
trials.
ERD and ERS corresponding to the right and left
hand MI were calculated as integral differences δL
n
µ
,
δL
n
β
and δR
n
µ
, δR
n
β
between MI trials and the resting
state:
δL
n
µ,β
=
Z
t∈T
L
n
µ,β
(t) − B
n
µ,β
(t)
dt, (5)
δR
n
µ,β
=
Z
t∈T
R
n
µ,β
(t) − B
n
µ,β
(t)
dt, (6)
with T = 3 s standing for the trial length.
2.3 Hierarchical Cluster Analysis
(HCA)
One of the goals of this article is to reveal two groups
of the subjects corresponding to the different types of
motor imagery – VI and KI. We used the hierarchi-
cal cluster analysis (HCA), which is a machine learn-
ing method that measures the dissimilarity between
objects and unites objects into distinct subgroups, or
clusters. There are two main types of HCA: ag-
glomerative, which initially considers each element
as single-element cluster and combines it with other
elements into the bigger clusters, until all elements
became members of a cluster, and divisive hierar-
chical clustering, which is an inverse version of ag-
glomerative clustering. We applied complete-linkage
clustering (Defays, 1977), which is the agglomerative
clustering method that results in a dendrogram that
can give an insight into the clusters hierarchy. This
method is also known as a farthest neighbour clus-
tering (Fraley and Raftery, 1998), and the link be-
tween two clusters is also considered as a farthest dis-
tance between two objects in an M-dimensional fea-
ture space with M features describing, in our case, the
motor imagery trial of the subject. We calculated the
complete-linkage function as:
D(X,Y ) = max
x∈X,y∈Y
d(x,y), (7)
where x and y are objects in considered clusters X and
Y , respectively, and d(x,y) is the distance between
two objects in a feature space calculated using Eu-
clidean metric:
d(x,y) =
1
M
s
M
∑
i=1
(x
i
− y
i
)
2
, (8)
where x
i
and y
i
are an i-th feature of the x and y ob-
jects, respectively.
In present paper, we consider the differences δL
n
µ,β
and δR
n
µ,β
described in previous subsection as features
of the MI. We introduced the pair (∆
µ
, ∆
β
), a two-
dimensional space, objects in which describe MI type
of all subjects. Here, ∆
µ,β
are the wavelet energy dif-
ferences averaged over the hand type:
∆
n
µ
=
δL
n
µ
+ δR
n
µ
2
, (9)
ICINCO 2019 - 16th International Conference on Informatics in Control, Automation and Robotics
190
(a)
(b)
0
20
40
-20-40
0
-20
-40
-60
20
40
60
80
4
5
1
7
2
3
6
∆β, %
∆μ,%
0
20 40-20
-40
0
-20
-40
-60
20
40
60
80
VI
KI
∆β, %
∆μ,%
Figure 2: Results of subject clustering to two groups according to the MI type using HCA.
∆
n
β
=
δL
n
β
+ δR
n
β
2
. (10)
Finally, due to the high-dimensionality of consid-
ering feature space (204 for each limb in case with
N = 102 MEG channels), we averaged ∆
n
µ,β
over the
channels:
∆
µ,β
=
1
N
N
∑
n=1
∆
n
µ,β
in order to reduce it.
2.4 Artificial Neural Network (ANN)
We used multilayer perceptron (MLP) as an artificial
intelligence algorithm to test classifiability of MEG
motor imagery pattern with different MI modes. MLP
employs feedforward structure with one input and one
output layers and several hidden layers. In our study,
we used MLP consisted of three hidden layers with
30, 15 and 5 neurons, one neuron on output layer and
the hyperbolic tangent sigmoid as an activation func-
tion. We applied the Levenberg-Marquardt algorithm
as an optimization method, which is a least-squares
estimation algorithm based on the idea of the maxi-
mum neighbourhood (
¨
Ubeyli, 2009).
Before the data was fed to the MLP input, it under-
went a series of necessary pre-processing. First of all,
data was filtered using a low-pass filter with various
cutoff frequency ranges. Then, we shuffled the data
and splitted it into the training and the test samples
that were 75% and 25% of the whole dataset, respec-
tively.
3 RESULTS
Fig. 1 represents the results of HCA, where each
dot represents the wavelet energy difference for each
MEG channel, each group of subjects has a different
colour and big dots are wavelet energy differences av-
eraged over all channels for each subject, represent-
ing individual wavelet characteristic of MI. Here, ∆
n
µ
and ∆
n
β
are the wavelet coefficients for correspond-
ing frequency bands µ and β, which reflect changes
in these frequency bands amplitudes associated with
motor imagery for each MEG-channel – in another
words, emergence of ERP. The vertical and horizon-
tal dashed lines corresponding to the zero values of
∆
n
β
and ∆
n
µ
, separating ERD and ERS for both of the
frequency bands.
Thus, all dots placed above the vertical line and to
the right from vertical line are representing the MEG
channels, where ERS is observed in µ and β- fre-
quency bands, respectively. On the other hand, the
negative values of ∆
n
β
and ∆
n
µ
are corresponding to
the decrease of ERP amplitude, or, in other words, to
ERD.
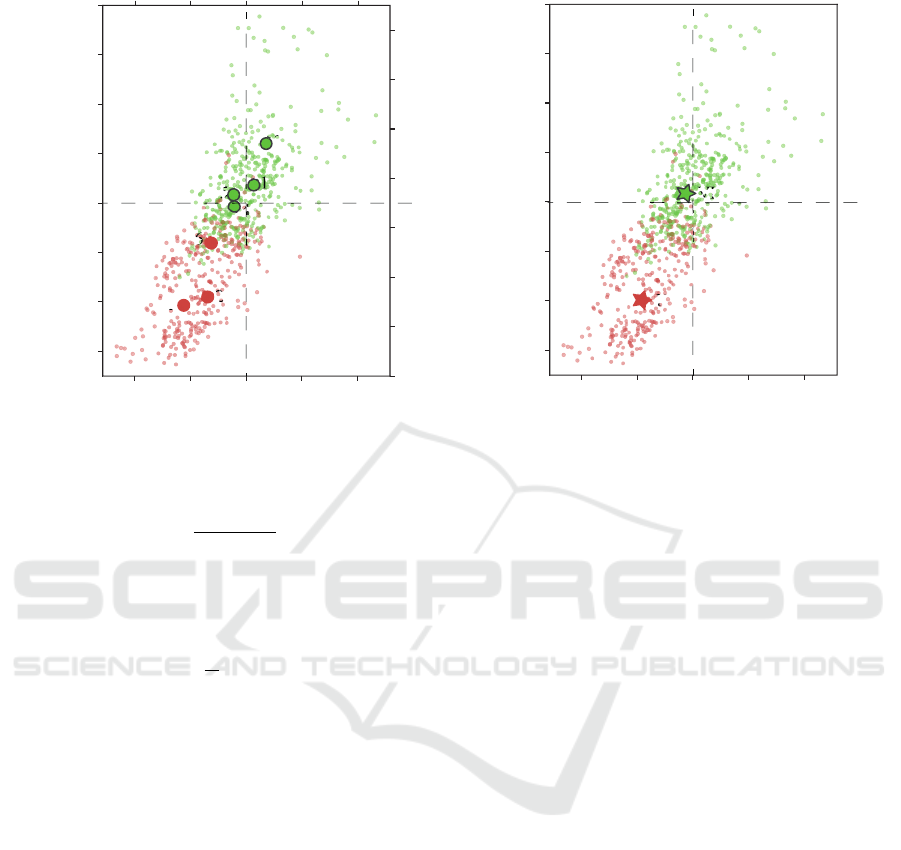
Fig. 2(a) shows the result of HCA clustering of in-
dividual MI characteristics of each subject (subjects
are represented as big numbered dots). Here we ob-
tained a quite good clustering, allowing us to distin-
guish two large groups of the subjects, corresponding
to the VI and KI, where three subjects belong to the
KI group (2, 3 and 6-th, red dots in Fig. 2(a)) and four
A MEG Study of Different Motor Imagery Modes in Untrained Subjects for BCI Applications
191
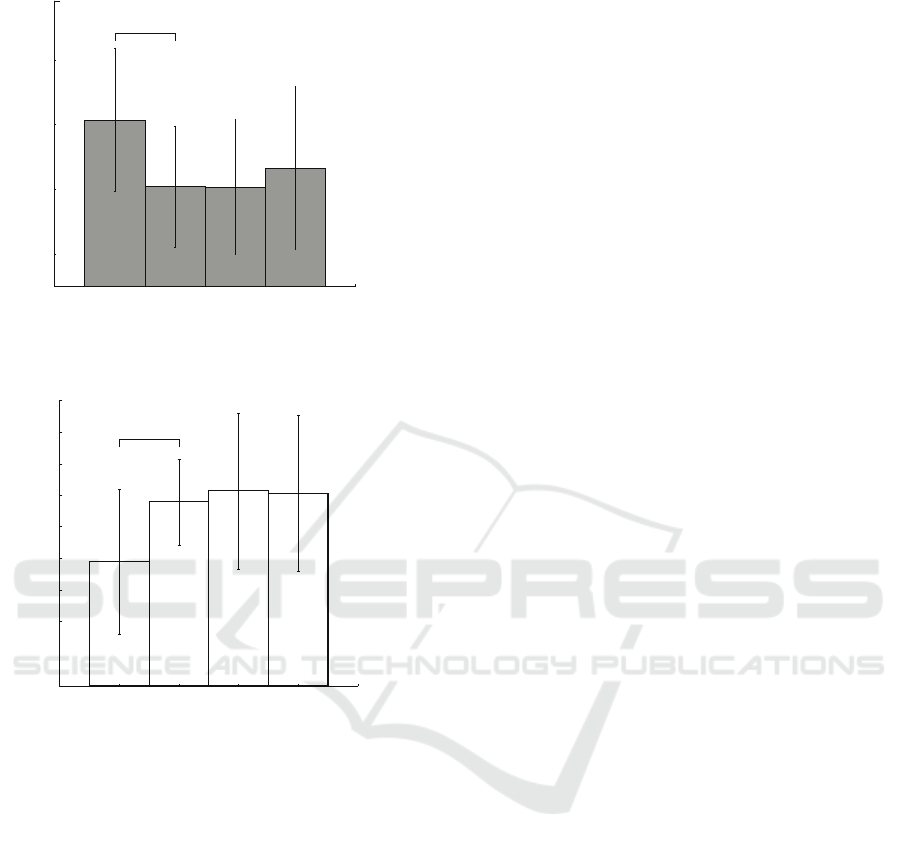
5-15 15-30 30-45 45-60
30
40
50
60
70
30
40
50
60
70
Accuracy, %
Accuracy, %
Cutoff frequency, Hz
5-15 15-30 30-45 45-60
Cutoff frequency, Hz
(a)
(b)
*
*
Figure 3: Results of MEG trials classification for (a) KI and
(b) VI groups of subjects. Results are presented with the
standard deviation.
– to the VI(1, 4, 5 and 7-th, green dots in Fig. 2(a)).
As it can be seen from Fig. 2(a), the KI group can be
described by decrease of both β and µ rhythms – red
dots are mostly placed to the left from the zero value
of ∆
n
β
and below the zero value of ∆
n
µ
. It is well-
known that ERD in these frequency bands is associ-
ated with motor activity, thus we can conclude that
subjects in this group were generating motor-related
activity during motor imagery.
The other picture is provided by the subjects from
VI group. As it was expected, VI is mostly associ-
ated with the slight or moderate enhancement of µ-
rhythm, which is a sign of visual processing or prepa-
ration for movement (Jones et al., 2010). The same
changes are observed in the β-band. Moreover, as
Fig. 2(b) shows, the subjects from the red group are
generally characterized by well-pronounced ERD in
both frequency bands, while the subjects from the
green group provided different type behaviour. This
close-to-ERS behaviour reflects the main difference
between two group of subjects – while the subjects
from the red group have a tendency to exercise, the
subjects from the green group are mostly prone to the
cognitive load.
The next stage of the research included classifi-
cation of MEG trials with an artificial neural network.
Here, we compare the results of the recognition in two
groups of subjects selected above and apply low-pass
filters with different cutoffs. Fig. 3 shows the results
of classification. We can see that using the same low-
pass filter results in opposite scenarios in these two
groups. For example, here we can see (Fig. 3(a)))
that filtering in range 5 − 15 Hz has the most pos-
itive effect on the classification accuracy in the VI
group. At the same time, the same filter causes signif-
icant decrease in the accuracy for the KI subjects (see
Fig. 3(b)). Other filter ranges cause sharp drop in clas-
sification quality, and then the accuracy does not rise
above 45% with increasing filtering cutoffs. Fig. 4
represents the analysis of individual accuracy rates,
which evidences that minimal classification accuracy
level is reached with [20,40] Hz filtration. These re-
sults suggest that low-frequency MEG components
are most important in classification of untrained sub-
jects MI, which a conclusion also previously made in
our earlier study (Maksimenko et al., 2018).
Fig. 3(b) provides another picture. As it was men-
tioned above, KI classification results are diametri-
cally opposed to the VI results. Here we can see that
the best results are achieved when high-frequency fil-
ters are applied. On the contrary, filter with cutoffs
5 − 15 Hz provides 44% accuracy with SD ±12%,
and the increase in the filtration cutoffs results in ac-
curacy increasing up to 55% ± 8 SD. The individ-
ual accuracy for the KI group continues to increase
though, reaching it’s maximal value at cutoffs [40,60]
Hz (red circles in Fig.4). Unlike the VI subjects,
the KI group produces more MI-related information
in the frequency components > 15 Hz. This results
can be an evidence that the subjects that prone to KI
produce the MI activity similar to preparation to the
movement execution.
One of the most topical problem of BCI develop-
ment is the data reduction or optimization. MEG data
consisted of 102 channel recordings is a large dataset,
which requires high computing power for it’s process-
ing. With the aim of dataset optimization we reduce
number of MEG channels and study the changes in
ANN performance. We chose 14 channels located
above the motor cortex. Fig. 5 presents results of our
ICINCO 2019 - 16th International Conference on Informatics in Control, Automation and Robotics
192
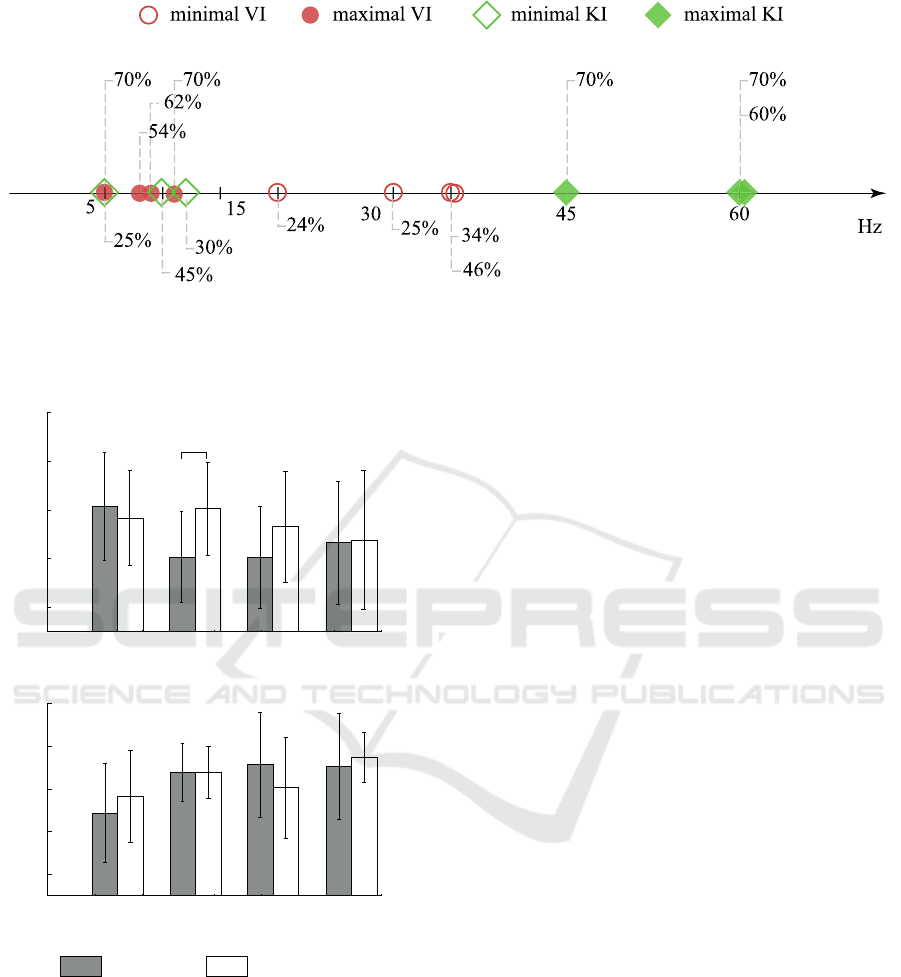
Figure 4: Minimal and maximal accuracy in VI and KI, represented as squares and circles, respectively.
computations.
30
40
50
60
70
Accuracy, %
Accuracy, %
5-15 15-30 30-45 45-60
Cutoff frequency, Hz
Cutoff frequency, Hz
(a)
(b)
30
40
50
60
70
*
5-15 15-30 30-45 45-60
all channels
optimized channels
Figure 5: Results of MEG trials classification for optimized
and unoptimized dataset for (a) VI and (b) KI groups of
subjects. Results are presented with the standard deviation.
For the VI (see Fig. 5(a)) optimization played a
positive part in the context of classification perfor-
mance: one can see that accuracy for cutoff frequency
15 − 30 Hz increased to the level of 5 − 15 Hz. In
general, for VI group the optimization of channel set
resulted in the increase or at least the absence of sig-
nificant changes of the classification accuracy. Re-
cent studies (Graimann et al., 2004) of time-frequency
structure of electroencephalography revealed that MI
can be pronounced not only in the motor-related cor-
tex, but also in several remote brain areas, which in
combination with our results can evidence that VI pat-
tern, which can be pronounced as various brain activ-
ity patterns, can emerge in different brain areas.
Returning to the KI group on Fig. 5(b), we can
see that optimization did not significantly affect the
classification accuracy, even resulting in decrease of
neural network performance.
4 CONCLUSION
Classifying motor imagery in untrained subjects into
two groups – kinesthetic and visual imagery – is a
well-known practice in recent studies. To implement
an effective and robust system for classification of
MI corresponding to the different limbs, one need to
study different scenarios of MI pattern emergence,
especially in untrained subjects. A widely known
strategy is to study an enhancement and decrease of
the sensorimotor rhythm, so-called event-related syn-
chronization and desynchronization – two phenomena
related to the motor activity, both real and imagery. In
present paper we studied MI of untrained subjects in
order to select two types of MI which causes different
sensorimotor rhythm pattern and provide a deeper in-
sight into the sensorimotor rhythm dynamics, related
to these two MI modes. We show that KI shows bet-
ter classification results than VI (67% vs 56%) and
in general is more pronounced in the context of time-
frequency structure of the magnitoencephalographi-
cal signal.
At the first stage of our study, we analysed the
amplitude changes of event-related potentials in sen-
sorimotor rhythm. Cluster analysis allowed us to di-
vide all subjects into two groups depending on the MI
mode. We revealed that the subjects from KI group
A MEG Study of Different Motor Imagery Modes in Untrained Subjects for BCI Applications
193

demonstrated event-related desynchronization in both
β and µ frequency bands, which is expected result
considering that the ”nature” of the KI pattern is more
related to the motor action (Neuper et al., 2005; Guil-
lot et al., 2009). On the contrary, the event-related
synchronization was found in the VI subjects.
Then, we enhanced our results using artificial neu-
ral network. First, we classified unoptimized magni-
toencephalographical dataset with 102 channels and
achieved up to 70% accuracy using the low-frequency
filter with cutoff below 15 Hz. The same level of ac-
curacy was achieved with KI by applying the high-
pass filter with cutoff above 30 Hz. Finally, in or-
der to see how data optimization affects the artificial
neural network performance, we selected 14 channels
over the motor-related area and revealed no signifi-
cant changes for KI. On the other hand, the VI group
shown the possibility to enhance artificial neural net-
work performance with particular set of channels and
frequency cutoffs.
Thus, despite the fact that KI is easier to clas-
sify and the KI pattern is more pronounced in time-
frequency structure of the MEG signal, there is a
possibility to achieve comparable results with the
VI. Since the VI mode is more common for un-
trained subjects, we suggest that obtained results can
be useful for implementation of the artificial intelli-
gence systems for MI patterns classification for brain-
computer interfaces, exoskeletons, wheelchairs and
other robotics devices.
ACKNOWLEDGEMENTS
This work has been supported by Russian Science
Foundation (Grant 17-72-30003).
REFERENCES
Arroyo, S., Lesser, R. P., Gordon, B., Uematsu, S., Jackson,
D., and Webber, R. (1993). Functional significance of
the mu rhythm of human cortex: an electrophysiologic
study with subdural electrodes. Electroencephalogra-
phy and clinical neurophysiology, 87(3):76–87.
Callow, N., Jiang, D., Roberts, R., and Edwards, M. G.
(2017). Kinesthetic imagery provides additive benefits
to internal visual imagery on slalom task performance.
Journal of Sport and Exercise Psychology, 39(1):81–
86.
Defays, D. (1977). An efficient algorithm for a complete
link method. The Computer Journal, 20(4):364–366.
Duann, J.-R. and Chiou, J.-C. (2016). A Comparison
of Independent Event-Related Desynchronization Re-
sponses in Motor-Related Brain Areas to Movement
Execution, Movement Imagery, and Movement Ob-
servation. PLOS ONE, 11(9):1–16.
Ferreira, A., Celeste, W. C., Cheein, F. A., Bastos-Filho,
T. F., Sarcinelli-Filho, M., and Carelli, R. (2008).
Human-machine interfaces based on EMG and EEG
applied to robotic systems. Journal of NeuroEngineer-
ing and Rehabilitation, 5(1):10.
Filgueiras, A., Conde, E. F. Q., and Hall, C. R. (2018).
The neural basis of kinesthetic and visual imagery in
sports: an ale meta- analysis. Brain imaging and be-
havior, 12(5):1513–1523.
Fraley, C. and Raftery, A. E. (1998). How many clusters?
which clustering method? answers via model-based
cluster analysis. The computer journal, 41(8):578–
588.
Frolov, A. A., Mokienko, O., Lyukmanov, R., Biryukova,
E., Kotov, S., Turbina, L., Nadareyshvily, G., and
Bushkova, Y. (2017). Post-stroke rehabilitation train-
ing with a motor-imagery-based brain-computer inter-
face (BCI)-controlled hand exoskeleton: a random-
ized controlled multicenter trial. Frontiers in neuro-
science, 11:400.
Graimann, B., Huggins, J. E., Levine, S. P., and
Pfurtscheller, G. (2004). Toward a direct brain
interface based on human subdural recordings and
wavelet-packet analysis. IEEE Transactions on
Biomedical Engineering, 51(6):954–962.
Guillot, A., Collet, C., Nguyen, V. A., Malouin, F.,
Richards, C., and Doyon, J. (2009). Brain activity dur-
ing visual versus kinesthetic imagery: an fmri study.
Human brain mapping, 30(7):2157–2172.
Hanakawa, T. (2016). Organizing motor imageries. Neuro-
science research, 104:56–63.
Jones, S. R., Kerr, C. E., Wan, Q., Pritchett, D. L.,
H
¨
am
¨
al
¨
ainen, M., and Moore, C. I. (2010). Cued spa-
tial attention drives functionally relevant modulation
of the mu rhythm in primary somatosensory cortex.
Journal of Neuroscience, 30(41):13760–13765.
K
¨
ubler, A., Nijboer, F., Mellinger, J., Vaughan, T. M.,
Pawelzik, H., Schalk, G., McFarland, D. J., Bir-
baumer, N., and Wolpaw, J. R. (2005). Patients with
ALS can use sensorimotor rhythms to operate a brain-
computer interface. Neurology, 64(10):1775–1777.
La Touche, R., Grande-Alonso, M., Cuenca-Mart\’\inez,
F., G
´
onz
´
alez-Ferrero, L., Suso-Mart\’\i, L., and
Paris-Alemany, A. (2018). Diminished Kinesthetic
and Visual Motor Imagery Ability in Adults With
Chronic Low Back Pain. PM&R.
Maksimenko, V. A., Pavlov, A., Runnova, A. E., Nedaivo-
zov, V., Grubov, V., Koronovskii, A. A., Pchelintseva,
S. V., Pitsik, E., Pisarchik, A. N., and Hramov, A. E.
(2018). Nonlinear analysis of brain activity, associated
with motor action and motor imaginary in untrained
subjects. Nonlinear Dynamics, 91(4):2803–2817.
McFarland, D. J. and Wolpaw, J. R. (2005). Sensorimotor
rhythm-based brain-computer interface (BCI): feature
selection by regression improves performance. IEEE
Transactions on Neural Systems and Rehabilitation
Engineering, 13(3):372–379.
ICINCO 2019 - 16th International Conference on Informatics in Control, Automation and Robotics
194

Mehler, D. M. A., Williams, A. N., Krause, F., L
¨
uhrs, M.,
Wise, R. G., Turner, D. L., Linden, D. E. J., and Whit-
taker, J. R. (2019a). The BOLD response in primary
motor cortex and supplementary motor area during
kinesthetic motor imagery based graded fMRI neuro-
feedback. Neuroimage, 184:36–44.
Mehler, D. M. A., Williams, A. N., Krause, F., Luhrs, M.,
Wise, R. G., Turner, D. L., Linden, D. E. J., and Whit-
taker, J. R. (2019b). The BOLD response in primary
motor cortex and supplementary motor area during
kinesthetic motor imagery based graded fMRI neuro-
feedback. NeuroImage, 184:36–44.
Meng, J., Zhang, S., Bekyo, A., Olsoe, J., Baxter, B., and
He, B. (2016). Noninvasive electroencephalogram
based control of a robotic arm for reach and grasp
tasks. Scientific Reports, 6:38565.
Mirza, I. A., Tripathy, A., Chopra, S., D’Sa, M., Ra-
jagopalan, K., D’Souza, A., and Sharma, N. (2015).
Mind-controlled wheelchair using an EEG headset
and arduino microcontroller. In Technologies for Sus-
tainable Development (ICTSD), 2015 International
Conference on, pages 1–5. IEEE.
Morlet, D., Peyrin, F., Desseigne, P., Touboul, P., and
Rubel, P. (1993). Wavelet analysis of high-resolution
signal-averaged ECGs in postinfarction patients. Jour-
nal of Electrocardiology, 26(4):311–320.
Murphy, D. P., Bai, O., Gorgey, A. S., Fox, J., Lovegreen,
W. T., Burkhardt, B. W., Atri, R., Marquez, J. S.,
Li, Q., and Fei, D.-Y. (2017). electroencephalogram-
Based Brain–computer interface and Lower-Limb
Prosthesis control: A case study. Frontiers in neu-
rology, 8:696.
Neuper, C., Scherer, R., Reiner, M., and Pfurtscheller, G.
(2005). Imagery of motor actions: Differential effects
of kinesthetic and visual–motor mode of imagery in
single-trial eeg. Cognitive brain research, 25(3):668–
677.
Nijboer, F., Morin, F. O., Carmien, S. P., Koene, R. A.,
Leon, E., and Hoffmann, U. (2009). Affective brain-
computer interfaces: Psychophysiological markers of
emotion in healthy persons and in persons with amy-
otrophic lateral sclerosis. In 2009 3rd International
Conference on Affective Computing and Intelligent In-
teraction and Workshops, pages 1–11. IEEE.
Norman, S. L., McFarland, D. J., Miner, A., Cramer, S. C.,
Wolbrecht, E. T., Wolpaw, J. R., and Reinkensmeyer,
D. J. (2018). Controlling pre-movement sensorimo-
tor rhythm can improve finger extension after stroke.
Journal of neural engineering, 15(5):56026.
¨
Ozt
¨
urk, N. and Yilmaz, B. (2018). Discrimination of Rest,
Motor Imagery and Movement for Brain-Computer
Interface Applications. In 2018 Medical Technologies
National Congress (TIPTEKNO), pages 1–4. IEEE.
Penaloza, C. I., Alimardani, M., and Nishio, S. (2018). An-
droid feedback-based training modulates sensorimo-
tor rhythms during motor imagery. IEEE Transac-
tions on Neural Systems and Rehabilitation Engineer-
ing, 26(3):666–674.
Ranky, G. N. and Adamovich, S. (2010). Analysis of a com-
mercial EEG device for the control of a robot arm.
In Proceedings of the 2010 IEEE 36th Annual North-
east Bioengineering Conference (NEBEC), pages 1–2.
IEEE.
Tacchino, G., Gandolla, M., Coelli, S., Barbieri, R., Pedroc-
chi, A., and Bianchi, A. M. (2017). EEG Analysis
during active and assisted repetitive movements: ev-
idence for differences in neural engagement. IEEE
Transactions on Neural Systems and Rehabilitation
Engineering, 25(6):761–771.
¨
Ubeyli, E. D. (2009). Combined neural network model em-
ploying wavelet coefficients for eeg signals classifica-
tion. Digital Signal Processing, 19(2):297–308.
Victorino, J., Noirhomme, Q., Lul
´
e, D., Kleih, S. C.,
Chatelle, C., Halder, S., Demertzi, A., Bruno, M.-
A., Gosseries, O., Vanhaudenhuyse, A., and Others
(2015). Improving EEG-BCI analysis for low cer-
tainty subjects by using dictionary learning. In Signal
Processing, Images and Computer Vision (STSIVA),
2015 20th Symposium on, pages 1–7. IEEE.
Yi, W., Qiu, S., Wang, K., Qi, H., He, F., Zhou, P., Zhang,
L., and Ming, D. (2016). EEG oscillatory patterns
and classification of sequential compound limb motor
imagery. Journal of neuroengineering and rehabilita-
tion, 13(1):11.
Yu, T., Xiao, J., Wang, F., Zhang, R., Gu, Z., Cichocki, A.,
and Li, Y. (2015). Enhanced motor imagery training
using a hybrid BCI with feedback. IEEE Transactions
on Biomedical Engineering, 62(7):1706–1717.
A MEG Study of Different Motor Imagery Modes in Untrained Subjects for BCI Applications
195
