
Automatic Temperature Measurement for Hot Spots
in Face Region of Cattle using Infrared Thermography
Mohammed Ahmed Jaddoa
1
, Adel Ahmed Al-Jumaily
1
,
Luciano Adrian Gonzalez
2
and Holly Cuthbertson
2
1
Faculty of Engineering and IT, University of Sydney Technology (UTS), 15 Broadway, Ultimo NSW, Australia
2
Faculty of Agriculture and Environment, University of Sydney, Ultimo NSW, Australia
luciano.gonzalez@sydney.edu.au, holly.cuthbertson@sydney.edu.au
Keywords: Infrared Thermal, Automatic Hot Spot Extraction, Face Detection in Cattle, Temperature Measurement in
Cattle.
Abstract: Infrared Thermography Technology (IRT) is a non-invasive method that has been used to calculate and
display temperature as an Infrared thermal image. Infrared thermal images are used frequently to measure
temperature remotely, and this temperature can be used as a health indicator for detecting diseases and
inflammation in human and animal. In cattle, the rising temperature of the eye and nose region used for
identifying stress and Bovine respiratory disease (BRD). In such applications, measuring temperature for nose
and eye region is conducted manually. In this paper, a new automatic method is proposed for extracting the
hottest regions from the face region, which may include eyes, nose and mouth. The proposed method involves
face detection, thresholding, and blob refinement. The preliminary results show that the proposed algorithm
is working well for localization and temperature measurement.
1 INTRODUCTION
Infrared Thermography Technology (IRT) is a non-
invasive method that has been used to calculate and
display temperature as an image. IRT can detect the
variations in temperature and detect blood flow
through determining the changes in body temperature
(Nääs, Garcia et al. 2014, Roberto, de Souza et al.
2014). The concept behind IRT is measuring heat
radiation that emitted from the surface of objects
(Roberto, de Souza et al. 2014). There are some
restrictions associated with this technology that needs
from users to care about while taking an image by
using IRT camera. These restrictions include
sunlight, high humidity as well as heat loss because
of the wind or when the surface of the body is
unclean. Also, the emissivity of radiation for objects
and reflection (connectivity with another object) of
radiation that comes from other object are also
considered as other factors that affected the accuracy
of captured results by an infrared camera (Nääs,
Garcia et al. 2014). Other significant factors or
parameters that required providing to the camera were
the distance between the object and camera and
humidity (Rekant, Lyons et al. 2016). Even though
the obstacles of using IRT, IRT has been applied
widely in different area such as veterinary medicine.
The common usage of IRT is its ability in
providing temperature remotely without need from
human to be close from target animal. Extracted
temperature can be used for monitoring and
evaluating animal health for early detection of rising
body temperature which is a sign of fever or local
inflammation. As examples for IRT application in
veterinary medicine, IRT has succeeded in detection
different disease such as mastitis in dairy cows (Polat,
Colak et al. 2010). The rising temperature of udder
used as an indicator of mastitis detection. Another
utilization of IRT is the ability for discovering the
increase of temperature which is used for
inflammation identification in cows (Pezeshki,
Stordeur et al. 2011). Also, IRT used for stress
detection in cows through temperature analysis for
eyes region (Stewart, Webster et al. 2007) and used
the same region as an indicator for feed efficiency in
cows (Palme and Schenkel). Bovine respiratory
disease (BRD) in calves can be detected in early stage
through IRT by measuring temperature for eyes
region (Schaefer, Cook et al. 2007). One of the
196
Jaddoa, M., Al-Jumaily, A., Gonzalez, L. and Cuthbertson, H.
Automatic Temperature Measurement for Hot Spots in Face Region of Cattle using Infrared Thermography.
DOI: 10.5220/0007810101960201
In Proceedings of the 16th International Conference on Informatics in Control, Automation and Robotics (ICINCO 2019), pages 196-201
ISBN: 978-989-758-380-3
Copyright
c
2019 by SCITEPRESS – Science and Technology Publications, Lda. All rights reserved

significant signs of BRD disease is increasing
temperature for eyes region during infection.
Inflammation, stress and diseases succeed effectively
in Equine Medicine by temperature analysis of
infrared thermal images (Soroko and Howell 2018).
In pigs, a rising surface temperature of the lacrimal
caruncle (ocular), auricular pavilion and nose area of
weaned piglets were used to find impacts the effects
of environmental enrichment and social structure
(Yáñez-Pizaña, Mota-Rojas et al. 2019). However,
extracting temperature by using infrared
thermography was studied extensively as a result of it
is significant. The utilization of IRT in veterinary
medicine is crucial and useful in detecting cattle
disease and inflammation that is able to treat it in the
early stage before it can spread to other animals in a
herd.
Previous studies were achieved through including
trained personnel to use a computer connected to
infrared thermal camera (Rekant, Lyons et al. 2016).
This means to identify a particular spot manually in
face region and other organ of the animal body. In this
paper, a new method is proposed for extracting hottest
spots from animal face through using machine
learning and image processing. Based on machine
learning, face region was identified automatically.
While in image processing, thresholding, and blob
refinement used for extracting hot spot of a face
region and measure temperature for extracted spots.
Based on high temperature, these spots may include
the nose, eyes and mouth.
The structure of the paper is as the following:
Related work presented in Sect. 2. The database is
described in Sect. 3, followed by the proposed
algorithm with its subsections in Sect. 4. The paper is
concluded by a result discussion (Sect. 5) and a
conclusion (Sect. 6).
2 RELATED WORK
Some selected methods of temperature extraction and
analysis for face region from thermal images are
presented and discussed below.
The authors in publication (Li, Menassa et al.
2018) used infrared thermal images in order to
measure the thermal comfort of people to modify
operational setting Heating, Ventilation and Air
Conditioning (HVAC) systems in buildings. Skin
temperature measured from facial regions after
applying face detection in frontal face position by
applying Haar Cascade algorithm. In the mentioned
study, the proposed method was validated through
including twelve of subjects for testing infrared
comfort. The results have shown that ear, nose and
cheek are best indicators to assets infrared thermal
comfort, and it is accurate with the percentage of
85%. Haar Cascade algorithm required a lot of images
and need to adjust the size of the bounding box as well
as false detection, which make it an undesirable
choice.
In this research paper (Jaddoa, Al-Jumaily et al.
2017) used infrared thermal images for eye
localization in cattle based on ellipse detection and
image processing. Randomized Hough Transform
algorithm was used for ellipse detection. Ellipse
detection was used in this study to localize eye region,
and thresholding used to extract eyes. Results showed
that proposed method has good performance in eye
localization in different orientation and localization.
This method is not appropriate when the direction of
animal face lead to a change in an ellipse shape. In
addition, it is hard to apply to detect eye region as a
result of overlapping of different animal faces at the
same time.
(Cruz-Albarran, Benitez-Rangel et al. 2017),
reported that the infrared thermal was used as an
image source for developing a smart thermal system
to diagnose emotions in human. After using the
reading for the ambient temperature, and emissivity
value, the static temperature was used as a threshold
value in order to extract face region. Emotion
identification achieved through temperature analysis
for the nose, forehead, nose and maxillary from
detected face region. In this study, 44 subjects
participated and the method has the ability to
detection emotion with 89.9% percentage.
While in other work (Budzan and Wyżgolik
2013), eyes and face detection as well as canthus
region of detected eye implemented on infrared
thermal images for temperature measurement
purpose. For face detection, Randomized Hough
transform was used to identify face region. The
combination of template-matching, knowledge-based
and morphological methods employed for eye and
eye-corner detection. The researchers of this paper
pointed out that the proposed method accurate with
percentage 97 with distance range 1.50 to 3.0 m
between camera and subject.
As reported above, the methods described in the
literature referred hardly to the issue of temperature
analysis for face region in cattle. Secondly, all
methods start by identifying face region before going
to temperature analysis. Temperature analysis is
crucial for diseases and inflammation diagnosis as
mention in the introduction section. High intensity in
the infrared thermal image means rising temperature,
and high intensity is an indicator of inflammation and
Automatic Temperature Measurement for Hot Spots in Face Region of Cattle using Infrared Thermography
197

infection. Thus, there is no research done regarding
the automated extracting temperature of the hot spot
of the animal face. To overcome the research gaps
identified in the existing body of knowledge, it is
critical to have a non-intrusive method for
temperature analysis of hot spots of face region in
cattle.
The aim of this paper is to propose a new method
for temperature analysis of hot spots from face region
in the frontal position. The proposed method includes
face detection using linear support vector machine
(SVM) and Histograms of Oriented Gradients (HOG)
features and a new image processing method for hot
spot extraction, and temperature measurement as final
results.
3 DATA COLLECION AND
CLEANING
The Infrared Thermography database used for testing
the proposed system was created through converting
video with seq format to a sequence of grey images
and infrared matrix. Infrared matrix created based on
equation (1).
(1)
Where
is calculated temperature according to
thermal value of the infrared thermal image.
and
refer to maximum and the minimum temperature
value of the thermal camera.
represent pixel
intensity of grey image.
is the high intensity
of grey image which it in most cases is 255. The
utilization of this calculation leads to generate an
infrared matrix with a temperature range of 20 to 38
Celsius.
The infrared thermal images collection included
150 thermograms image show animal face in frontal
position. The captured infrared thermal video
recorded in Arthursleigh Farm that it belongs to
Sydney University. It is located in Marulan town in
the Southern Tablelands of New South Wales,
Australia.
Duration of the video is two hours involving 73
animals in different positions and orientation. There
is no any kind of manipulation in the background,
which means this data is represent the real scenario of
animals roaming in the farm. Animal face in the
frontal position used in this study. The images were
acquired by using AGEMA 590 PAL, ThermaCam
S65, A310, T335 with 320 × 240-pixel for resolution.
Infrared image and matrix have same resolution .The
distance between camera and subject was about 1.50
to 3m. Fig.3 (A,B,C,D) shows a sample of the
prepared infrared thermal database, which includes a
herd of cattle indoor environment in the farm.
4 METHODOLOGY
The proposed method for temperature extraction and
analysis for face region has the following components
as illustrated in a Fig.1. As seen in Fig.1, the proposed
method starting by loading an infrared image in a grey
format and infrared thermal matrix. In the grey image,
removing noise and histogram equalization applied as
a pre-processing process before face detection stage.
Face detection applied to identify Region of Interest
(ROI) from an input image. Cropping of the face
region and binarization implemented to identify
important spot from detected face. In Blob refinement
stage, temperature from each blob extracted to keep
only hot spots from face. The last process stage is
temperature measurement. Each process stage of the
proposed method will be explained in details in the
next sections.
Load Infrared
Thermal image
Load Infrared
Thermal Matrix
Face detection
Binarization for face
region
Hot Spot extraction
and Temperature
analysis
Blob Refinement
Figure 1: Proposed method components.
4.1 Face Detection
Due to the important role of infrared thermal imaging
in monitoring and medical sector, several methods for
face detection in thermal infrared images have been
developed. These methods use state-of-the-art
processes from machine learning and feature
extraction to detect faces in images and videos. A
recent study compares the performance of different
face detection algorithm using infrared thermal
images of human (Kopaczka, Nestler et al. 2017).
Face detection algorithms include Haar cascade
classifier (VJ), Haar cascade classifier with local
binary patterns (VJ-LBP), Histograms of Oriented
Gradients (HOG) and SVM, The Deformable Parts
Model (DPM), Pixel Intensity Comparisons
Organized in Decision Trees (PICO), Eye Corner
Detection (ED) and Projection Profile Analysis
ICINCO 2019 - 16th International Conference on Informatics in Control, Automation and Robotics
198

(PPA)(Kopaczka, Nestler et al. 2017). Based on the
experimental results, the performances of theses
algorithm in term of precision are VJ(0.93),VJ-
LBP(0.97),HOG(1.00),PICO(0.90),PPA(0.85),ED(0.
52) and DPM(1.00).
The main concept behind these algorithms is an
automated classification for extracted features from
the image. Compared to the visual spectrum, there is
a lack of literature using face detection approach
specially developed for the thermal infrared spectrum
in animals. The reason for this lack is automated
classification based on machine learning requires
extensive amounts of manually annotated training
data which is not available for the thermal infrared
domain. In this paper, the researchers' own data were
used for training and testing. In addition, HOG for
feature extraction and SVM for classification will be
used in this paper for face detection.
Histograms of Oriented Gradients (HOG) is an
image features representation for image based on the
computational calculation of intensity gradient of an
image which presented by Dalal and Triggs (Dalal
and Triggs 2005). Currently, it is one of the most
widely used methods for object detection. In our work
for face detection, HOG is computed and converted
as a feature vector, and the feature vector is computed
for a training set of face and non-face images and the
results are used to train a support vector machine
(SVM). SVM learns how to distinguish the HOG
feature representation of a face from background
features.
In our work, we used the implementation
available in the dlib library (King 2009) to train and
test a HOG-based face detector. 150 infrared thermal
images used for training and 150 images also used for
testing. In training stage, face region of cattle was
labelled manually through using labeller app in
matlab. This small amount of images was used for
training because it required spending a lot of time in
manual labelling. In testing stage, another 150 of
image used without labelling to test the ability of
trained face detector.
After applying face detection, a binary converting
for face region will be used for extracting hot spot
from face region as shown in the next section.
4.2 Binarization for Face Region
After applying, face detection, cropping face region
based on the coordination of bounding box. After
applying, face detection, cropping face region based
on the coordination of bounding box. Histogram
equalization applied on pixels intensity of cropped
image. The aim of histogram equalization step is to
normalize image brightness and contrast through
modifying pixels intensity by using histogram
distribution. The concept behind histogram
equalization is scaling the most frequent pixel
intensity value compare to other pixels values. Fig.2
present examples of image before and after apply
histogram equalization. As seen in fig.2, eyes and
nose of animal face become brighter with pixel
intensity reach to 255. In contrast, dark region
become darker with pixels intensity close from 0.
After applying Histogram equalization,
thresholding used for converting cropped face region
to a binary image. 250 used as thresholding value
because all regions with high and medium brightness
become brighter that mean it is close from
255(fig.2(C)). Threshold value identifies based on the
equation (2).
(2)
Where
means grey value which is 1 if
greater than or equal 250 and 0 if less than 250.
refers to binary image. Thresholding is a
necessary stage for extracting important spots from
face. As shown in Fig.3, the binary image has a lot of
noise and it is hard to remove it using morphology
operation because the goal is to extract the hottest
region from face region. Thus, noise removed based
on masking each blob with infrared matrix and
remove masked blob with lowest temperature as
explained in blob refinement section. Blob refinement
used for extracting the hottest masked blob was based
on it is temperature compare to other blob.
4.3 Blob Refinement
The method of blob refinement defined as follows:
Algorithm 1: Blob refinement.
1:load infrared thermal matrix
2:load binary image
3:Obtain Number of blobs
4:For Loop on Number of blobs
5:Masking blob with infrared
thermal matrix
6:Max Temperature for each blob
7:Mean for extracted Max temperature
values
8: If temperature of blob less than
Mean
9: Convert current entire region to zero
10: else
11: check another blob
12 EndIf
13: end for loop
Automatic Temperature Measurement for Hot Spots in Face Region of Cattle using Infrared Thermography
199

Algorithm (1) for blob refinement start by loading
two inputs image: infrared thermal matrix and binary
image from previous stage as input. Normally, binary
image has two values for each pixel: 1 for blob and
zero for background. While infrared matrix has a
range of values 20 to 38 Celsius, in binary image, the
number of blobs is obtained, and used this number as
number loop over all blobs in binary image. Inside
loop, masking applied between blob and infrared
matrix. After applying masking, Max temperature for
each masked blob obtained. The mean of Max
temperature values will be used as a threshold for
removing masked blob with less temperature and
keeping hot masked blobs only from the face region.
This is stage is necessary to keep only hot spots from
face region. It is assumed as the hottest region that
masked blob with high temperature, which is greater
than temperature average.
A
B
C
D
Figure 2: Histogram equalization: (A) input image with
grayscale, (B) histogram distribution for input image, (C)
input image after apply histogram equalization, (D) final
image with histogram equalization.
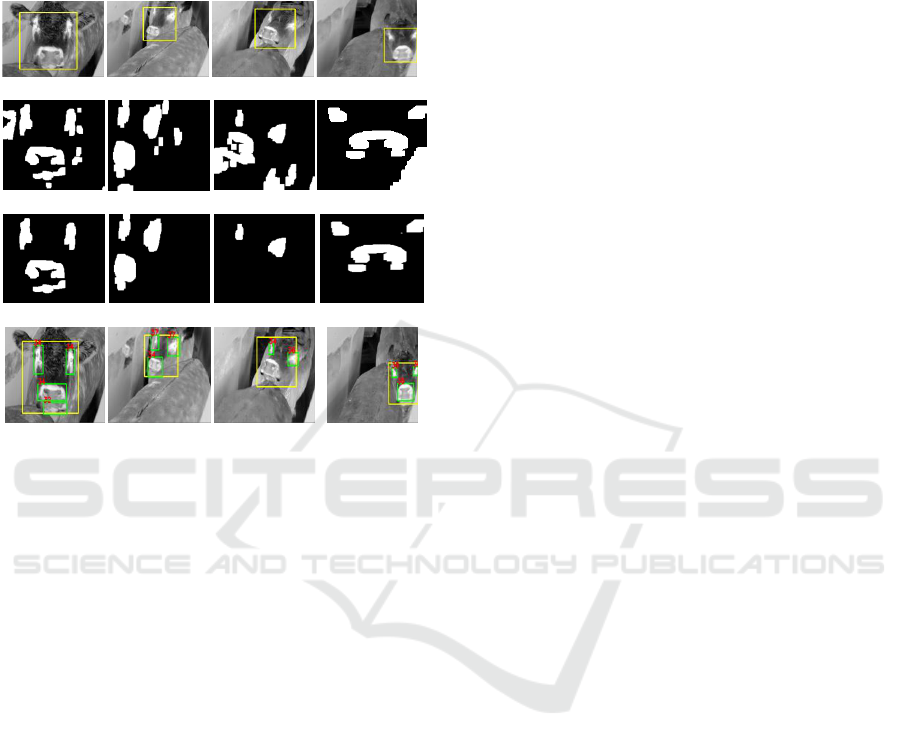
4.4 Hot Spot Extraction and
Temperature Analysis
The last stage is obtaining a temperature for
remaining blobs. Temperature extraction use same
method as mentioned in the algorithm (1). Masking
between each blob with the infrared thermal matrix.
The bounding box will contain remained blob with
showing max temperature value as shown in Fig.3
(M,N,P,Q). Remaining blobs represent a hot spot of
the face region. Temperature measurement of these
blobs can be calculated by using equation (1).
5 PRELIMINARY RESULTS AND
DISCUSSION
In this paper, face detection is tested only through
split infrared thermal database to two group: training
and testing. While hot spot extraction was not tested
yet as result to require preparing ground truth dataset.
Equation (3) refers to evaluation of face detection.
(3)
As shown in (3),
refers to evaluation for the
proposed method.
means number of face
detection, which is 120. While
represents number
of infrared thermal images in the database, which is
150 images. This means face detected correctly with
percentage 80%.
As presented in Fig.3 (M,N,P,Q), the temperature
for the different spot of face region was in range 32
to 37 Celsius. Eyes region were in range 34 to 37,
while the nose was in range 34 to 36. We assume
hottest spot is region with higher temperature in this
case masked blob with higher temperature. These
temperature values can be used in future as an
indicator of inflammation and disease as mentioned
in section .1.
6 CONCLUSIONS
In this paper, a method is proposed for temperature
extraction from face region in cattle through
employing infrared thermal image. The contribution
of this paper is the new implementation for face
detection in cattle using infrared thermal images. In
addition, the new method proposed for hot spot
extraction from face region. Unlike evaluation for
face detection, we did not evaluate the hot spot
extraction due to it is varied from animal to other. As
future work, eye and nose detection with correlation
to inflammation or disease will be a new path in this
research area.
ACKNOWLEDGEMENTS
This research paper is the result of help and assistance
from the team of researchers. Firstly, I would like to
thank my supervisor Dr. Adel for his unlimited
ICINCO 2019 - 16th International Conference on Informatics in Control, Automation and Robotics
200
support during the present research. In addition, the
Co-supervisor Dr. Luciano helps to provide me with
the database. Lastly, I am grateful for my colleague
Holly for her answering my enquiries regarding the
physiological status of cattle.
A
B
C
D
E
F
G
H
I
J
K
L
M
N
P
Q
Figure 3: Stages of temperature extraction and analysis for
face region.
REFERENCES
Nääs, I. A., R. G. Garcia and F. R. Caldara (2014). "Infrared
thermal image for assessing animal health and welfare."
JABB-Online Submission System 2(3): 66-72.
Roberto, J. V. B., B. de Souza, D. A. Furtado, L. J. B.
Delfino and B. d. A. Marques (2014). "Thermal
gradients and physiological responses of goats in the
Brazilian semi-arid using thermography infrared."
Budzan, S. and R. Wyżgolik (2013). "Face and eyes
localization algorithm in thermal images for
temperature measurement of the inner canthus of the
eyes." Infrared Physics & Technology 60: 225-234.
Cruz-Albarran, I. A., J. P. Benitez-Rangel, R. A. Osornio-
Rios and L. A. Morales-Hernandez (2017). "Human
emotions detection based on a smart-thermal system of
thermographic images." Infrared Physics &
Technology 81: 250-261.
Dalal, N. and B. Triggs (2005). Histograms of oriented
gradients for human detection. Computer Vision and
Pattern Recognition, 2005. CVPR 2005. IEEE
Computer Society Conference on, IEEE.
Jaddoa, M. A., A. Al-Jumaily, L. Gonzalez and H.
Cuthbertson (2017). Automatic eyes localization in
thermal images for temperature measurement in cattle.
Intelligent Systems and Knowledge Engineering
(ISKE), 2017 12th International Conference on, IEEE.
King, D. E. (2009). "Dlib-ml: A machine learning toolkit."
Journal of Machine Learning Research 10(Jul): 1755-
1758.
Kopaczka, M., J. Nestler and D. Merhof (2017). Face
Detection in Thermal Infrared Images: A Comparison
of Algorithm-and Machine-Learning-Based
Approaches. International Conference on Advanced
Concepts for Intelligent Vision Systems, Springer.
Li, D., C. C. Menassa and V. R. Kamat (2018). "Non-
intrusive interpretation of human thermal comfort
through analysis of facial infrared thermography."
Energy and Buildings 176: 246-261.
Nääs, I. A., R. G. Garcia and F. R. Caldara (2014). "Infrared
thermal image for assessing animal health and welfare."
JABB-Online Submission System 2(3): 66-72.
Palme, R. and F. S. Schenkel "Relationships between
residual feed intake and infrared thermography and
glucocorticoid levels in feedlot steers from three
different sire breeds."
Pezeshki, A., P. Stordeur, H. Wallemacq, F. Schynts, M.
Stevens, P. Boutet, L. J. Peelman, B. De Spiegeleer, L.
Duchateau and F. Bureau (2011). "Variation of
inflammatory dynamics and mediators in primiparous
cows after intramammary challenge with Escherichia
coli." Veterinary research 42(1): 15.
Polat, B., A. Colak, M. Cengiz, L. Yanmaz, H. Oral, A.
Bastan, S. Kaya and A. Hayirli (2010). "Sensitivity and
specificity of infrared thermography in detection of
subclinical mastitis in dairy cows." Journal of Dairy
Science 93(8): 3525-3532.
Rekant, S. I., M. A. Lyons, J. M. Pacheco, J. Arzt and L. L.
Rodriguez (2016). "Veterinary applications of infrared
thermography." American journal of veterinary
research 77(1): 98-107.
Roberto, J. V. B., B. de Souza, D. A. Furtado, L. J. B.
Delfino and B. d. A. Marques (2014). "Thermal
gradients and physiological responses of goats in the
Brazilian semi-arid using thermography infrared."
Journal of Animal Behaviour and Biometeorology 2(1):
11-19.
Schaefer, A., N. Cook, J. Church, J. Basarab, B. Perry, C.
Miller and A. Tong (2007). "The use of infrared
thermography as an early indicator of bovine
respiratory disease complex in calves." Research in
Veterinary Science 83(3): 376-384.
Soroko, M. and K. Howell (2018). "Infrared thermography:
current applications in equine medicine." Journal of
Equine Veterinary Science 60: 90-96. e92.
Stewart, M., J. Webster, G. Verkerk, A. Schaefer, J. Colyn
and K. Stafford (2007). "Non-invasive measurement of
stress in dairy cows using infrared thermography."
Physiology & Behavior 92(3): 520-525.
Yáñez-Pizaña, A., D. Mota-Rojas, R. Ramírez-Necoechea,
M. Castillo-Rivera, P. Roldán-Santiago, P. Mora-
Medina and M. González-Lozano (2019). "Application
of infrared thermography to assess the effect of
different types of environmental enrichment on the
ocular, auricular pavilion and nose area temperatures of
weaned piglets." Computers and Electronics in
Agriculture 156: 33-42.
Automatic Temperature Measurement for Hot Spots in Face Region of Cattle using Infrared Thermography
201
