
Generation of Complex Data for AI-based Predictive Maintenance
Research with a Physical Factory Model
Patrick Klein
a
and Ralph Bergmann
b
Business Information Systems II, University of Trier, Germany
Keywords:
Data Generation, Machine Learning, Predictive Maintenance, Industry 4.0.
Abstract:
Manufacturing systems naturally contain plenty of sensors which produce data primarily used by the control
software to detect relevant status information of the actuators. In addition, sensors are included in order to
monitor the health status of specific components, which enable to detect certain known, frequently occurring
faults or undesired states of the system. While the identification of a failure by using the data of a sensor
dedicated explicitly to its detection is a rather straightforward machine learning application, the detection
of failures which only have an indirect effect on the data produced by a couple of other sensors is much
more challenging. Therefore, a combination of different methods from Artificial Intelligence, in particular,
machine learning and knowledge-based (semantic) approaches is required to identify relevant patterns (or
failure modes). However, there are currently no appropriate research environments and data sets available that
can be used for this kind of research. In this paper, we propose an approach for the generation of predictive
maintenance data by using a physical Fischertechnik model factory equipped with several sensors. Different
ways of reproducing real failures using this model are presented as well as a general procedure for data
generation.
1 INTRODUCTION
As part of the fourth industrial revolution, manufac-
turing systems are today equipped with various sen-
sors and actuators with the aim of using data not only
for control purposes but also for real-time decision
making based on an intensive use of methods from
Artificial Intelligence (AI) (Lee et al., 2014). An im-
portant field of service innovation is related to diagno-
sis and maintenance of manufacturing machines. For
this purpose, manufacturing machines are equipped
with various sensors, whose data enable to derive a
comprehensive picture of the current state of each ma-
chine. Based on this data, occurring problems can be
diagnosed and more importantly, upcoming problems
can be predicted prior to their occurrence. In particu-
lar, predictive maintenance (PredM) aims at foresee-
ing a breakdown of the system to be maintained by
detecting early signs of failure in order to make main-
tenance work more proactive (Selcuk, 2017).
For PredM to work, knowledge is required about
characteristic data patterns (or failure modes) that are
a
https://orcid.org/0000-0002-5077-2645
b
https://orcid.org/0000-0002-5515-7158
indicators of specific faults that have occurred or that
are likely to occur in the future. Due to the large
number of potential faults as well as the large vari-
ety of production machinery and components used, it
is not always possible to have dedicated sensors that
produce well-known failure patterns for each possi-
ble fault. Instead, it is desirable to identify or to pre-
dict failures due to the indirect effect that is visible
in the data recorded by sensors not specifically dedi-
cated for this purpose. However, the manual identifi-
cation of the respective sensors and the characteristic
pattern is usually not feasible. Instead, machine learn-
ing (ML) can be used to automatically derive such
patterns from available data. However, this task is
quite challenging as it requires the analysis of various
sensor streams and their interrelation together with a
model of the manufacturing system that enables their
appropriate interpretation. Research on combining
ML with knowledge-based methods from AI is re-
quired for this task. This comes along with a variety
of challenges, in particular related to the complexity
and heterogeneity of data, the lack of labelled data,
the need for transfer learning, as well as the necessity
of explainable decision support.
A primary pre-requisite for this kind of research
40
Klein, P. and Bergmann, R.
Generation of Complex Data for AI-based Predictive Maintenance Research with a Physical Factory Model.
DOI: 10.5220/0007830700400050
In Proceedings of the 16th International Conference on Informatics in Control, Automation and Robotics (ICINCO 2019), pages 40-50
ISBN: 978-989-758-380-3
Copyright
c
2019 by SCITEPRESS – Science and Technology Publications, Lda. All rights reserved

is the availability of complex sensor data which is re-
lated to a known manufacturing system. While plenty
of data sets are available for research purposes in ML,
there is a lack of data that can be used immediately for
PredM applications. Also it is nearly impossible (at
least for Universities) to get real data from industry
due to the serious confidentiality issues involved. In
this paper we therefore address the issue of obtaining
data appropriate for advanced ML research in PredM
and extend our previous work (Klein and Bergmann,
2018) by a comprehensive survey on available data
sets as well as provide an example case. First, we
present a brief overview of PredM and the involved
research challenges for ML (Sect. 2). Then, we char-
acterize the required data to address these challenges,
analyze existing data sets as well as methods for the
generation of new research data (Sect. 3). The main
contribution of the paper is the presentation of an ap-
proach for the generation of PredM data based on a
physical model of a specific production environment
implemented based on a Fischertechnik (FT) model
factory (Sect. 4). We further describe various ways
for injecting faulty behavior in a defined process into
the FT model factory, in order to collect the respective
data that can be used to learn the related patterns for
prediction. We describe the current state of realization
as well as our planned future work (Sect. 5).
2 PREDICTIVE MAINTENANCE
AND MACHINE LEARNING
2.1 Predictive Maintenance
Industrial maintenance involves all measures that are
required to ensure or to re-establish the proper func-
tioning of industrial machinery. The goal is to prevent
the occurrence of failures that could lead to break-
downs or downtimes of machines or that could lead
to safety concerns. Traditional, preventive mainte-
nance involves the systematic inspection of machines
following a fixed time schedule or a fixed mileage,
which is based on the simplified assumption that fail-
ures mostly occur after a certain and known operat-
ing time or effort. However, failures often occur be-
fore the scheduled maintenance activity or that main-
tenance actions are performed although they are not
yet necessary. Thus, PredM aims to perform main-
tenance actions only when they are really necessary,
i.e., not too early and not too late. For companies,
PredM has the advantage that maintenance costs can
be reduced significantly by better utilization of capac-
ities and by avoiding downtimes in manufacturing.
PredM is based on forecasting failures based on
the current state captured by various sensors, such
as vibration, temperature, humidity, or acoustic sen-
sors. In addition, parameters characterizing the cur-
rent state in the production process (e.g. position sen-
sors or switches as well as the activity state of actua-
tors) are relevant. Machines in real production envi-
ronments may have hundreds of various sensors pro-
ducing data streams with high frequency.
2.2 Machine Learning for Predictive
Maintenance
The increasing number of sensor data streams makes
manual monitoring and analysis impossible, which is
why ML and especially deep learning are suitable for
PredM data processing (Khan and Yairi, 2018; Zhao
et al., 2016). They are mostly applied to the typi-
cal PredM tasks (Heged
˝
us et al., 2018) such as Re-
main Useful Life (RUL), Root Cause Analysis also
referred to as Fault Diagnosis (FD), Fault Prediction
(FP), and Maintenance Strategy Optimization (MSO).
The prediction of RUL values for components is prob-
ably the most prominent application which is a regres-
sion task with multivariate time series as input, how-
ever, sometimes it is performed as a classification task
in which the RUL values are discretized from larger
ranges to classes. For instance, Babu et al. (Babu
et al., 2016) applied a convolutional neural network
for RUL prediction and Yuan et al. (Yuan et al., 2016)
compare different recurrent neural network architec-
tures for RUL and FD of an aircraft turbofan engine.
Furthermore, FP is used to predict upcoming incor-
rect functioning which is not caused by wear, for in-
stance, a future incorrect positioning of a robot arm
in a manufacturing process or to predict defects on a
production line (Zhang et al., 2016).
2.3 Research Challenges
While the identification of a failure by using the data
of sensors specifically dedicated to its detection is a
rather straightforward machine learning application,
the detection of failures which only have an indirect
effect on the data produced by a couple of other sen-
sors is much more challenging. Due to the large over-
all number of sensors, knowledge of the production
system (type of actuators, sensors and their interre-
lation) is additionally required to guide the genera-
tion of patterns by machine learning. It is difficult
to determine the subset of relevant data streams for
the detection of a failure as well as the time frame in
which these data streams produce characteristic pat-
terns that are an indication of this failure. Quite often
Generation of Complex Data for AI-based Predictive Maintenance Research with a Physical Factory Model
41

it is difficult to label correctly the occurrence of a cer-
tain failure, as maintenance protocols are usually the
only source of information about when which failure
has occurred. This leads to huge problems related to
the data preparation prior to the use of ML algorithms.
In addition, failures are usually the exception, which
makes the data sets highly unbalanced. Although the
overall volume of data is huge, the number of differ-
ent failure modes for a certain type of failure is rather
small. This leads to the need for transfer learning,
in order to be able to transfer a learned failure model
from one machine component to a different, but simi-
lar component. Finally, the ability to explain a certain
prediction is also very important in PredM in order to
enable a human operator to assess and verify an auto-
matically proposed maintenance action.
3 RESEARCH DATA FOR
MACHINE LEARNING IN
PREDICTIVE MAINTENANCE
3.1 Requirements on Research Data for
Predictive Maintenance Research
For conducting advanced ML research for PredM it is
necessary to have data available that is to some degree
comparable to the data in industrial settings. Thus,
data sets are necessary which are composed of various
data streams with different characteristics (according
to the type of sensors used in production systems) to-
gether with related data about the current status of the
production component or process. For learning to pre-
dict failures, there must be data streams whose data is
somehow directly or indirectly affected by the failure
to be predicted. Also the data sets must be at least par-
tially labelled with the respective fault to be predicted.
Ideally, we need large data sets describing several in-
stances of the same fault and data sets describing the
same fault in various different but similar components
to investigate transfer learning approaches.
3.2 Existing Data Sets
A survey conducted by (Eker et al., 2012) bench-
marked six common run-to-failure data sets for their
application to data-driven prognostics and found only
two of them to be applicable. Since then, further data
sets have been provided with the primary sources are
the NASA Prognostics Data Repository
1
with 16 data
1
https://ti.arc.nasa.gov/tech/dash/groups/pcoe/prognostic
-data-repository/
sets, as well as a collection of 12 data sets from previ-
ously organized data competitions by the Prognostic
and Health Management Society
2
(PHMS).
The focus of the 16 NASA prognostic data sets
is on aerospace, with data being provided on topics
including material fatigue, turbofans degradation, tra-
jectories of balls and battery lifecycles, as well as data
on fundamental components that can be found in a va-
riety of industrial machines, such as ball bearings and
electronic parts, as well as a milling machine. The
PHMS data challenges’ objects of investigation in-
clude individual components as well as complex ma-
chines. The first competition in 2008 was based on
NASA’s simulation model for turbofan degradation,
and the 2012 bearing fault data set is also provided
by NASA. Further competition data correspond to an
anemometer (2011), a power plant (2015) and a bogie
(2017), which are not representative equipment for a
manufacturing plant. Moreover, the gearbox vibra-
tion data from the 2009 challenge is unlabeled, and
the asset used for data generation in 2013 and 2014
remains unknown. The remaining PHMS’s data sets
are about milling cutter wear (2010), and a wafer sys-
tem (2016), which as mentioned in the challenge de-
scription, seems more appropriate for physics-based
modeling methods. The latest one, in 2018, was an
ion mill etching system. A general overview of data
sets published as part of competitions of PHMS up
until 2017 can be found in the appendix of (Jia et al.,
2018).
In addition, the well-known UC Irvine Machine
Learning Repository (Dua and Graff, 2019) contains
two out of more than 450 data sets that address pre-
dictive maintenance of industrial equipment. Further-
more, less than a dozen of over 15,000 data sets on
this topic are provided by the machine learning com-
petition platform Kaggle
3
.
Table 1 gives a chronologically ordered overview
of eleven data sets from the aforementioned sources.
The data sets are selected according to their frequency
used to evaluate PredM procedures their relevance
of the investigated equipment and sensors for the in-
dustry 4.0. Data sets not previously used in a pub-
lished research work are not taken into account. The
first column contains the name of the data set and its
publication date. We classify the model type used
to represent the studied object into virtual simulation
(VS), test rig (TR) and industrial system (IS). More-
over, only labeled data, typically referred to as train-
ing data, are counted as samples. For a data set that
does not have any failure label, each recorded time
series is counted as a sample. Furthermore, typical
2
https://www.phmsociety.org/
3
https://www.kaggle.com/
ICINCO 2019 - 16th International Conference on Informatics in Control, Automation and Robotics
42
Table 1: Overview of data sets from the PredM domain.
No.
Data Set
Studied
Object
Model
Type
# Samples
# Sensor
Data
Streams
Types of
Sensor
Streams
Recor-
ding
Type
Failure
Labelling
# Condit-
ions
Recording
Purpose
1
Robot Execution Failures Data Set
(UCI, 1999)
(Assembly
line) Robot
Unk.
463
6
Force, Torque
RoC
5 failure
groups with 3-
5 classes
Unk.
Failure
diagnosis
2
NASA Milling Data Set (2007)
Milling
machine
IS
16
6
Acou, vib, curr
R2F
Flank wear
value
8
Wear
investigation
3
NASA IMS Bearing Data Set
(2007)
Bearing
TR
12
8,
later 4
Acc
R2F
4 failures from
three types
1
Wear
investigation
4
NASA Turbofan Data Set (2008)
Turbofan
engine
VS
708
26
Press, speed,
temp, among
others
R2F
One or two
fault modes
4
Challenge
5
PHMS Challenge 2009 Gearbox
Gearbox
TR
560
3
Acc,
tachometer
RoC
Not provided
10
Challenge
6
NASA Femto Bearing Data Set
(2012)
Bearing
TR
17
3 or 2
Acc, temp
R2F
Recording until
acc. exceeding
20g
3
Wear
investigation,
challenge
7
IEEE-bigdata-2016 Manufacturing
data challenge
Production
line
IS
1,183,747
968
Unk.
RoC
Product quality
as binary label
Unk.
Challenge
8
Cond. Monitoring of Hydraulic
Systems Data Set (2018)
Hydraulic
system
TR
2205
17
Press, motor
power, temp,
vib, among
others
RoC
Condition of
four hydraulic
components w.
3 and 4 states
1
Wear
investigation
9
PHMS Challgene 2018
Ion milletch
tool
IS
1237
17
Voltage, curr,
press, speed,
among others
RwMF
3 failure types
Various
Challenge
10
One Year Industrial Component
Degradation (Kaggle, 2018)
Blade of a
shrink-
wrapper
IS
519
8
Motor torque,
speed, position
error
R2F
Not provided
Various
Anomaly
localization
11
Production Plant Data for Condition
Monitoring (Kaggle, 2018)
Unk. comp.
of a
composite
line for non-
wovens
IS
8
25
Unk.
R2F
Not provided
Unk.
Anomaly
localization
Generation of Complex Data for AI-based Predictive Maintenance Research with a Physical Factory Model
43

types of sensors, including acoustic emission sensors
(acou), acceleration sensors (acc), vibration sensors
(vib), current sensors (cur), pressure sensors (press),
temperature sensors (temp) as well as their sampling
rates, are given. The type of recording can be grouped
into run-to-failure (R2F) recordings where a degrada-
tion process is shown over time. In most cases, the
recording ends with the failure to be investigated. The
other group contains records of time series represent-
ing the current condition of the system, and do not
contain a degradation process, abbreviate as a record
of condition (RoC). A recording with several faults
is named Recording with Multiple Failures (RwMF).
The remaining columns in the table indicate the label-
ing schema, the number of working conditions under
which the data set is recorded as well as the purpose
of the recording.
These publicly available data sets have some
shortcomings, making them unsuitable for AI-based
PredM research. The most significant shortcoming
for data sets with the purpose of wear investigation
(1-6, 8) is that these only consider single components
or working station cells, and are mostly recorded to
detect a dedicated fault, rather than providing a com-
prehensive picture of related sensor data. This is use-
ful for the investigation of wear, however, results in
a small number of sensor data streams and do not
present the complexity and variety of a real indus-
trial environment. The data sets that are not affected
by this issue (7, 9, 10, 11) do not provide a semantic
model and lack on detailed information about the re-
lationship between sensors and actuators in order to
create one. The largest data set in regard to the num-
ber of samples and features (7) is only of limited inter-
est for PredM, since the task is to predict the quality
of manufactured products and not the condition of its
manufacturing components. Although the data sets
10 and 11 from (von Birgelen et al., 2018) would be
appropriate due to the equipment used, it is not pos-
sible to evaluate PredM related tasks, such as predict-
ing RUL, without knowing when errors occurred in
the data.
3.3 Approaches for Data Generation
Since there is no sufficient or adequate data from in-
dustrial factories publicly available for research pur-
poses, it is desirable to collect or generate them. Sen-
sor data generation without the real production envi-
ronment at hand can be categorized into four groups:
1. fully synthetical, 2. synthetical based on previ-
ous data, 3. synthetical based on a virtual simulation
model, and finally 4. based on a simplified physical
model.
3.3.1 Fully Synthetic Data Generation
Fully synthetic data generation means that sensor data
is generated by an algorithm based on given parame-
ters. The resulting streams are based on a statistical
structure and can contain concept drifts (changing of
underlying statistical properties over time). Typical
parameters are the data generating distribution (e.g.
Gaussian), noise rate, data dimensionality, and gener-
ation periodicity. For instance, Hahsler et al. (Hahsler
et al., 2017) provide a software framework for gener-
ation and analysis of fully synthetical data streams.
3.3.2 Synthetic Data Generation based on
Previous Data
Another way to generate sensor data is to learn the
underlying properties of an existing data distribution
in order to generate new data. This can be done by
training a generative and discriminative neural model
by learning either explicitly the parameters of the dis-
tribution (Alzantot et al., 2017) or implicitly with a
generative adversarial network for time series (Este-
ban et al., 2017).
3.3.3 Synthetic Data Generation based on a
Virtual Simulation Model
A further approach is the creation of a virtual simula-
tion model with the properties of the real model and
use this for data generation. This approach, for exam-
ple, has been applied to aircraft gas turbines (Saxena
et al., 2008) and to create a virtual factory (Jain et al.,
2017) including detailed machine level data streams
for testing machine health data analytics applications.
3.3.4 Data Collection based on a Simplified
Physical Model
Instead of using a virtual model of a factory or ma-
chine, there is also the possibility of using a simpli-
fied physical model. Regarding the level of abstrac-
tion and the constituents of the model, such models
can be divided into two categories.
The first category are models which are equipped
with real industrial components leading to minor ab-
stractions. Examples of such factories are Learning
Factories (Abele et al., 2015) such as AutFab (Simons
et al., 2017) or the SmartFactory
4
particularly estab-
lished for Industry 4.0 research. Also small physical
models for the generation of specific faults, such as
bearing faults (Nectoux et al., 2012) exist.
The second category consists of models with a
higher level of abstraction, which are build using
4
http://www.smartfactory.de/
ICINCO 2019 - 16th International Conference on Informatics in Control, Automation and Robotics
44

non-industrial components. The advantage of this
approach is the significantly low cost involved in
building such a model. There are several platforms
which enable the simple cost-efficient construction
of such models. Among them the most popular are
Lego Mindstorms
5
and Fischertechnik (FT)
6
. Exam-
ples are the Smart-LEGO Factory
7
at DFKI, the FT
plant model for teaching and concept evaluation pur-
poses regarding Industry 4.0 (Lang et al., 2018) and
an FT punching workstation built to demonstrate how
a generic client can access data generated from the
workstation (Angione et al., 2017).
4 GENERATING RESEARCH
DATA FOR PREDICTIVE
MAINTENANCE BY FT MODEL
FACTORY
We now describe a cost-effective approach for the
generation of appropriate data according to the re-
quirements sketched in Sect. 3.1. This requires con-
structing a physical model of a factory, attaching ap-
propriate sensors and related data collection hard- and
software, as well as developing means for the simula-
tion of faults.
4.1 A Physical Model Factory for Data
Generation
Our Industry 4.0 factory model is built based upon
the FT Factory Simulation
8
as shown in Fig. 1. It
has been selected due to its superior robustness com-
pared to Lego Mindstorms. The FT factory model
that we use consists of four modules: a sorting line
with color detection, a multi-processing station with
oven and milling machine, a high-bay warehouse, and
a vacuum gripper robot. Each module is operated by
its own controller based on an ARM Cortex A8 CPU
with various analog and digital input/output ports run-
ning under a LINUX kernel. Overall, the model con-
sists of nine light barriers, ten switches, twelve mo-
tors and three compressors. Moreover, we enhanced
the model with six three-axis acceleration sensors that
are mounted on motors and compressors for vibration
measuring and four differential pressure sensors are
5
https://www.lego.com/en-us/mindstorms
6
https://www.fischertechnik.de/en
7
https://www.dfki.de/web/aktuelles/dfki-cebit-2016/
smart-lego
8
https://www.fischertechnik.de/de-de/service/elearning/
simulieren/fabrik-simulation-9v
measuring the pressure generated from the three com-
pressors. These sensors are connected to a separate
Raspberry Pi controller. To further increase the vari-
ety of the data, two micro-electro-mechanical systems
(MEMS) each with a gyroscope, an accelerometer,
and a geomagnetic sensor are installed on the robotic
vacuum gripper and the high-bay’s storage and dis-
pensing machine. Further, we will extend the oven
model with a heating pad in order to change the color
of thermo-colored product materials. This process
will be monitored by a thermal imaging camera.
All controllers are connected via an Ethernet net-
work and communicate via remote procedure calls.
The overall control software for the entire produc-
tion process is distributed over the controllers, each of
which is in charge of a certain module of the factory.
For processing the generated data, we selected the
SMACK stack (Estrada and Ruiz, 2016) as a Lambda
architecture implementation because it is often used
for Big Data applications in industry. Thus, we set up
each controller as a producer to the high throughput
distributed messaging system Apache Kafka (Kreps
et al., 2011). Apache Cassandra was installed as a
database for batch processing and we further plan to
use Apache Spark for stream processing and ML re-
search.
The overall manufacturing process is designed as
a cycle, meaning that data can be generated without
manual interference. The process starts from the high
bay where workpieces are dispensed and transported
to the multi processing station. After processing, they
are sorted by color, transported by the robotic vacuum
gripper and finally stored in the high bay where the
process repeats.
4.2 Reproduction of Failures
By using the FT model along with the developed soft-
ware, the manufacturing process is executed in a con-
tinuous loop. As FT blocks are quite robust and all
physical connections are very stable, problems occur
quite rarely and hence the model is able to run prop-
erly over a very long period of time. However, in or-
der to be able to produce data for predictive mainte-
nance, faults must occur such that the resulting data
can be collected. As such faults do not occur natu-
rally (within an acceptable time limit) realistic faults
must be artificially infused into the model.
Fig. 2 describes the interplay between reality, our
FT model, the creation of faults, and finally the data
generation. In general, reality defines which failure
types are measurable and reasonable. Our FT model
is a smaller and simplified representation of reality
and due to this it certainly restricts our ability to re-
Generation of Complex Data for AI-based Predictive Maintenance Research with a Physical Factory Model
45
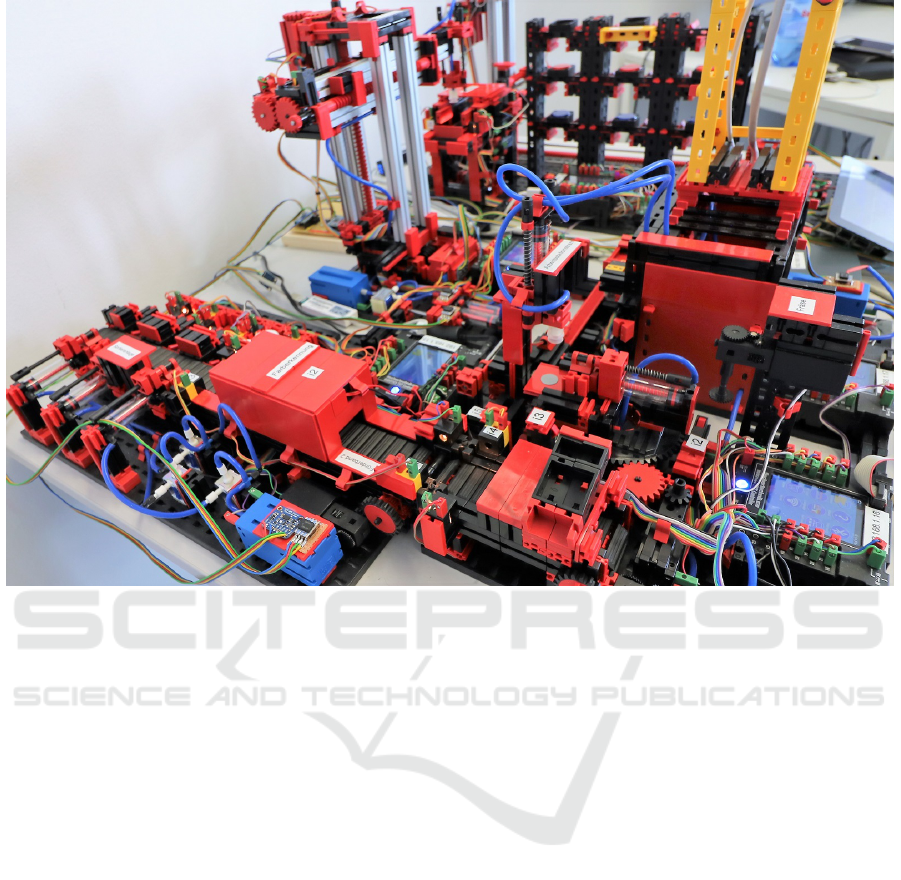
Figure 1: The FT factory simulation model. The area used for the example case (Subsect. 4.4) is located at the bottom left.
produce realistic defects. Also life expectancy for
components in real machines is months to years and
degradation processes are very slow. Thus we have to
compress the time dimension, i.e., we have to signif-
icantly shorten the time during which a certain type
of fault causes its typical effects. Based on these lim-
itations we define plausible defects that can be sim-
ulated by our physical model such that data is gener-
ated that can be used for learning and evaluating prog-
nostic models on predictive maintenance.
In general, there are several ways in which behav-
ior can be generated similar to a failure in reality.
4.2.1 Modifying the Model by Additional
Actuators and Specifically Prepared Parts
In order to produce an abnormal behavior of the
physical model, additional actuators can be integrated
whose activities cause certain disturbances. For ex-
ample, workpieces can be pushed from the conveyor
by getting stuck on an obstacle, a pressure line can be
virtually broken by inserting a pressure valve, an addi-
tional motor can be inserted to produce an additional
mechanical load on a drive shaft. In addition, mis-
alignment, looseness and unbalance can be produced
by the specific replacement of parts by less optimal or
specifically prepared ones.
4.2.2 Adapting the Controller Software for
Actuators
Based on knowledge about how certain failures (e.g.
motor problems due to wear) have an impact on an
actuator (reduced or unstable revolution speed), the
controller software can be designed such that it con-
trols the actuator in a way that it behaves as if it would
exhibit the failure. For example, the motor supply
voltage can be reduced following a certain pattern or
the frequency for the pulse-width modulation of mo-
tor power supply can be lowered to change the vibra-
tion pattern.
4.2.3 Simulating Defective Sensors and
Manipulating Signals
Faults related to a defect of a sensor are also quite
likely and can lead to high noise, drift or even the en-
tire signal loss. They could also have a significant
impact on the production process, in case the sensor
is used within the control procedure of the machine.
For example, a defective position switch might cause
problems, as a gripper is not able to adjust itself to
the correct position. Defective sensors can be easily
simulated as part of the control software by manipu-
lating the value they produce. Somewhat more diffi-
ICINCO 2019 - 16th International Conference on Informatics in Control, Automation and Robotics
46

Figure 2: Methodology and process for reproduction of fail-
ures.
cult is the manipulation of an existing sensor signal
to generate a known failure pattern without directly
producing this type of failure in the model. This ap-
proach could be useful if the fault is hard to reproduce
or requires components that are missing because of
model abstractions. For instance, bearing defects are
predictable based on occurring vibration frequencies
in the spectral range that is determined by the bear-
ing properties and its revolution per minute (rpm). To
simulate this defect, we can manipulate the original
vibration sensor signal by adding a sinusoidal signal
with the frequency of the failure to obtain the desired
amplitude peak in a spectral analysis.
4.3 Data Generation Process
The ways of generating faulty behavior described in
Sect. 4.2 have to be embedded into an overall genera-
tion process for maintenance data. Therefore, the fol-
lowing data generation process has been developed,
allowing to generate a large number of labelled main-
tenance data sets automatically. This process runs in
a loop consisting of four steps (see Fig. 2):
1. Selection of the particular error (e.g. motor fail-
ure due to wearing) to be produced in the current
run, including the relevant parameters (which mo-
tor, degree of wearing, failure pattern curve, time
horizon of wear process, etc.).
2. Configuration of the controller software to run the
factory in a mode, in which the respective fault
reproduction is enabled.
3. Start of the controller software to run the produc-
tion process. During the run of the factory, all data
is collected and stored in an Apache Cassandra
data base and labelled with the respective failure
being produced.
4. After the failure has occurred, the factory model
is reset to a defined initial state compensating for
any inconsistencies that might have resulted from
the insertion of the failure.
Figure 3: Schematic sketch of the conveyor belt unit of the
FT factory model’s sorting line.
4.4 Example Case
Failures of a conveyor belt are mostly related to its
pulleys, belt or drive unit. The parts of the latter, such
as an electric motor, a gearbox, couplings and bear-
ings are subject to wear with well-understood degra-
dation models and failure patterns. For instance, bear-
ing faults are the most common failure source with al-
most 40% to 50% of electrical motors. Typical for this
type of fault are vibration signatures of higher ampli-
tude peaks, increased noise, and also a reduced motor
torque and thus motor speed (Nandi et al., 2005).
To produce data to detect conveyor belt failures,
we use the conveyor belt unit of the FT factory
model’s sorting line, which is schematically sketched
in Fig. 3. This figure shows a bird’s-eye view of the
sorting line consisting of a conveyor belt, color sen-
sor and three pneumatic pushers to eject the work-
pieces into the color-related collection box. The five
dashed lines represent light barriers (LB) used in the
control software and are triggered when a workpiece
crosses them. The arrows represent the regular path of
a white workpiece. V1, V2 and V3 represent valves,
P is a pressure sensor, and As are acceleration sensors
mounted on the motor and compressor.
Transferring a bearing fault in the drive unit to
the previously described conveyor belt requires re-
producing the behavior that is generated by the de-
fect. Therefore, we first run the model in the reg-
ular mode (to collect data unaffected by faults) and
then the controller starts to simulate the previously
described failure effects by slowly reducing the mo-
tor speed over time and also decreasing the frequency
of the pulse-width modulation (PWM) of the motor
power. In the case of a conveyor belt drive motor,
the reduced speed, for example, leads to an increased
time for transport of the workpiece on the conveyor
belt. This results in longer delays until the respective
signals from the light barriers arrive. In addition, the
acceleration sensor for monitoring the condition of
the motor records higher vibration amplitudes (caused
by the decreased PWM frequency). These data are
recorded along with the data of all other sensors of the
Generation of Complex Data for AI-based Predictive Maintenance Research with a Physical Factory Model
47
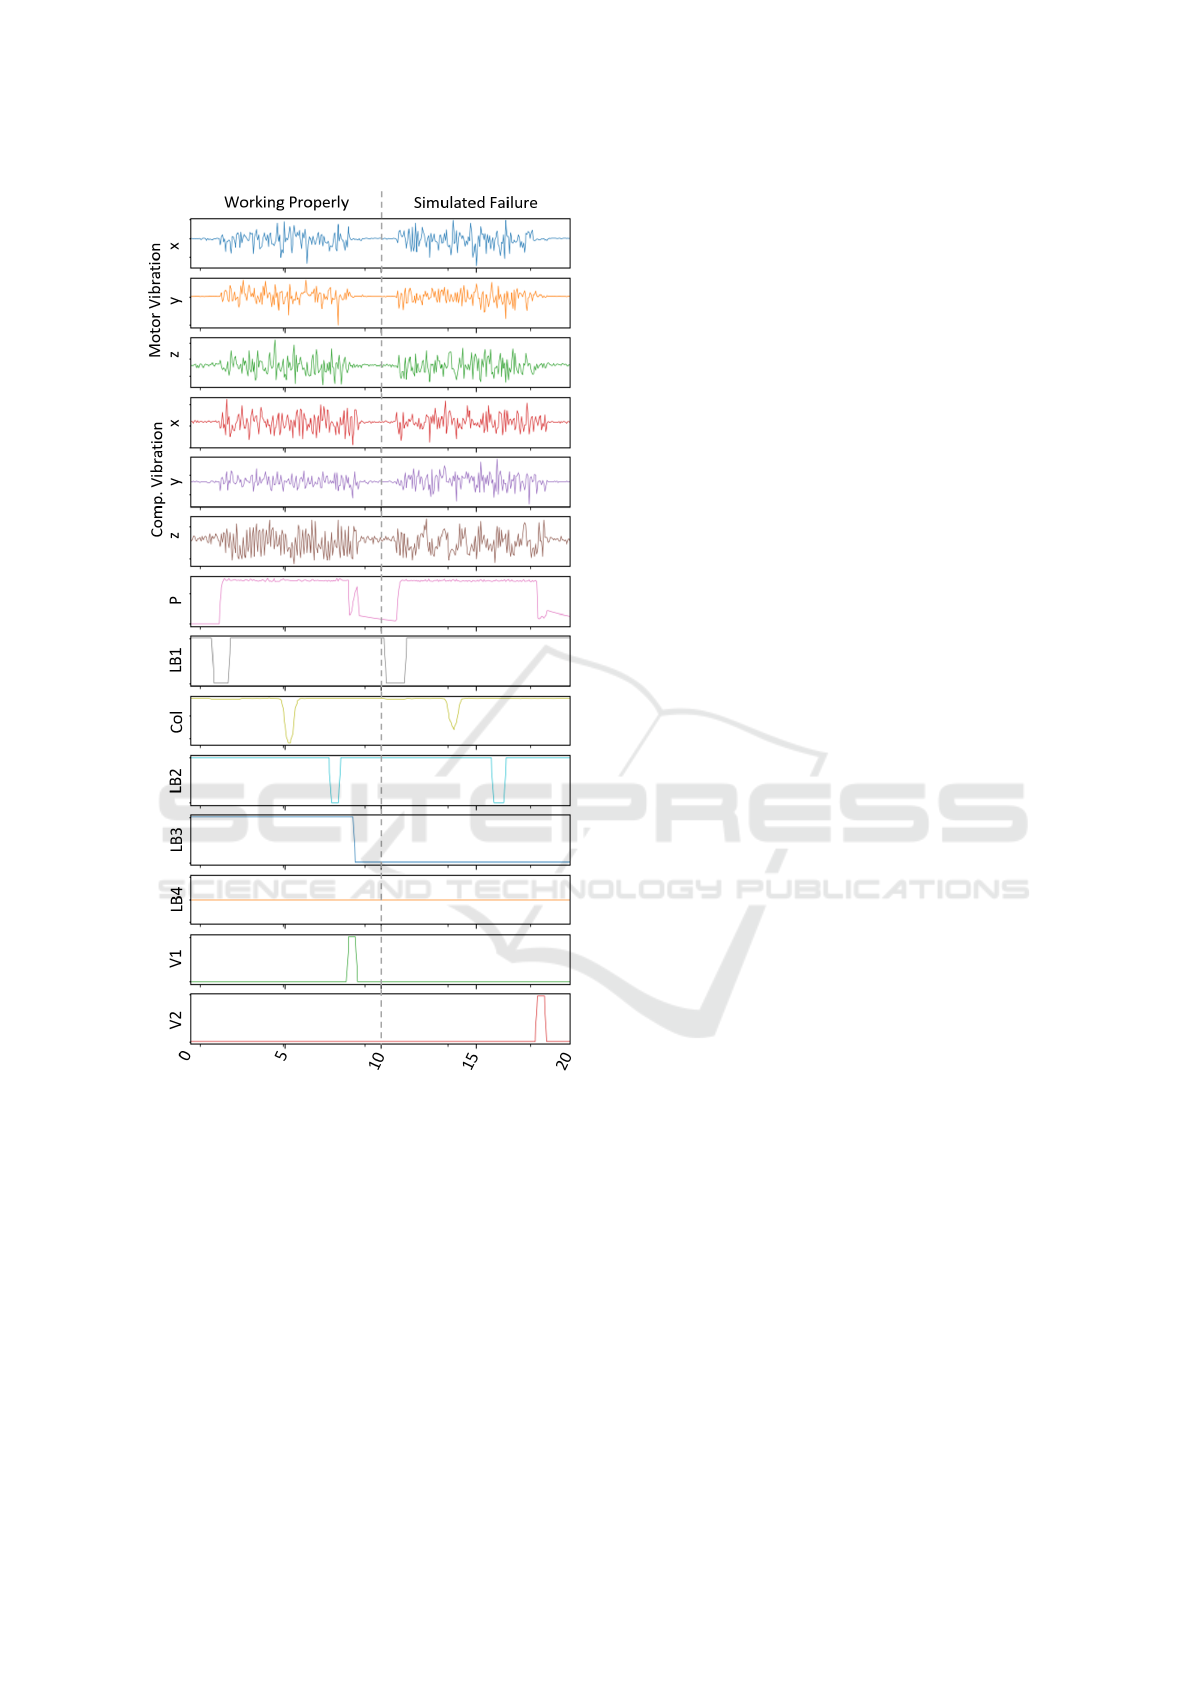
Figure 4: 20-second recording of the relevant sensor data
streams of the transport and sorting of two workpieces on
the conveyor belt depicted in Fig. 3.
factory model. Besides the apparent sensors that are
directly affected by the simulated failure, other sensor
signals might be affected as an indirect consequence.
In the end, appropriate data is available to address the
research challenges of AI-based PredM.
Fig. 4 shows a 20-second recording of the rele-
vant sensor data streams for the transport of a white
and a red workpiece on the conveyor belt with a sub-
sequent sorting into a collection box by a pneumatic
push as depicted in Fig. 3. The first three sensor data
streams are the vibrations on the x-, y- and z-axes
of the conveyor belt drive engine and the following
three time series are the vibrations of the compressor.
The seventh graph represents the air pressure (P) in
the pneumatic system. The eighth graph is the first
light barrier (LB1), and the tenth is the subsequent
light barrier (LB2) of the conveyor belt. The ninth
is the color detection (Col) between the light barri-
ers. The eleventh and twelfth graphs are the light
barriers (LB3 and LB4) of the collection boxes. The
last two graphs represent the valve (V1 and V2) open-
ing of the pneumatic pusher. The first 10 seconds of
the recording show a healthy condition (transport of
white workpiece), whereas the last 10 seconds show
the results of the simulated motor fault, which causes
a failure affecting the transport of the red workpiece.
The difference between these two states can be mea-
sured directly by the longer period between the two
light barrier downward peaks (LB1 and LB2) as well
as the higher vibration amplitudes. Furthermore, the
light barrier and color detection signals result in wider
gaps which can be seen as an indirect consequence
from the reduced motor torque. Moreover, the push
for sorting the workpiece into its color-related col-
lection box is carried out too early, so that the work-
piece remains on the conveyor belt and the collection
box’s light barrier (LB4) is not triggered. In summary,
the example shows that we can generate fault modes
with patterns distributed across multiple sensor sig-
nals from sensors additionally installed for condition
monitoring purposes as well as already existing ones
to control the manufacturing process.
5 CONCLUSION AND FUTURE
WORK
In this paper, we address the problem of data gen-
eration to enable ML research in combination with
knowledge-based approaches for PredM. We sur-
veyed currently available data sets and present sev-
eral approaches for data generation. We then present
a new approach for PredM data generation based on
a FT factory model. As of today, the mechanical and
electrical side of the model is nearly completely re-
alized, the sensor data is collected, processed, and
stored using the SMACK-Stack as described. First
failures, as the example case just described, are im-
plemented.
Future work will address the implementation of a
comprehensive set of failure scenarios based on the
approaches described in Sect. 4.2. This work is quite
difficult as it requires at least a basic understanding
of typical faults and their consequences in order to be
able to reproduce them on the model. However, we
assume that for the development of ML methods for
ICINCO 2019 - 16th International Conference on Informatics in Control, Automation and Robotics
48

PredM the exact reproduction of patterns from real
industrial factories is not required, as the goal of ML
methods is to find patterns according to the produc-
tion environment at hand. Thus, we are confident
that the developed FT factory model is an appropri-
ate means to perform laboratory research on ML in a
well controlled environment. We also plan to publish
the gained data sets at http://IoT.uni-trier.de so that
they could be used by other researchers as well.
REFERENCES
Abele, E., Metternich, J., Tisch, M., Chryssolouris, G.,
Sihn, W., ElMaraghy, H., Hummel, V., and Ranz, F.
(2015). Learning factories for research, education,
and training. Procedia CiRp, 32:1–6.
Alzantot, M., Chakraborty, S., and Srivastava, M. (2017).
Sensegen: A deep learning architecture for synthetic
sensor data generation. In Pervasive Computing and
Communications Workshops (PerCom Workshops),
2017 IEEE International Conference on, pages 188–
193. IEEE.
Angione, G., Barbosa, J., Gosewehr, F., Leit
˜
ao, P., Massa,
D., Matos, J., Peres, R. S., Rocha, A. D., and Wer-
mann, J. (2017). Integration and deployment of a dis-
tributed and pluggable industrial architecture for the
perform project. Procedia Manufacturing, 11:896–
904.
Babu, G. S., Zhao, P., and Li, X.-L. (2016). Deep convo-
lutional neural network based regression approach for
estimation of remaining useful life. In International
conference on database systems for advanced appli-
cations, pages 214–228. Springer.
Dua, D. and Graff, C. (2019). UCI machine learning repos-
itory.
Eker,
¨
O. F., Camci, F., and Jennions, I. K. (2012). Ma-
jor challenges in prognostics: study on benchmark-
ing prognostic datasets. In Proceedings of the Annual
Conference of the PHM Society. PHM Society.
Esteban, C., Hyland, S. L., and R
¨
atsch, G. (2017). Real-
valued (medical) time series generation with recurrent
conditional gans. arXiv preprint arXiv:1706.02633.
Estrada, R. and Ruiz, I. (2016). Big data smack. Apress,
Berkeley, CA.
Hahsler, M., Bola
˜
nos, M., and Forrest, J. (2017). Intro-
duction to stream: An extensible framework for data
stream clustering research with r. Journal of Statisti-
cal Software, Articles, 76(14):1–50.
Heged
˝
us, C., Varga, P., and Moldov
´
an, I. (2018). The man-
tis architecture for proactive maintenance. In 2018 5th
International Conference on Control, Decision and
Information Technologies (CoDIT), pages 719–724.
IEEE.
Jain, S., Shao, G., and Shin, S.-J. (2017). Manufactur-
ing data analytics using a virtual factory representa-
tion. International Journal of Production Research,
55(18):5450–5464.
Jia, X., Huang, B., Feng, J., Cai, H., and Lee, J. (2018). A
review of phm data competitions from 2008 to 2017.
In Proceedings of the Annual Conference of the PHM
Society.
Khan, S. and Yairi, T. (2018). A review on the application of
deep learning in system health management. Mechan-
ical Systems and Signal Processing, 107:241–265.
Klein, P. and Bergmann, R. (2018). Data Generation with
a Physical Model to Support Machine Learning Re-
search for Predictive Maintenance. In Lernen. Wis-
sen. Daten. Analysen. (LWDA 2018). CEUR Work-
shop Proceedings.
Kreps, J., Narkhede, N., Rao, J., et al. (2011). Kafka: A
distributed messaging system for log processing. In
SIGMOD Workshop on Networking Meets Databases.
Lang, S., Reggelin, T., Jobran, M., and Hofmann, W.
(2018). Towards a modular, decentralized and digital
industry 4.0 learning factory. In 2018 Sixth Interna-
tional Conference on Enterprise Systems (ES), pages
123–128. IEEE.
Lee, J., Kao, H.-A., and Yang, S. (2014). Service innovation
and smart analytics for industry 4.0 and big data envi-
ronment. Procedia CIRP, 16:3 – 8. Product Services
Systems and Value Creation. Proceedings of the 6th
CIRP Conference on Industrial Product-Service Sys-
tems.
Nandi, S., Toliyat, H. A., and Li, X. (2005). Condition
monitoring and fault diagnosis of electrical motors —
a review. IEEE transactions on energy conversion,
20(4):719–729.
Nectoux, P., Gouriveau, R., Medjaher, K., Ramasso, E.,
Chebel-Morello, B., Zerhouni, N., and Varnier, C.
(2012). Pronostia: An experimental platform for bear-
ings accelerated degradation tests. In IEEE Interna-
tional Conference on Prognostics and Health Man-
agement, PHM’12, pages 1–8. IEEE Catalog Number:
CPF12PHM-CDR.
Saxena, A., Goebel, K., Simon, D., and Eklund, N. (2008).
Damage propagation modeling for aircraft engine run-
to-failure simulation. In Prognostics and Health Man-
agement, 2008. PHM 2008. International Conference
on, pages 1–9. IEEE.
Selcuk, S. (2017). Predictive maintenance, its implementa-
tion and latest trends. Proceedings of the Institution of
Mechanical Engineers, Part B: Journal of Engineer-
ing Manufacture, 231(9):1670–1679.
Simons, S., Ab
´
e, P., and Neser, S. (2017). Learning in the
autfab–the fully automated industrie 4.0 learning fac-
tory of the university of applied sciences darmstadt.
Procedia Manufacturing, 9:81–88.
von Birgelen, A., Buratti, D., Mager, J., and Niggemann,
O. (2018). Self-organizing maps for anomaly local-
ization and predictive maintenance in cyber-physical
production systems. Procedia CIRP, 72:480 – 485.
51st CIRP Conference on Manufacturing Systems.
Yuan, M., Wu, Y., and Lin, L. (2016). Fault diagnosis and
remaining useful life estimation of aero engine using
lstm neural network. In Aircraft Utility Systems (AUS),
IEEE International Conference on, pages 135–140.
IEEE.
Zhang, D., Xu, B., and Wood, J. (2016). Predict failures in
production lines: A two-stage approach with cluster-
Generation of Complex Data for AI-based Predictive Maintenance Research with a Physical Factory Model
49

ing and supervised learning. In Big Data (Big Data),
2016 IEEE International Conference on, pages 2070–
2074. IEEE.
Zhao, R., Yan, R., Chen, Z., Mao, K., Wang, P., and Gao,
R. X. (2016). Deep learning and its applications to
machine health monitoring: A survey. arXiv preprint
arXiv:1612.07640.
ICINCO 2019 - 16th International Conference on Informatics in Control, Automation and Robotics
50
