
Check-in Counters Management: The Case Study of Lisbon Airport
Ludovica Adacher
1 a
and Marta Flamini
2 b
1
Engineering Department, Roma Tre University, via della Vasca Navale 79, Rome, Italy
2
Faculty of Engineering, International Telematic University UNINETTUNO, Rome, Italy
Keywords:
Check-in, Cost Minimization, Passenger Satisfaction Maximization, Heuristics.
Abstract:
In this paper the problem of assigning check-in counters to flights in a Zone of Lisbon airport is addressed at
an early stage. Real traffic scenario and simulation of passengers behaviour and characteristics are considered.
The aim is to minimize an objective function that takes into consideration the managing cost of opening check-
in counters and the passengers’ cost of waiting to be served by the check-in operator. This latter cost function
has been modelled by considering the International Air Transport Association level of service perceived by
the passengers. Since the performances depend on the passengers’ behaviour and characteristics, simulation
is used to compute the value of the objective function. Two optimization heuristic procedures have been tested
and their results compared.
1 INTRODUCTION
Airport land side processes involve several types of
resources and services whose performance affect the
costs of the airport management and of the airlines,
but also the passengers’ satisfaction.
In this paper a first step of a more complex study
for solving the problem of assigning check-in coun-
ters to flights is proposed. The aim is to minimize
the check-in counters opening costs and the passen-
gers discomfort due to the waiting time in line. Au-
thors study the real case of Lisbon airport, where real
air traffic is considered and realistic passenger flow is
simulated.
Several authors have addressed problems concern-
ing Check-in opening optimization (Appelt et al.,
2007), (Hsu et al., 2012). Models and solution ap-
proach are different. Real scenarios have been repre-
sented by mean of linear programming models to plan
the check-in operations (Stolletz, 2010) and to opti-
mize associated costs (Al-Sultan, 2016). A combina-
tion of linear programming and simulation have been
addressed to optimizing the costs and performing a
certain service level (Araujo and Repolho, 2015).
Simulation constitutes a valid instrument to model
passengers specific characteristics and to represent
stochastic passengers behaviour that constitute the
a
https://orcid.org/0000-0002-0215-798X
b
https://orcid.org/0000-0002-5266-8809
input of an optimization approach ((Adacher et al.,
2017), (Mota and Alcaraz, 2015), (Mota, 2015)).
Many authors address the problem of customer satis-
faction by considering service quality indicators mod-
eled in different cost functions ((Manataki and Zo-
grafos, 2009), (Caot et al., 2003), (Ju et al., 2007),
(Bruno and Genovese, 2010), (Parlar et al., 2013),
(Su
´
arez-Alem
´
an and Jim
´
enez, 2016)).
In this paper authors combine simulation and op-
timization techniques to solve the problem of assign-
ing check-in counters to the flights in a given time
interval, optimizing costs, by considering passengers
discomfort and by introducing cost coefficients that
depend on levels of service. The levels of service de-
pend on the length of the queues in terms of waiting
time and are derived by the International Air Trans-
port Association standards (IATA, 2014). Simulation
provides the cost objective function value after mod-
eling and processing passengers characteristics and
behaviour. At this first stage, optimization algorithms
are very simple. Results output by a greedy algo-
rithm, completed by a local search procedure, and by
a genetic algorithm have been compared. The former
easily suites the bicriteria aspect of the problem (and
of the objective function), the latter is implemented
in several simulation tools and allows the solution to
avoid local minima.
The paper is organized as follows: Section 2
presents the problem description. In section 3 the two
heuristic procedures are briefly described. In Section
228
Adacher, L. and Flamini, M.
Check-in Counters Management: The Case Study of Lisbon Airport.
DOI: 10.5220/0007834302280234
In Proceedings of the 16th International Conference on Informatics in Control, Automation and Robotics (ICINCO 2019), pages 228-234
ISBN: 978-989-758-380-3
Copyright
c
2019 by SCITEPRESS – Science and Technology Publications, Lda. All rights reserved
4 tests are described and results are reported and ana-
lyzed. Section 5 is dedicated to the conclusion and to
the description of the future development of the study.
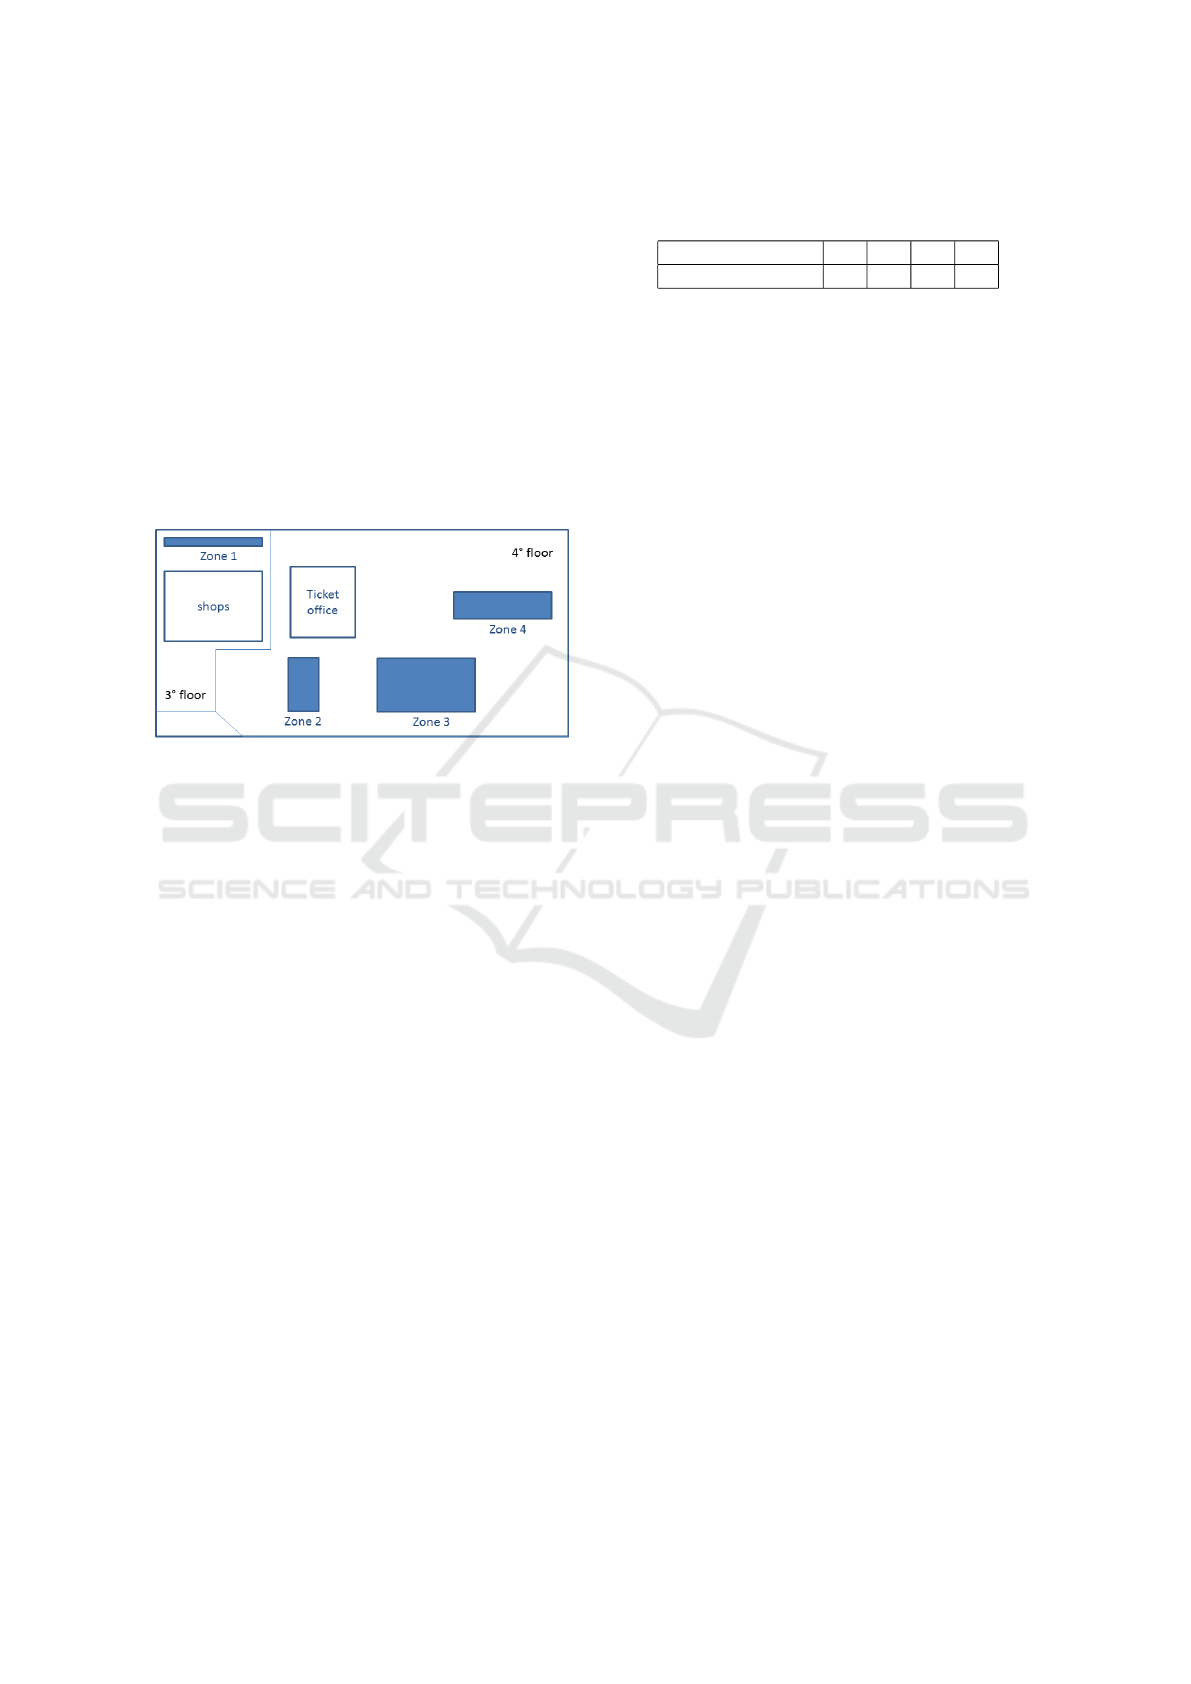
2 PROBLEM DESCRIPTION
The problem of assigning the check-in counters of a
Zone of the Lisbon airport is addressed. The airport
is formed by two terminal areas, the second is dedi-
cated to the domestic flights and the check-in area is
composed by four Zones in which 107 counters are
located (see Figure 1).
Figure 1: Layout of check-in area.
This paper focuses on the optimization of Zone
3, hosting 58 check-in counters, but the same model
and solution approach can be easily extended to the
whole area. The problem consists in assigning a set of
check-in counters C to a set of flights F in a given time
interval T , optimizing costs. The time interval is as-
sumed to be discrete and divided in time slots, each of
15 minutes. Total costs are given by the costs of open-
ing the check-in counters plus the cost of passengers’
discomfort that depends on the length of the queues.
The objective function is reported below, where
• C
1
represents the unit cost of opening a check-in
counter in a time slot,
• C
2
(w
p
) represents the cost of the discomfort of
passenger p,
• w
p
is the waiting time (minutes) in line for pas-
senger p,
• y
ct
is equal to one if the check-in counter c is open
in the time slot t.
OF = min{
|C|
∑
c=1
T
∑
t=1
C
1
y
ct
+
|P|
∑
p=1
C
2
(w
p
)}
The decision variable is x
f ct
and it is equal to 1 if
the flight f is assigned to the check-in counter c for
the slot time t.
Table 1: Levels of service and corresponding waiting times
(min).
Level of Service A B C D
Max waiting time 10 25 40 60
x
f ct
=
1 if flight f is processed by check-in
counter c in the time slot t
for f = 1 . . . |F|, c = 1 . . . |C|, t = 1 . . . T
0 otherwise
(1)
When all flights have been assigned it is possible to
calculate w
p
and y
ct
. w
p
is calculated by simulation,
while y
ct
is calculated by the relation below:
y
ct
=
(
1 if
∑
|F|
f =1
x
f ct
≥ 1,
0 otherwise.
Constraints can be summed up as follows:
• the number of check-in counters is limited to C
max
• each flight must be processed by at least one
check-in counter
• if a flight f is processed by a check-in counter c
in a time slot t (x
f ct
= 1) the check-in counter c
must be active in the time slot t (y
ct
= 1)
• the check-in operation for a flight must last 120
minutes (8 consecutive slots)
• the check-in operation for a flight must be com-
pleted 20 minutes before the take-off
• each passenger that arrives by 20 minutes before
the take-off must be processed
• the length of the queue for the check-in operation
is limited by the space dimension (no more than
45 people can wait in a queue)
C
2
is neither constant, nor linear: it is a waiting
time-dependent step function that will be described in
Section 4. An additional aspect is represented by the
level of service of a solution. The level of service has
been standardized by the International Air Transport
Association (IATA) and can be defined as Excellent
(A), High (B), Good (C) and Adequate (D). In Table 1
the relation between the levels of service and the max-
imum waiting time (in minutes) in line are reported.
The objective function value is calculated by sim-
ulation, since it depends on the passengers arrivals,
on their distribution in the lines and on their charac-
teristics, such as the number of luggage that affect the
check-in operator service time.
As already mentioned while listing the con-
straints, each flight f must be processed by a check-in
Check-in Counters Management: The Case Study of Lisbon Airport
229

counter for 120 minutes (8 time slots). This time in-
terval can be denoted by τ
f
.
3 HEURISTICS
In this section the description of two heuristic pro-
cedures is provided. A greedy heuristic with a local
search algorithm is presented. It is very fast and eas-
ily addresses the simultaneous minimization of oper-
ational costs and of passengers’ discomfort costs. A
basic genetic algorithm has been implemented to test
the procedure embedded in several simulation tools.
Its performance have been compared to the results ob-
tained by a standard genetic algorithm. Both the pro-
cedures are sketched below.
3.1 Greedy Heuristic + Local Search
Before briefly describing the main steps of the heuris-
tic procedure, the definition of set X
f
is provided.
Given a flight f the set X
f
is formed by all the flights
f
0
of the same airline, such that τ
f
and τ
f
0
overlap.
The heuristic can be summed up in the steps in Algo-
rithm 1. It is composed by two phases, the first imple-
menting the greedy procedure and the second execut-
ing the local search procedure. The greedy phase tries
to assign a set of check-in counters for each flight, so
that the maximum length of the queue is under a tol-
erable threshold. The local search phase tries to im-
prove the solution.
3.2 Genetic Heuristic
This heuristic is a standard genetic algorithm, whose
main steps are reported in Algorithm 2. After generat-
ing the initial population of cardinality S, by a random
assignment of the check-in counters to all the consid-
ered flights, a cyclic subroutine selects two parents
that will generate the new population, till the stop cri-
teria are met. The probability of each individual to be
selected for the reproduction is proportional to their
Fitness value. In such way the best individuals have
a higher probability to transmit their genetic inheri-
tance. The two operators that generate the new popu-
lation from the parents are:
• The Crossover operator combines the genetic in-
heritance of the parents to generate new individu-
als. Each children is composed by two parts, each
one belonging to one of the two parents. The CR
is the rate of crossover. Each crossover operation
generates two children.
Algorithm 1: Greedy heuristic and Local search.
1: Given the F Set of flights
2: Given |C| Total number of the check-in
counters
3: Given K K is the maximum length of the queue
C
ass
= 0 Counter: it counts the number of
assigned check-in desks Greedy heuristic
phase
4: Order F with respect to the increasing departure
times
5: for (each f ∈ F) do
6: Generate X
f
; X
f
is the set of all
the flights f
0
∈ F of the same airline, such that τ
f
and τ
f
0
overlap
7: end for
8: for (each f ∈ F) do
9: Assign to f a check-in counter list CKC
f
, one
every K passengers;
10: C
ass
= C
ass
+ |CKC
f
|; Total number of
check-in counters assigned till f
11: while (C
ass
> |C|) do
12: Remove a check-in counter from the list
13: of a previous flight f
0
such that f
0
∈ X
f
14: and |CKC
f
0
| ≥ 2;
15: C
ass
= C
ass
− 1;
16: end while
17: Construct CKC Form CKC from all the
CKC
f
assigned and modified till now
18: end for
Local search phase
19: Fix L L is the maximum number of iterations
20: for (l ≤ L) do
21: Select randomly a flight f such that |CKC
f
| ≥
2;
22: Remove a check-in counter from |CKC
f
|;
23: Assign it to a flight in X
f
;
24: Construct CKC;
25: end for
26: Return the best CKC.
• The Mutation operator changes casually one or
more components of a individual. The mutation
operator is applied only with a certain probability,
called mutation rate MR. The number of children
that are generated by the mutation operator de-
pends on the number of individuals generated by
the crossover operator. The new population will
have the same cardinality of the initial one (S).
ICINCO 2019 - 16th International Conference on Informatics in Control, Automation and Robotics
230

Algorithm 2: Genetic heuristic.
1: Given I I is the maximum number of iteration
of the algorithm
2: Given RC CR is the rate of crossover
3: Generate P = {p
1
, p
2
, . . . p
S
} The initial
population of feasible solutions of cardinality S
4: for (i ≤ I) do
5: for (s ≤ S) do
6: Compute Fitness(p
s
) The Fitness
function is the objective function of the problem
7: Select the two parents p
m
and p
f
in P with
the best Fitness function values
8: Update p
∗
p
∗
is the individual with the
best Fitness function value
9: CC = Crossover (p
m
, p
f
, CR); CC set
of individuals derived from the Crossover
10: M = Mutation (MR) M set of
individuals derived from the Mutation
11: P = CC ∪ M
12: end for
13: i = i + 1
14: end for
15: Return p
∗
4 RESULTS AND ANALYSIS
4.1 Instances Definition
This section presents the problem parameters, the in-
stances assumptions and the analysis of the results. In
order to simulate the passenger flow it is necessary to
introduce the following assumptions:
Figure 2: Daily arrival distribution.
• Discretization of the problem: the time horizon T
is divided into intervals with constant duration t.
The problem becomes a discrete problem, and all
the parameters and variables are referred to each
interval t. The simulation time is divided into time
slots, each of 15 minutes.
• Flights distribution: the distribution of the flights
in a day is shown in Figure 2. The trend reported
reproduces the daily performance of the Lisbon
Airport, the peak of arrivals is between 11 am and
16 am. Different numbers of flights are daily con-
sidered for the tests (73 to model low traffic, 105
for medium traffic and 130 for high traffic).
• Arrivals distribution: check-in service demand
can be expressed in terms of passengers arrival,
represented by stochastic variables. The passen-
gers arrival distribution is shown in Figure 3 that
depicts the arrival pattern in the time interval be-
fore the flight departure. Two different cases are
tested. The first represents an homogeneous dis-
tribution of passengers per flight: the passengers
are characterized by a Gaussian distribution (µ =
60, σ = 20); the second models an heterogeneous
distribution: the passengers are characterized by a
Gaussian distribution (µ = 60, σ = 40).
• Passenger types: two types of passengers are here
considered: business, travelling alone and with at
most one baggage; tourist travelling alone or in
groups up to 2 people carrying one or two luggage
each. 20% of the passengers are business passen-
gers while 80% are tourist passengers (30% with
one luggage and 50% with two luggage).
• Service time: service time represents the time
needed to process the passenger. At the Check-in
counter, the processing time depends on the num-
ber of bags. No bags needs 1 minute, one bag
needs 1.5 minute and 2 bags need 2 minutes to be
processed.
The maximum number of Check-in counters that
can be opened is 58.
Considering the quality service given by the IATA,
the unit costs to evaluate the objective function are
fixed:
• the managing cost of a single check-in counter is
equal to C
1
= 20 euro/slot;
• the cost for the passengers’ waiting time w
p
has
been set to the following step function:
C
2
=
0 if w
p
≤ 10
15 if 11 ≤ w
p
≤ 25
25 if 26 ≤ w
p
≤ 40
40 if 41 ≤ w
p
≤ 60
80 if w
p
≥ 61
(2)
This cost function is a result of the simulation
tests. It guarantees a balanced distribution of the costs
in the two terms related to the check-in counters open-
ing and passengers’ discomfort. This issue is verified
in the following analysis of the solution costs, that are
similar with respect to the two heuristic procedures,
and balanced with respect to the two cost items.
Check-in Counters Management: The Case Study of Lisbon Airport
231
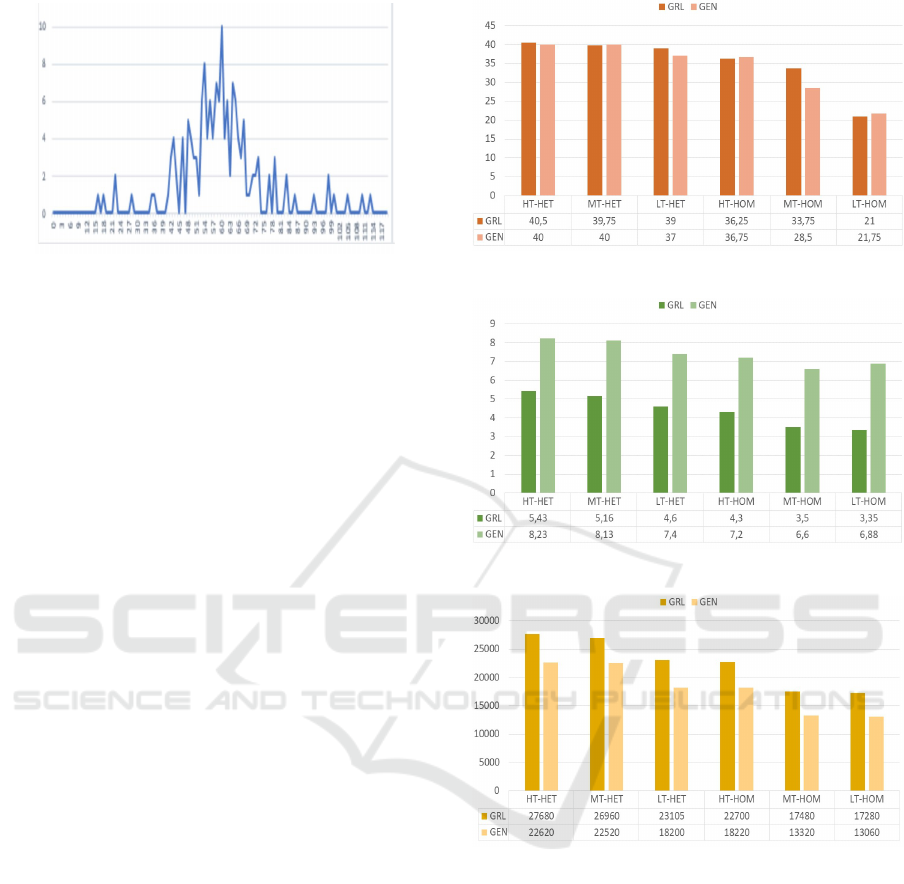
Figure 3: Passengers arrival distribution.
4.2 Time and Cost Analysis
In this section a comparison between the two pro-
posed heuristics is shown. For the Greedy heuris-
tic, K has been set to 35 and represents the thresh-
old that takes into consideration an acceptable level
of service. On the basis of test bed, the configuration
below was adopted for the genetic algorithm: Num-
ber of iterations 50, Population Size 20, Crossover
Rate CR ∈ [0.4; 0.8], Mutation Rate 0.1. The results
reported in the following are the mean values calcu-
lated on 10 different runs with the same probability
distribution of the simulation parameters.
The following notation can be introduced:
• GRL stands for Greedy heuristic plus local search;
• GEN stands for Genetic heuristic;
• HET stands for heterogeneous distribution for
passengers;
• HOM stands for homogeneous distribution for
passengers
• HT-MT-LT mean High, Medium and Low traffic.
In all cases the two heuristics give the best per-
formances when the arrivals are homogeneously dis-
tributed.
In Figure 4 and in Figure 5 the maximum and the
average waiting time generated by the two heuristics
are reported. As for the maximum waiting time the
two heuristics present the same trend. When the aver-
age waiting time is considered the GRL gives the best
performances. This is due to the fact that the greedy
heuristic only focuses on the customer satisfaction
opening a new check-in counter when the queue be-
comes too long with respect to the fixed threshold oh
35 people. The total costs are optimized by the local
search.
In Figure 6 the trend of the check-in costs is re-
ported. Here the GEN optimizes the managing costs
since the GRL considers especially the passengers sat-
isfaction. The GEN gives better performances and its
Figure 4: Max waiting time (minutes).
Figure 5: Average waiting time (minutes).
Figure 6: Cost of opening check-in counters.
improvement is around 20%−30% for all cases when
considering all the flights of a day.
In Figure 7 the total cost trend is shown and is rep-
resented in thousands of euros. The Genetic heuristic
gives better performances and these results confirm
its ability to jump out of local minima and to solve
complex problems. Considering the total cost the im-
provement of GEN respected to the GRL is around
3% − 9% for all cases when considering all the flights
in a day.
In Figure 8, 9 and 10 the level of service of the so-
lutions is reported with reference to the heterogeneous
passenger distribution. The trend of the solutions is
similar when considering the homogeneous case. As
highlighted before, the GEN gives the best perfor-
ICINCO 2019 - 16th International Conference on Informatics in Control, Automation and Robotics
232
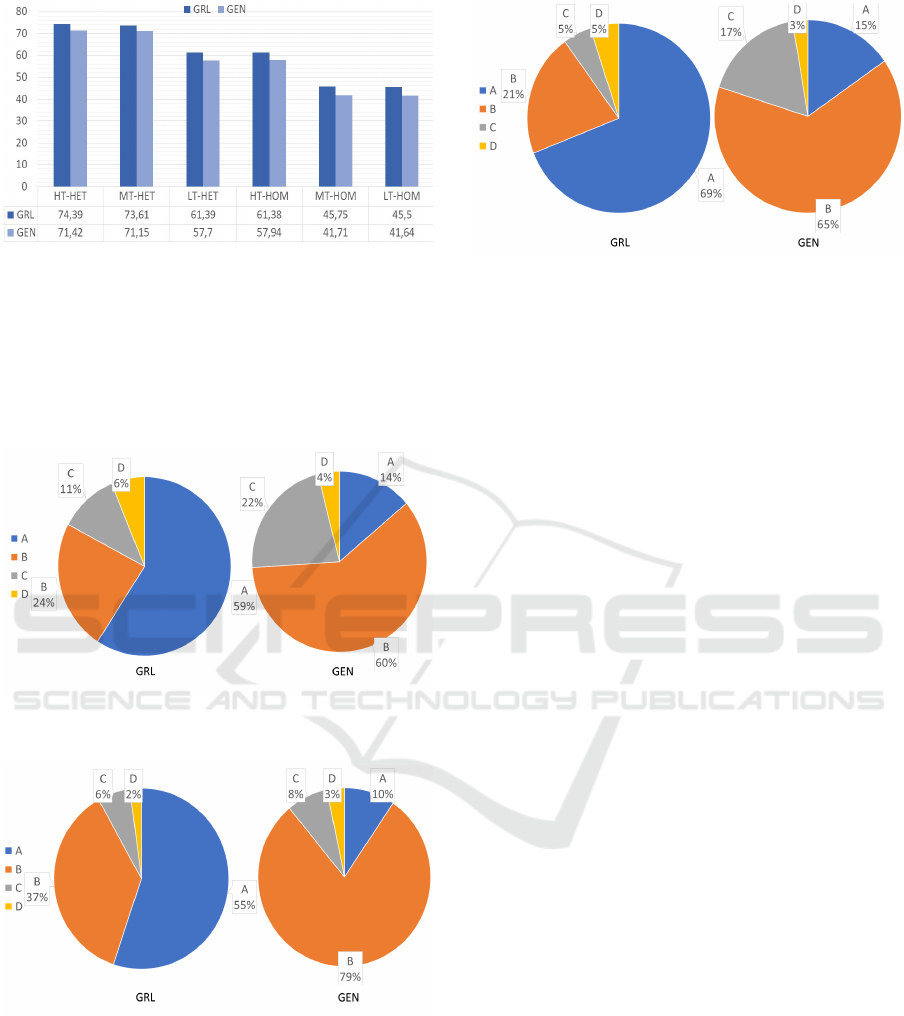
Figure 7: Objective function values (K).
mances in terms of total costs but when the level of
service is considered the GRL output optimizes pas-
sengers’ satisfaction. In all cases more the 55% of the
solution is Excellent (A), instead for the GEN solu-
tion quality is High (B).
Figure 8: Level of service for High traffic and heteroge-
neous passenger distribution.
Figure 9: Level of service for Medium traffic and heteroge-
neous passenger distribution.
5 CONCLUSION AND FUTURE
RESEARCH
In this paper authors address the problem of optimiz-
ing costs of opening and assigning check-in counters
to a set of flights in a given time interval. Besides
Figure 10: Level of service for Low traffic and heteroge-
neous passenger distribution.
the classical cost term due to the check-in counters
opening operations, the objective function models the
passenger discomfort costs integrated with the level
of service performed. The real case of the Lisbon air-
port has been considered. In this preliminary phase
two heuristic procedures have been tested and costs
and waiting times have been compared. The future of
this study will model other aspects of the airport and
of the passengers and will consider more performing
optimization techniques.
REFERENCES
Adacher, L., Flamini, M., Guaita, M., and Romano, E.
(2017). A model to optimize the airport terminal de-
parture operations. Transportation Research Proce-
dia, 27:53–60.
Al-Sultan, A. T. (2016). Optimization of airport check-
in scheduling at passenger terminal. International
Journal of Applied Business and Economic Research,
14:3233–3245.
Appelt, S., Batta, R., Lin, L., and Drury, C. (2007). Sim-
ulation of passenger check-in at a medium-sized us
airport. In 2007 Winter Simulation Conference, pages
1252–1260. IEEE.
Araujo, G. E. and Repolho, H. M. (2015). Optimizing the
airport check-in counter allocation problem. Journal
of Transport Literature, 9(4):15–19.
Bruno, G. and Genovese, A. (2010). A mathematical model
for the optimization of the airport check-in service
problem. Electronic Notes in Discrete Mathematics,
36:703–710.
Caot, Y., Nsakanda, A., and Pressman, I. S. (2003). A sim-
ulation study of the passenger check-in system at the
ottawa international airport.
Hsu, C.-I., Chao, C.-C., and Shih, K.-Y. (2012). Dynamic
allocation of check-in facilities and dynamic assign-
ment of passengers at air terminals. Computers & In-
dustrial Engineering, 63(2):410–417.
IATA (2014). Airport development reference man-
ual. www.iata.org/publications/Documents/adrm10-
toc-20161021.pdf.
Check-in Counters Management: The Case Study of Lisbon Airport
233

Ju, Y., Wang, A., and Che, H. (2007). Simulation and op-
timization for the airport passenger flow. In 2007 In-
ternational Conference on Wireless Communications,
Networking and Mobile Computing, pages 6605–
6608. IEEE.
Manataki, I. E. and Zografos, K. G. (2009). A generic
system dynamics based tool for airport terminal per-
formance analysis. Transportation Research Part C:
Emerging Technologies, 17(4):428–443.
Mota, M. M. (2015). Check-in allocation improvements
through the use of a simulation–optimization ap-
proach. Transportation Research Part A: Policy and
Practice, 77:320–335.
Mota, M. M. and Alcaraz, C. Z. (2015). Alloca-
tion of airport check-in counters using a simulation-
optimization approach. In Applied Simulation and Op-
timization, pages 203–229. Springer.
Parlar, M., Rodrigues, B., and Sharafali, M. (2013). On the
allocation of exclusive-use counters for airport check-
in queues: static vs. dynamic policies. Opsearch,
50(3):433–453.
Stolletz, R. (2010). Operational workforce planning for
check-in counters at airports. Transportation Re-
search Part E: Logistics and Transportation Review,
46(3):414–425.
Su
´
arez-Alem
´
an, A. and Jim
´
enez, J. L. (2016). Quality as-
sessment of airport performance from the passengers’
perspective. Research in transportation business &
management, 20:13–19.
ICINCO 2019 - 16th International Conference on Informatics in Control, Automation and Robotics
234
