
Genetic Algorithm to Detect Different Sizes’ Communities from
Protein-Protein Interaction Networks
Marwa Ben M’Barek
1,3 a
, Amel Borgi
1,2
, Sana Ben Hmida
3 b
and Marta Rukoz
3
1
LIPAH, Faculté des Sciences de Tunis, Université de Tunis El Manar2092, Tunis, Tunisia
2
Institut Supérieur d'Informatique, Université de Tunis El Manar, 1002, Tunis, Tunisia
3
LAMSADE CNRS UMR 7243, Paris Dauphine University, PSL Research University,
Place du Maréchal de Lattre de Tassigny, Paris, France
Keywords: Community Detection, Genetic Algorithm, Semantic Similarity, Protein-Protein or Gene-Gene Interaction
Networks, Gene Ontology.
Abstract: The community detection in large networks is an important problem in many scientific fields ranging from
Biology to Sociology and Computer Science. In this paper, we are interested in the detection of communities
in the Protein-protein or Gene-gene Interaction (PPI) networks. These networks represent protein-protein or
gene-gene interactions which corresponds to a set of proteins or genes that collaborate at the same cellular
function. The goal is to identify such communities from gene annotation sources such as Gene Ontology. We
propose a Genetic Algorithm based approach to detect communities having different sizes from PPI networks.
For this purpose, we use a fitness function based on a similarity measure and the interaction value between
proteins or genes. Moreover, a specific solution for representing a community and a specific mutation operator
are introduced. In the computational tests carried out in this work, the introduced algorithm achieved excellent
results to detect existing or even new communities from Protein-protein or Gene-gene Interaction networks.
1 INTRODUCTION
Community detection in networks is one of the most
popular topics of modern network science (Fortunato
and Hric, 2016). It deals with an interesting
computational technique for the analysis of networks.
It can yield useful insights into the structural
organization of a network and can serve as a basis for
understanding the correspondence between structure
and function (specific to the domain of the network).
Identifying the community structure allows us to
obtain some important information about the
relationship and interaction among nodes.
In this paper, we are interested in detecting
communities in biological networks. These networks
have received much attention in the past few years
since they model the complex interactions occurring
among different components in the cell (Pizzuti and
Rombo, 2014). We mainly focus on Protein-protein
or Gene-gene interaction networks known as PPI
networks. Their nodes correspond to proteins or
a
https://orcid.org/0000-0002-8307-3533
b
https://orcid.org/0000-0003-4202-613X
genes and the edges correspond to pairwise
interactions between genes or proteins. These
communities give us an idea about the perception of
the network’s structure. The ultimate goal in biology
is to determine how genes or proteins encode function
in the cell. This work is multidisciplinary as it brings
the field of biology and computer science in the broad
sense.
Thus, the goal is to find communities having a
biological sense (that participate in the same
biological processes or that perform together specific
biological functions) from gene annotation sources.
To make this task, we have combined three levels of
information:
1. Semantic level: information contained in biological
ontologies such as Gene Ontology GO (Ashburner et
al., 2000) and information obtained by the use of a
similarity measure such as GS2 (Ruths et al., 2009),
it assess the semantic similarity between proteins or
genes.
Ben M’Barek, M., Borgi, A., Ben Hmida, S. and Rukoz, M.
Genetic Algorithm to Detect Different Sizes’ Communities from Protein-Protein Interaction Networks.
DOI: 10.5220/0007836703590370
In Proceedings of the 14th International Conference on Software Technologies (ICSOFT 2019), pages 359-370
ISBN: 978-989-758-379-7
Copyright
c
2019 by SCITEPRESS – Science and Technology Publications, Lda. All rights reserved
359

2. Functional level: information contained in public
databases describing the interactions of proteins or
genes such as Search Tool for Recurring Instances of
Neighbouring Gene (STRING) database (Mering et
al., 2003).
3. Networks level: information contained in pathway
databases that present community of proteins or genes
such as KEGG database (Kanehisa and Goto, 2000).
In (Guo et al., 2006), the performed tests revealed
that genes or proteins in the same community of the
biological pathway database KEGG are semantically
similar and are interacting. From this affirmation, we
have proposed to take into account the similarity
between proteins or genes that are annotated by terms
of Gene Ontology (GO). In a previous work, we have
tested different similarity measures to determine the
most suitable one for this problem that is GS2 (Ben
M'barek et al., 2018).
A lot of research effort has been put into
community detection in different academic fields
such as physics, mathematics and computer science.
Meanwhile, various algorithms based on Genetic
Algorithms (GA) have been proposed. These
algorithms are used to overcome some drawbacks
such as scaling up of network size. Indeed some of
the community detection algorithms are unsuitable
for very large networks and require a priori
knowledge about the community structure, as the
number and the size of communities which is not easy
or impossible to obtain in real-world networks
(Tasgin et al., 2007). The algorithms based on GA are
very effective for community detection especially in
very large complex networks (Jia et al., 2012).
However, the vast majority of optimization methods
proposed to detect community in PPI networks only
use graph topology and do not use similarity
measures between proteins or genes (Pizzuti and
Rombo, 2014).
This paper presents a new community detection
algorithm in PPI networks based on Genetic
Algorithm (GA). This work is a generalization of a
previous method that extract communities of a fixed
size (Ben M’barek et al., 2018). Therefore, we
propose a GA based approach that allows to find
communities having different sizes. Alike the
previous algorithm, the proposed method uses the
similarity measures between proteins or genes and
tries to find the best community structure by
maximizing the concept of community measure. It is
different from the community score introduced by
Pizzuti which is not related to the density of groups
(Pizzuti, 2008). Our measure is based on semantic
similarity and interaction between proteins or genes.
Moreover, we propose a new genetic operation that is
a specific mutation operator adapted to our problem.
The algorithm outputs the final community structure
by selectively exploring the search space.
Experiments on real datasets show the ability of the
proposed approach to correctly detect communities
having different sizes.
The contents are organized in six main sections.
The next section provides the necessary background
of literature survey to community’s detection
methods. Section 3 describes the biological field and
the data used to formalize the problem. Section 4
depicts our main proposed algorithm for community
detection. In section 5, experimental results on real
data sets are presented and analyzed. Finally, section
6 draws the conclusion.
2 COMMUNITY DETECTION
METHODS
This section presents a brief overview of the existing
community detection algorithms. In recent years,
many authors have given contributions to detect
communities in large networks. The literature survey
is divided into two categories: community detection
on the basis of analytical approaches and those based
on evolutionary approaches (Pizzuti, 2018) .
Analytical community methods firstly split
networks into subgroups according to their
topological characteristics, then the modularity
assessment is carried out. The most famous and
prominent algorithms in the literature have been
presented by Girvan and Newman (Girvan and
Newman, 2002; Newman and Girvan, 2004). Girvan
and Newman have proposed the modularity
assessment criterion, which is one of the most
important assessment criteria in the community
detection problem. According to the Girvan and
Newman algorithm, the betweenness score (the
number of shortest paths between all vertex pairs that
run along the edge) is computed for all edges in the
network in the first stage. In the second stage, the
edge that has the maximum betweenness score is
removed, and betweenness score is computed again
for the all affected edges. In the final stage, the
previous two stages are repeated until there are no
more edges in the network.
Analytical algorithms do not reach the expected
successful results in community detection from
complex networks. Therefore, various optimization
based algorithms have been proposed to provide
different approaches to solve the community
detection problem (Atay et al., 2017). With the
ICSOFT 2019 - 14th International Conference on Software Technologies
360

modularity criterion, the community detection
problem has become an optimization problem. Since
2002, several methods that divide networks
into clusters according to the modularity criterion
have been developed (Atay et al., 2017) .
In (Tasgin and Bingol, 2006) and (Liu et al.,
2007) the authors presented an approach based on a
GA to optimize the network modularity introduced by
Newman and Girvan (Girvan and Newman, 2002).
Recently, some studies have indicated that the
optimization of modularity has a main disadvantage
(Fortunato and Barthélemy, 2007). It can fail in
finding communities smaller than a fixed scale, even
if these communities are well defined. The scale
depends on the total size of the network and the
interconnection degree of the communities. This
resolution limit can constitute a weakness for all those
methods whose objective to optimize is modularity.
Pizzuti (Pizzuti, 2008) has proposed an algorithm
named GA-Net and she has used a special assessment
function called community score in addition to the
existing modularity function. This score uses only
graph topology.
Compared to analytical methods, evolutionary
methods present a number of advantages (Pizzuti,
2018) :
The number of communities is automatically
determined during the search process.
Domain-specific knowledge can be
incorporated inside the method, such as biased
initialization, or specific variation operators
instead of random, allowing a more effective
exploration of the state space of possible
solutions.
Being population-based models, they are
naturally parallel and efficient implementations
can be realized to deal with large size networks.
A lot of detecting communities methods based on
evolutionary approaches use only graph topology and
do not use semantic similarity between nodes (Pizzuti
and Rombo, 2014). The new community detection
algorithm proposed in this paper is based on GA. It
tries to find the best community structure by
maximizing the concept of community measure. This
measure is based on the graph topology (interaction)
and the semantic similarity between nodes.
3 USED DATA
To help understand this work, we define some terms
that are important for our discussion.
A biological pathway is a series of actions
among molecules in a cell that leads to a certain
product or a change in the cell (National
Human Genome Research Institute (NHGRI),
2015). There are many types of biological
pathways such as metabolic pathways or
Gene-regulation pathways.
A biological network is a multiple biological
pathways interacting with each other, example
of biological networks: PPI networks (National
Human Genome Research Institute (NHGRI),
2015).
To get more information on PPI network’s
structure, we have combined three information’s
levels: semantic level, functional level and network
level. In this section, we describe the used data
acquiesced from different sources.
3.1 Semantic Level: Gene Information
3.1.1 GO Vocabulary Structure
GO provides an ontology of defined terms which
represent gene product properties. It comprises over
19 000 terms organized in three sub-ontologies:
Cellular Component (CC): the parts of a cell or
its extracellular environment;
Molecular Function (MF): the elemental
activities of a gene product at the molecular
level, such as binding or catalysis;
Biological Process (BP): operations or sets of
molecular events with a defined beginning and
end, pertinent to the functioning of integrated
living units: cells, tissues, organs, and
organisms.
In this work, we focus on the BP domain. For
example, the gene product cytochrome c can be
described by the biological process terms oxidative
phosphorylation and induction of cell death
(Ashburner et al., 2000). The GO ontology is
structured as a directed acyclic graph, and each term
designs relationships to one or more other terms in the
same domain, and sometimes to other domains. Each
GO term within the ontology has a term name (which
may be a word or string of words), a unique
alphanumeric identifier (which start by GO:), a
definition with cited sources, and a namespace
indicating the domain to which it belongs. Terms may
also have synonyms (which are classed as being
exactly equivalent to the term name, broader,
narrower, or related), references to equivalent
Genetic Algorithm to Detect Different Sizes’ Communities from Protein-Protein Interaction Networks
361

concepts in other databases, and comments on term
meaning or usage. We cite above an example of a GO
term representation.
id: GO:0006119
name: oxidative phosphorylation
namespace: biological_process
def: "The phosphorylation of ADP to ATP that
accompanies the oxidation of a metabolite through
the operation of the respiratory chain. Oxidation of
compounds establishes a proton gradient across the
membrane, providing the energy for ATP
synthesis."
subset: goslim_pir
synonym: "respiratory-chain phosphorylation"
xref: Wikipedia:Oxidative_phosphorylation
is_a: GO:0006091 ! generation of precursor
metabolites and energy
is_a: GO:0016310 ! phosphorylation
relationship: has_part GO:0015986 ! ATP
synthesis coupled proton transport
We use GO to obtain data related to the BP
aspects. We precisely focus on the relationship "is-a"
and "part of" in order to identify the inheritance
relationship between GO terms. From this source, we
have extracted the unique identifier and the name of
all the terms related to the BP aspects.
3.1.2 Gene Ontology Annotation GOA
A GO annotation is a statement about the function of
a particular gene. Each GO annotation consists of an
association between a gene and a GO term (Hill et al.,
2008). From this project, we get a set of GO
annotation for each gene of BP. For example, the
MEIKIN gene is identified by ID: 728637 and
annotated by the following sets: "GO: 0007060",
"GO: 0010789", "GO: 0016321", "GO: 0045143",
"GO: 0051754".
3.1.3 Semantic Similarity
In (Guo et al., 2006), the authors state that genes of
the same community are semantically similar and
interact with each other. From this indication, we
supposed that genes belonging to the same
community are similar and tried to find the best
similarity measure between genes.
A gene can be annotated with numerous GO terms.
To determine the similarity between two genes, we
need to use an approach allowing to compare sets of
terms that annotate these genes. Thus, we can
quantify the similarity between these sets. In
literature, there are three main approaches for
measuring semantic similarity between the objects of
an ontology (Resnik, 2011; Wang et al., 2007). The
first are node-based approaches: the main data
sources are the nodes and their properties. One
concept commonly used in these approaches is
information content, which measures how specific
and informative a term is. The most prevalent node-
based approaches are Resnik’s (Resnik, 2011, Lin’s
(Lin, 1998), Rel (Schlicker et al., 2006) and Jiang and
Conrath’s (Jiang and Conrath, 1997) methods. They
were originally developed for the WorldNet, and then
applied to GO (Pesquita et al., 2009). The second
family of approaches is edge-based approaches: they
are based mainly on counting the number of edges in
the graph path between any two terms. The most
common technique selects either the shortest path or
the average of all paths when more than one path
exists (Wu and Palmer, 1994). Among this family of
approaches, there is the method of Rada (Rada et al.,
1989) and the one of Wu and Palmer (Wu and Palmer,
1994). The third family of approaches are hybrid
ones: Wang and al. (Wang et al., 2007) developed a
hybrid measure in which each edge is given a weight
according to the type of relationship. For a given term
and its ancestor
, the authors define the semantic
contribution of
to
, as the product of all edge
weights in the “best’’ path from
to
, where the
‘‘best’’ path is the one that maximizes the product.
Semantic similarity between two terms is then
calculated by summing the semantic contributions of
all common ancestors to each of the terms and
dividing by the total semantic contribution of each
term’s ancestors to that term. Ruths and al. (Ruths et
al., 2009) proposed GS2 (GO-based similarity of gene
sets), a novel GO-based measure of genes set
similarity. The measure quantifies the similarity of
the GO annotations among a set of genes by
averaging the contribution of each all gene’s GO
terms and their ancestor terms with respect to the GO
vocabulary graph.
In order to choose the adequate measure of
similarity, we have performed several tests GS2
(BEN M'BAREK et al., 2018). The best results were
obtained with the GS2 measure. So, we decided to use
the measure GS2 to characterize the similarity
between genes in the rest of our work.
ICSOFT 2019 - 14th International Conference on Software Technologies
362
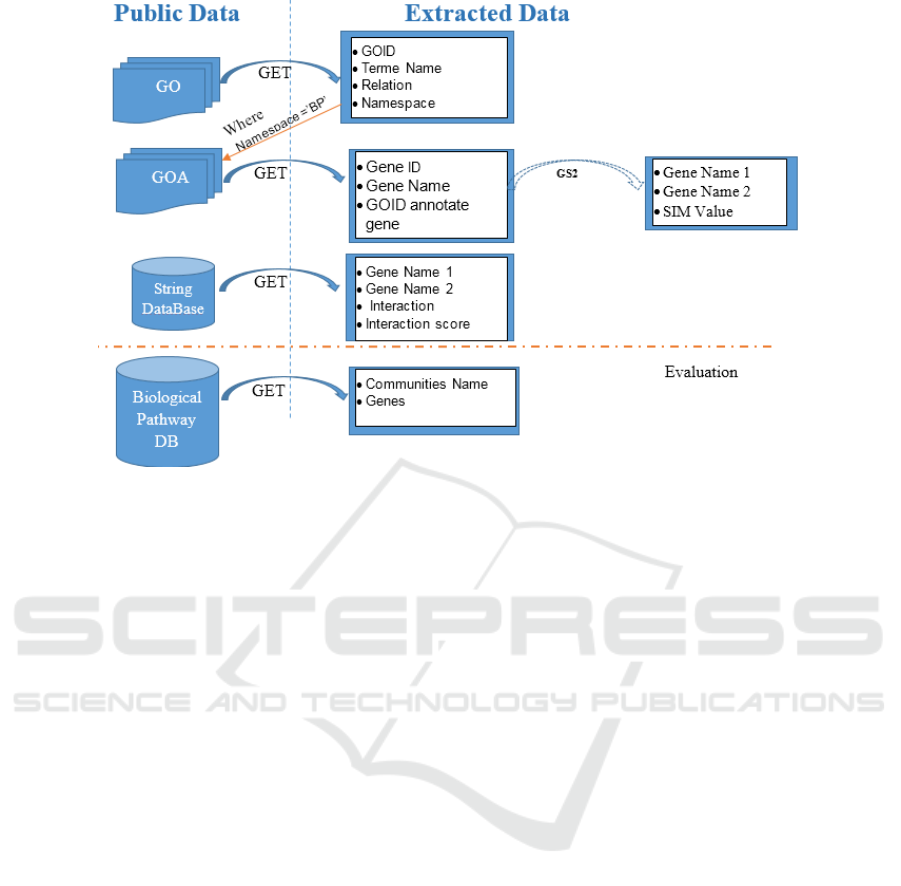
Figure 1: Summary of used data (Ben M’barek et al., 2018).
3.2 Functional Level: Interaction
between Genes
To study the interaction between genes, we use the
STRING (Search Tool for the Retrieval of Interacting
Genes/Proteins) database. This database is a
biological database and web resource of known and
predicted protein-protein or gene-gene interactions. It
contains information from several sources, including
experimental data, computational prediction methods
and public text collections (Mering et al., 2003; Snel
et al., 2000). From this database, we extract the
couples of genes or proteins that are interacting, the
mode of interaction between these couple of genes
and the interaction value which defines the number of
citations of this interaction in the literature.
3.3 Network Level: Biological
Pathways Databases
Among the various biological pathways databases,
we cite those that we have used.
Reactome: is a free online database of human
biological pathways and processes. The basic unit
used to describe the data is the reaction (Croft et al.,
2011).
Biocarta: catalogues community of several
species. It makes it possible to visualize, construct or
identify the networks mapping the known genomic
and proteomic relationships. It offers a synthesis of
these paths and represents them by graphs
(Nishimura, 2001).
Ec number (Enzyme Commission Number): is a
numerical classification scheme for enzymes
(proteins that act as biological catalysts), based on the
chemical reactions they catalyze. The chemical
reaction catalyzed is the specific property that
distinguishes one enzyme from another. It specify
enzyme-catalysed reactions (Green and Karp, 2005) .
BBID (Biological Biochemical Image Database):
is a WWW accessible relational database of archived
image from different article that describe regulatory
pathways. Pathway information is annoted and can be
queried (Becker et al., 2000)
KEGG (Kyoto Encyclopedia of Genes and
Genomes): is a knowledge base for systematic
analysis of gene functions, linking genomic
information with higher order functional information.
The genomic information is stored in the GENES
database, which is a collection of gene catalogs for all
the completely sequenced genomes and some partial
genomes with up-to-date annotation of gene functions
(Kanehisa and Goto, 2000).
The biological pathway database used to test the
proposed approach is KEGG as it was the one
proposed by our biology expert. The other biological
pathway databases are used to validate the
experimental results as explained in section 5. In this
database, we focused on the biological pathway
which represent the communities name and the genes
related to a community.
Genetic Algorithm to Detect Different Sizes’ Communities from Protein-Protein Interaction Networks
363

3.4 Summary of the Used Data
Based on what has been illustrated from 3.1 to 3.3,
the used data is summarized as:
A gene or protein is described by an ID, a name
and a set of terms that annotate it. For example,
the MEKIN gene is presented as follows: ID:
728637 || NAME: MEIKIN || Annoted terms:
[GO: 0007060, GO: 0010789, GO: 0016321,
GO: 004514, GO: 0051754, GO: 0006119].
Data related to the interaction between two
genes. For example, the interaction between the
HSPA1A gene and the GRPEL1 gene is:
NameGene1: "HSPA1A" || NameGene2:
"GRPEL1» || Interaction: "reaction" ||
Interaction Score: 900
The biological pathway is described by a
community name and a set of genes (pathway).
These data are extracted from different
pathway databases presented in subsection 3.3.
The semantic similarity value computed by the
GS2 method.
Figure 1 summarizes the sources of these
extracted data. The first goal is to obtain information
about a gene. Therefore, we get a set of GO terms that
identify such gene from GO and GOA. Then, we
acquire the interaction between couple of genes from
STRING database.
We introduce the proposed approach to detect
communities in the next section.
4 GENETIC ALGORITHM FOR
COMMUNITY DETECTION
GAs have proved to be competitive alternative
methods to traditional optimization and search
techniques and they have been applied to many
problems in diverse research and application areas
such neural nets evolution, planning and scheduling,
machine learning and pattern recognition(Goldberg,
1989; Petrowski and Ben-Hamida, 2017). Thus, it is
also suitable for solving the community detection
problem.
In this section, we describe the genetic algorithms
used in this work as well as the genetic representation
and operators.
The population consists of individuals that are the
solutions of the problem. In our approach of protein
or gene community detection, an individual is a set of
proteins or genes that form a community having
different sizes. To evaluate a solution, we propose a
fitness function based on a community measure. The
latter uses the similarity value and the interaction
score of every pair of genes making up the solution.
Moreover, we modify the steps of GA to satisfy the
needs of our algorithm. Thus, we propose a new
mutation operator, a clean-up phase and insert some
additional steps during the population initialization.
The algorithm works as follows:
1. Start with an initial population of communities
having different sizes of a set of proteins or
genes which may be generated randomly,
2. Select parents from the current population for
mating,
3. Apply the crossover operator on the parents to
generate new offsprings,
4. Clean up the new offsprings to eliminate the
redundant genes after the crossover step,
5. Apply mutation operator on the new generated
offsprings,
6. Evaluate these offsprings, and replace the worst
existing individuals in the population by these
offsprings,
7. Repeat the process from the second step while
the stop condition is not satisfied (stop
condition: number of generations is met or
computation time reached).
The various steps of the GA are described in the
following subsections.
4.1 Genetic Representation
One of the major important decisions to make while
implementing a GA is deciding how to represent our
individuals. A solution to our problem is a community
of proteins or genes. We represent it by a vector T. In
this representation each individual stores: the size of
an individual that is the number of proteins or genes,
the average value of similarity (see equation1), the
average interaction score (see equation2) of each two
genes or proteins and the list of the n gens (each gene
is represented by its name). This vector has (n + 3)
elements where n is the size of a community, it
corresponds to an individual in GA terms. Figure 2
illustrates the representation of an individual adopted
in our algorithm.
Figure 2: Example of individual representation designing a
community.
ICSOFT 2019 - 14th International Conference on Software Technologies
364

Table 1: Example of an initial population with five individuals.
5
0.553
0.398
PDHA2
MTHFD2L
RAC2
GRHPR
ANAPC1
8
0.793
0.543
ANAPC5
SOS1
CDC16
AURKA
IL4
ANAPC2
ccNB2
BUB1B
5
0.340
0.410
RFK
HYI
GPI
UBC
IGF1R
7
0.578
0.687
HSD3878
PFKP
LDHAL6B
FBXW7
ACSM3
MAX
6
0.632
0.591
ALPP
BPGM
PLK1
HK3
HK1
KEAP1
AVGSim=
Sim
GS2
G
i
, G
i+1
n-1
i=1
n
(1)
AVGInteraction=
InteractionValue
G
i
, G
i+1
n-1
i=1
n
(2)
With:
- n: the size of a community.
-
: the similarity value between two genes,
it is calculated using the semantic similarity measure
GS2 (Ruths et al., 2009).
- : the score of an interaction
between two genes extracted from STRING Database
(Mering et al., 2003)
4.2 Population Initialization
The generation of the initial population in a GA is of
profound importance since the characteristics of the
initial solutions can affect the quality of the final
solution as well as the running time of the algorithm.
In this work, the population is defined as a two-
dimensional array of individuals. It is a set of
individuals that represent some potential solutions of
the problem. In order to initialize this population, we
first randomly recover communities from the KEGG
pathway database. Then, we randomly create the
population with the recovered genes. The population
is composed by individuals having different sizes.
After that, we compute the similarity value using the
GS2 measure and get the interaction score of each two
genes of this group from the created "interaction"
table. Next, we calculate the average similarity value
and the average interaction score of each group
forming this population. Table 1 presents an example
of an initial population with five individuals having
different sizes.
4.3 Fitness Function
The fitness function relates to the ability of the
candidate to survive and reproduce. It takes as input a
candidate solution to the problem and produces as
output how better “fit” the solution is with respect to
the considered problem. The computation of the
fitness value is done repetitively in a GA and
therefore it should be sufficiently fast. The choice of
the fitness function is a critical step for obtaining
good solutions. In the context of community detection
the most popular function is modularity, originally
introduced by Girvan and Newman (Girvan and
Newman, 2002). In our work, we do not directly take
into account the modularity, nevertheless the
topological propriety of a community is taken into
account through the interaction score between
proteins or genes. Moreover, the fitness function is
enriched with semantic information. Indeed, we used
a defined fitness function based on the computation
of the average similarity value and the average
interaction score of each two genes existing in the
community. We start from the hypothesis that genes
in the same community are semantically similar and
interact with each other. The fitness function is
defined as follows (Ben M’barek et al., 2018):
F = W
1
AVGSim+W
2
AVGInteraction
(3)
With:
- AVGSim and AVGInteraction defined in (1)
and (2).
- W
1
and W
2
: weights [0,1]
We carried out tests with different values of
W
1
and W
2
. Then, we have taken the values which
give the best results in terms of the number of known
networks recovered from KEGG pathway database.
The value taken for the fitness function are W
1
=W
2
=
0.5 (Ben M’barek et al., 2018).
4.4 Selection
In this stage of a GA, individuals are selected from
the population to be parents which mate and
recombine to create offsprings for the next
generation. Selection is very crucial to the
convergence rate of the GA as good parents drives
individuals to fitter solutions. The problem is how to
select these individuals. In literature, there are many
methods to select the best individuals such as roulette
wheel selection, tournament selection, rank selection,
elitism… (Goldberg and Deb, 1991).
(2)
Genetic Algorithm to Detect Different Sizes’ Communities from Protein-Protein Interaction Networks
365
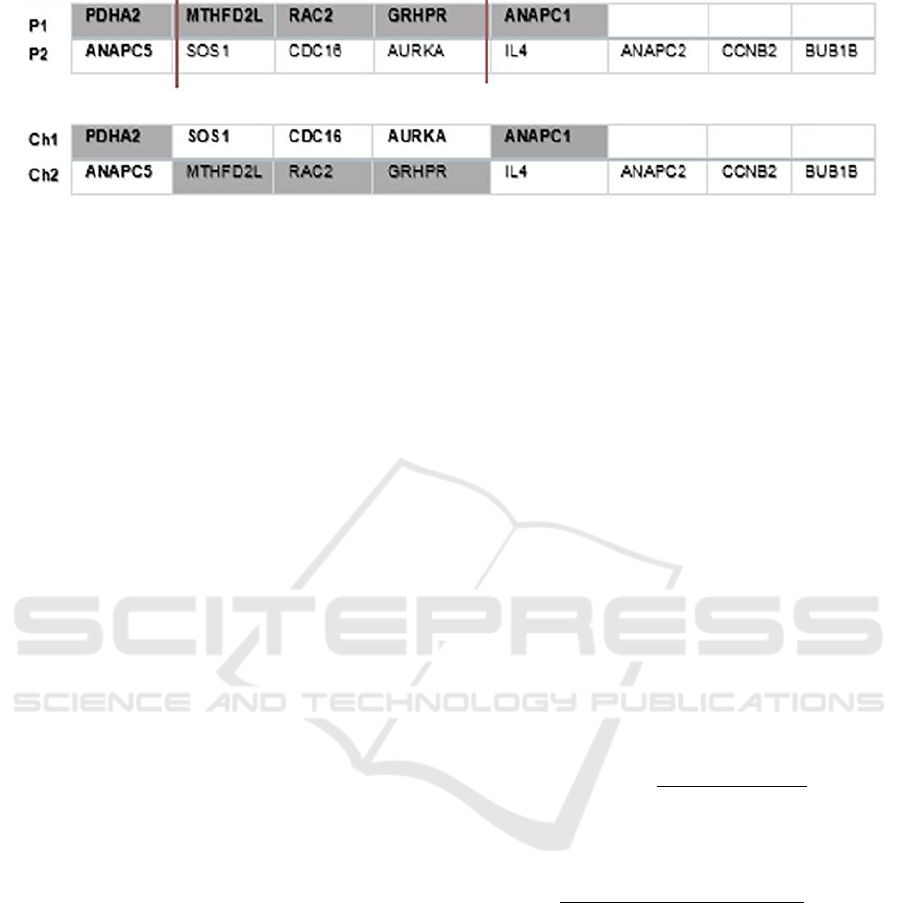
Figure 3: Example of a two- point crossover operator.
In this work, we choosed the tournament selection
method. In K-Way tournament selection, we select K
individuals from the population at random and select
the best out of these to become a parent. The same
process is repeated for selecting the next parent. It is
an extremely popular selection method in GA due to
its efficiency and simple implementation (Goldberg
and Deb, 1991).
4.5 Genetic Operators
After the generation of an initial population, a GA
carries out the genetic operators to generate offspring
based on the initial population. Once a new
generation is created, the genetic process is
performed iteratively until an optimal result is found
or a maximum number of generations is met.
Crossover and mutation are two basic operators of
GA. The performance of GA depends on them. These
operators guide the algorithm towards a solution to a
given problem. Their goal is to both exploit the best
solutions and explore the search space.
For this work, we used the multi-point crossover:
it is a generalization of the one-point crossover. Here
two random sites are chosen with condition that the
sites do not exceed the longest parent size. Then, the
contents bracketed by these sites are exchanged
between two mated parents to get two new offsprings.
This operator is usually applied with a high
probability (pc) (Pizzuti, 2018). To better understand
this kind of crossover, a graphical illustration can be
seen in Figure 3. In this example, two sites are chosen
at random in position 1 and 4. Then two offspring
(ch1, ch2) are generated by exchanging the values of
the selected parents (P1,P2).
The mutation is an operator that acts in a rarer
fashion and in an unpredicted form to modify the
genes of the individual, promoting the diversification
of the population. However, the mutation must not be
too destructive and nullify the process of finding an
optimal solution (Pizzuti, 2018).
For mutation, we proposed a new operator that
can better meet the objectives of our problem.
Mutation may be defined as a small random tweak in
the individual, to get a new solution. It is used to
maintain and introduce diversity in the population and
is usually applied with a low probability (pm). If the
probability is very high, the GA gets reduced to a
random search (Pizzuti, 2018).
We present now a new mutation operator that is
specific to our problem, it should allow a better
exploration of the search space than the random
mutation. Its goal is to maximize the chance of
creating a better solution than the original one. This
operator can integrate a new gene in order to replace
a gene having a poor quality or to enlarge the size of
the community. To mutate a solution S, the mutation
operator alters only one gene at a time and uses a
score function, denoted GS, applied to each gene in
S. This score helps us to detect the gene having the
best score in a community as well as the gene having
the worst score. It is equal to the sum of the average
similarity and the average interaction score of a gene
in a community. It is defined as follows:
Sim
GS2
(4)
(5)
GS
G
= Sim(G)AVGInteraction(G)
(6)
With:
- G
≠ G
-
: The similarity value of a
gene G compared to the other genes in the
community.
-InteractValue
: The interaction
score of a gene G compared to the others in the
community.
- n: size of an individual (community).
ICSOFT 2019 - 14th International Conference on Software Technologies
366

The proposed mutation operator is applied
according to the following steps:
1. Select in a solution S a gene having the highest
score GS that will be called “bestGene”.
2. Randomly search a gene G' from the
“interaction” table with which the “bestGene”
interacts and G' S.
3. Get the gene having the lowest score GS in S,
it will be called “worstGene”.
4. Fixe a threshold Ɵ=0.5
5. If the score of the “worstGene” <= Ɵ then
replace the “worstGene” by the gene selected
in the second step.
6. Else insert into the end position of the solution
the gene selected in the second step and update
the size.
5 EXPERIMENTAL RESULTS
In this section, we study the effectiveness of our
approach on real datasets (Pathways selected from
KEGG Pathway database).
We first carried out tests to tune the GA
parameters. Different parameters values were tested:
generation number set at 100, 300 and 500, size of the
population set at 10, 20, 30, 70 and 100, crossover rate
set at 0.5, 0.6, …1 and mutation rate set at 0,01, 0.1,
0.2, …, 0.5. Based on these tests, we choose the
combination of the parameters values giving the best
results (highest values of fitness function), namely:
population size 30, generation number 100, crossover
rate 0.8, and mutation rate 0.01. Moreover, a weak
value of mutation probability allows to prevent the
algorithm to be blocked in a local minimum.
Concerning the size of individual in the initial
population, we fix it in the range of 5 to 40.
In order to check the ability of our approach to
successfully detect the community structure of a
network, we use randomly selected proteins or genes
that are present in communities from the reference
pathway database KEGG. More precisely, our
approach has been tested with five datasets proposed
by our biological expert, in total we have 595 genes, as
described in Table2. These datasets correspond to a
real and existing communities and are collected from
the KEGG pathway database.
The evaluation consists in verifying how the
proposed method is likely to find gene or proteins
communities existing in the KEGG pathway
database. Actually, the tests showed that it was
possible to detect communities of genes or proteins
existing in KEGG database or a new community
having high interaction and high similarity between
its genes or proteins and that do not appear in KEGG.
Table 2: The used datasets.
Datasets
Number of
genes
Apoptosis
88
B cell receptor signalling pathway
75
Purine metabolism
159
Rna degradation
159
Oocyte meiosis
114
Total
595
We performed tests to determine communities
having different sizes. We run our approach 20 times
with proteins or genes chosen randomly from the five
proposed datasets. And, we retained each time the
best community. Thus, we have 20 best communities
with diverse sizes varying from 5 to 40. When a
solution is found the question that arises is how it will
be evaluated.
Our biology expert proposed to evaluate this
community by checking if it exists in KEGG or other
biological pathway databases. Each new community
founded by our approach is presented to the
DAVID tools (Database for Annotation Visualization
and Integrated Discovery), which compares this
community with others in different databases and
gives the percentage of ′ genes that belong to
the existing communities in those databases. DAVID
bioinformatics resources consist of an integrated
biological knowledge-base and analytic tools that aim
at systematically extracting biological meaning from
large gene/protein lists. It is the most popular
functional annotation programs used by biologists
(Sherman et al., 2007). It takes as input a list of genes
and exploits the functional annotations available on
these genes in a public database such as, KEGG
Pathways in order to find common functions that are
sufficiently specific to these genes. Table 3 below
represents the minimum and the maximum
percentage of genes that belong to the used
communities of KEGG pathways. Comparing a
community founded by our approach to the
datasets used to create the initial population, allows to
evaluate the ability of our method to rebuilt
communities with the initial proteins or genes.
Genetic Algorithm to Detect Different Sizes’ Communities from Protein-Protein Interaction Networks
367
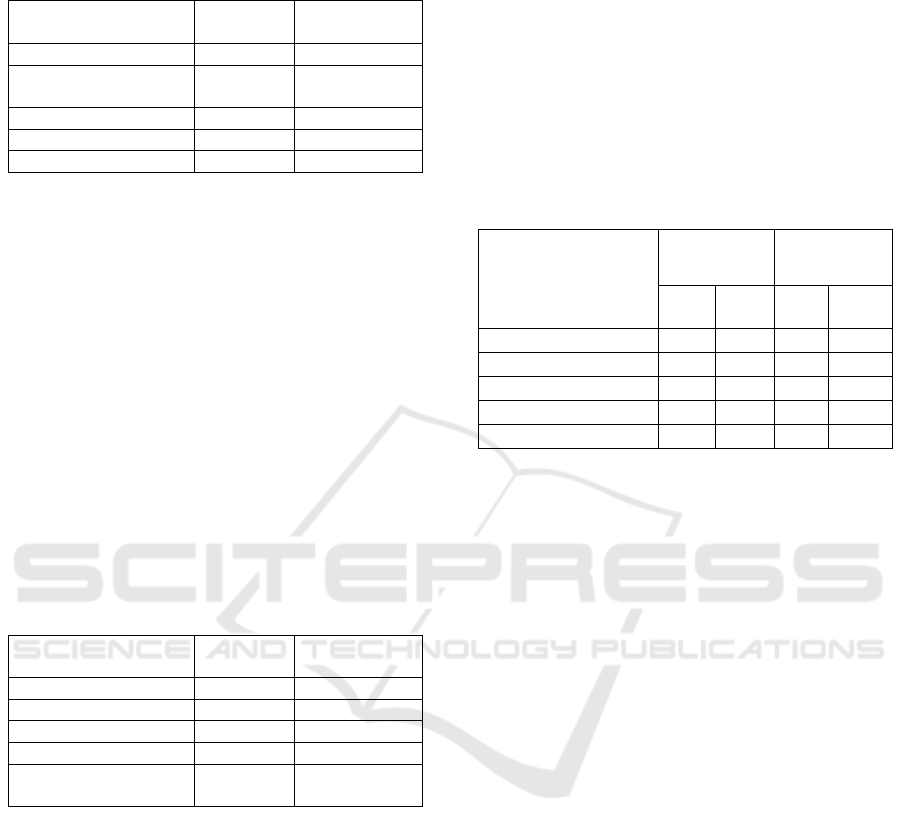
Table 3: Communities’ detection: experimental results
compared to the proposed datasets.
Datasets
Percentage
Min
Percentage
Max
Apoptosis
25%
67%
B cell receptor
signaling pathway
25%
67%
Purine metabolism
50%
100%
RNA degradation
-
29%
Oocyte meiosis
50%
100%
From table 3, we find that obtained communities
correspond to some "parts" of the real communities,
and in some cases to a complete network (percentage
100%). Therefore, the proposed algorithm able to
efficiently rebuilt communities with the initial used
proteins or genes. In a further work, additional tests
should be conducted to confirm these results.
We evaluate also the obtained communities by
checking if they exist in other biological pathway
databases. The biological databases used to evaluate
our results are Biocarta, Reactome, BBID and EC
Number. We also used KEGG pathway database to
compare the found communities by our approach with
other communities than those used for the
initialization step (datasets in table 2). The results of
this evaluation are shown in table 4.
Table 4: Evaluation of new communities having different
sizes.
Pathway Databases
Percentage
Min
Percentage
Max
BBid
25%
50%
Biocarta
20%
66%
Ec_number
10%
100%
Reactome_pathway
14%
100%
Kegg_pathway (other
datasets )
15%
100%
The results presented in table 4 show that the new
communities obtained by our algorithm correspond to
some "parts" of real networks existing in other
biological pathway databases, and in some cases to a
complete network (percentage 100%). These results
are considered very satisfactory by the biology
expert. They constitute an initial validation of our
algorithm and show the relevance of the used fitness
function. These tests should be supplemented on a
larger scale with other datasets and different
communities.
Furthermore, we compare the results obtained by
our new approach with the method proposed in (Ben
M’barek et al., 2018) where the communities have a
fixed predetermined size. We name this approach Ben
M'Barek et al. 2018. The same datasets proposed by
the biological expert (Table 2) and the same GA
parameters were used for both approaches. The
program was executed 20 times. Table 5 illustrates
the results of our approach and the other method for
identifying communities. Here again, we used the
DAVID tools to estimate the recovery rate of the
found communities with existing communities in
different biological databases.
Table 5: Comparison of the proposed approach and the
BEN M’barek et al.2018 approach for identifying
communities.
Pathway Databases
Ben M’barek
et al.2018
approach
The proposed
apprach
%
Min
%
Max
%
Min
%
Max
BBid
20%
30%
25%
50%
Biocarta
20%
60%
20%
66%
Ec_number
20%
70%
10%
100%
Reactome_pathway
20%
70%
14%
100%
Kegg_pathway
20%
90%
15%
100%
Table 5 clearly shows the good performance of the
new proposed approach to detect communities having
different sizes with respect to Ben M'barek et al. 2018
approach to detect communities having the same
sizes. Our new method achieves the highest
percentage 100% in three pathway databases: Kegg,
Reactome and Ec_number. For example, on the Kegg
pathway database, the new proposed approach
obtained the max percentage value 100% which
corresponds to a complete network. The worst
percentage value is of 15% which corresponds to
some "parts" of the real communities.
To conclude, the obtained results show the
capability of the proposed GA to effectively deal with
community identification in networks. Further
extensions will be proposed to detect networks with
larger size and identify new networks not yet known
int the public biological databases.
6 CONCLUSIONS
In this paper, we have proposed an approach based on
GA to detect communities of interacting genes or
proteins. This approach allows to find communities
having different sizes, it is a generalization of the
previous work here the found communities had a
fixed predetermined size. Moreover, it introduces the
concept of community measure and searches for
optimal partitioning of the network by maximizing
these measures. Our contribution in this paper is
ICSOFT 2019 - 14th International Conference on Software Technologies
368

twofold. First, we applied GA to community
detection in PPI networks. Second, we defined a
specific mutation operator adapted to the considered
biological problem. Dense communities existing in
the network structure are obtained at the end of the
algorithm by selectively exploring the search space,
without the need to know in advance the community
size. The experimental results showed the ability of
our approach to correctly detect communities having
different sizes. Future research will aim at modifying
the proposed fitness function for example by adding
the modularity value and applying multi-objective
optimization to improve the quality of the results.
ACKNOWLEDGEMENTS
We would like to show our gratitude to Dr. Walid
BEDHIAFI (Laboratoire de Génétique Immunologie
et Pathologies Humaines, Université de Tunis El
Manar ) for assistance to comprehend the biological
fields and for the interpretation of the results.
REFERENCES
Ashburner, M., Ball, C.A., Blake, J.A., Botstein, D., Butler,
H., Cherry, J.M., Davis, A.P., Dolinski, K., Dwight,
S.S., Eppig, J.T., Harris, M.A., Hill, D.P., Issel-Tarver,
L., Kasarskis, A., Lewis, S., Matese, J.C., Richardson,
J.E., Ringwald, M., Rubin, G.M., Sherlock, G., 2000.
Gene ontology: tool for the unification of biology. The
Gene Ontology Consortium. Nat. Genet. 25, 25–29.
Atay, Y., Koc, I., Babaoglu, I., Kodaz, H., 2017.
Community detection from biological and social
networks: A comparative analysis of metaheuristic
algorithms. Applied Soft Computing 50, 194–211.
Becker, K.G., White, S.L., Muller, J., Engel, J., 2000.
BBID: the biological biochemical image database.
Bioinformatics 16, 745–746.
Ben M’barek, M., Borgi, A., Bedhiafi, W., Ben Hmida, S.,
2018. Genetic Algorithm for Community Detection in
Biological Networks. Procedia Computer Science,
Knowledge-Based and Intelligent Information &
Engineering Systems: Proceedings of the 22nd
International Conference, KES-2018, Belgrade, Serbia
126, 195–204.
Croft, D., O’Kelly, G., Wu, G., Haw, R., Gillespie, M.,
Matthews, L., Caudy, M., Garapati, P., Gopinath, G.,
Jassal, B., Jupe, S., Kalatskaya, I., Mahajan, S., May,
B., Ndegwa, N., Schmidt, E., Shamovsky, V., Yung, C.,
Birney, E., Hermjakob, H., D’Eustachio, P., Stein, L.,
2011. Reactome: a database of reactions, pathways and
biological processes. Nucleic Acids Res. 39, D691-697.
Fortunato, S., Hric, D., 2016. Community detection in
networks: A user guide. Physics Reports 659, 1–44.
Girvan, M., Newman, M.E.J., 2002. Community structure
in social and biological networks. Proc. Natl. Acad. Sci.
U.S.A. 99, 7821–7826.
Goldberg, D. E., 1989. Genetic Algorithms in Search,
Optimization and Machine Learning, 1st ed. Addison-
Wesley Longman Publishing Co., Inc., Boston, MA,
USA.
Goldberg, D. E., Deb, K., 1991. A comparative analysis of
selection schemes used in genetic algorithms, in:
Foundations of Genetic Algorithms. Morgan
Kaufmann, pp. 69–93.
Green, M. L., Karp, P.D., 2005. Genome annotation errors
in pathway databases due to semantic ambiguity in
partial EC numbers. Nucleic Acids Res 33, 4035–4039.
Guo, X., Liu, R., Shriver, C.D., Hu, H., Liebman, M.N.,
2006. Assessing semantic similarity measures for the
characterization of human regulatory pathways.
Bioinformatics 22, 967–973.
Hill, D.P., Smith, B., McAndrews-Hill, M.S., Blake, J.A.,
2008. Gene Ontology annotations: what they mean and
where they come from. BMC Bioinformatics 9, S2.
Jia, G., Cai, Z., Musolesi, M., Wang, Y., Tennant, D.A.,
Weber, R.J.M., Heath, J.K., He, S., 2012. Community
Detection in Social and Biological Networks Using
Differential Evolution, in: Hamadi, Y., Schoenauer, M.
(Eds.), Learning and Intelligent Optimization, Lecture
Notes in Computer Science. Springer Berlin
Heidelberg, pp. 71–85.
Jiang, J. J., Conrath, D.W., 1997. Semantic Similarity
Based on Corpus Statistics and Lexical Taxonomy.
arXiv:cmp-lg/9709008
Kanehisa, M., Goto, S., 2000. KEGG: kyoto encyclopedia
of genes and genomes. Nucleic Acids Res. 28, 27–30.
Lin, D., 1998. An Information-Theoretic Definition of
Similarity. In Proceedings of the 15th International
Conference on Machine Learning. Morgan Kaufmann,
pp. 296–304.
Liu, X., Li, D., Wang, S., Tao, Z., 2007. Effective
Algorithm for Detecting Community Structure in
Complex Networks Based on GA and Clustering, in:
Shi, Y., Albada, G.D. van, Dongarra, J., Sloot, P.M.A.
(Eds.), Computational Science – ICCS 2007, Lecture
Notes in Computer Science. Springer Berlin
Heidelberg, pp. 657–664.
Mering, C. von, Huynen, M., Jaeggi, D., Schmidt, S., Bork,
P., Snel, B., 2003. STRING: a database of predicted
functional associations between proteins. Nucl. Acids
Res. 31, 258–261.
National Human Genome Research Institute (NHGRI),
2015. Biological Pathways Fact Sheet. National Human
Genome Research Institute (NHGRI).
Newman, M.E.J., Girvan, M., 2004. Finding and evaluating
community structure in networks. Physical Review E
69.
Nishimura, D., 2001. BioCarta. Biotech Software &
Internet Report 2, 117–120.
Pesquita, C., Faria, D., Falcão, A.O., Lord, P., Couto, F.M.,
2009. Semantic Similarity in Biomedical Ontologies.
PLoS Comput Biol 5.
Genetic Algorithm to Detect Different Sizes’ Communities from Protein-Protein Interaction Networks
369

Pizzuti, C., 2018. Evolutionary Computation for
Community Detection in Networks: A Review. IEEE
Transactions on Evolutionary Computation 22, 464–
483.
Pizzuti, C., 2008. GA-Net: A Genetic Algorithm for
Community Detection in Social Networks. Presented at
the International Conference on Parallel Problem
Solving from Nature, Springer, Berlin, Heidelberg, pp.
1081–1090.
Petrowski, A., Ben-Hamida, S., 2017. Evolutionary
Algorithms. John Wiley & Sons.
Pizzuti, C., Rombo, S.E., 2014. Algorithms and tools for
protein–protein interaction networks clustering, with a
special focus on population-based stochastic methods.
Bioinformatics 30, 1343–1352.
Rada, R., Mili, H., Bicknell, E., Blettner, M., 1989.
Development and application of a metric on semantic
nets. IEEE Transactions on Systems, Man, and
Cybernetics 19, 17–30.
Resnik, P., 2011. Semantic Similarity in a Taxonomy: An
Information-Based Measure and its Application to
Problems of Ambiguity in Natural Language.
arXiv:1105.5444 [cs].
Ruths, T., Ruths, D., Nakhleh, L., 2009. GS2: an efficiently
computable measure of GO-based similarity of gene
sets. Bioinformatics 25, 1178–1184.
Schlicker, A., Domingues, F.S., Rahnenführer, J.,
Lengauer, T., 2006. A new measure for functional
similarity of gene products based on Gene Ontology.
BMC Bioinformatics 7, 302.
Sherman, B. T., Huang, D. W., Tan, Q., Guo, Y., Bour, S.,
Liu, D., Stephens, R., Baseler, M.W., Lane, H.C.,
Lempicki, R. A., 2007. DAVID Knowledgebase: a
gene-centered database integrating heterogeneous gene
annotation resources to facilitate high-throughput gene
functional analysis. BMC Bioinformatics 8, 426.
Snel, B., Lehmann, G., Bork, P., Huynen, M.A., 2000.
STRING: a webserver to retrieve and display the
repeatedly occurring neighbourhood of a gene. Nucl.
Acids Res. 28, 3442–3444.
Tasgin, M., Bingol, H., 2006. Community Detection in
Complex Networks using Genetic Algorithm.
arXiv:cond-mat/0604419.
Tasgin, M., Herdagdelen, A., Bingol, H., 2007. Community
Detection in Complex Networks Using Genetic
Algorithms. arXiv:0711.0491 [physics].
Wang, J.Z., Du, Z., Payattakool, R., Yu, P.S., Chen, C.-F.,
2007. A new method to measure the semantic similarity
of GO terms. Bioinformatics 23, 1274–1281.
Wu, Z., Palmer, M., 1994. Verbs Semantics and Lexical
Selection. In: Proceedings of the 32Nd Annual Meeting
on Association for Computational Linguistics, ACL
’94. Association for Computational Linguistics,
Stroudsburg, PA, USA, pp. 133–138.
ICSOFT 2019 - 14th International Conference on Software Technologies
370
