
Online Consumers’ Opinions Analysis for Marketing Strategy
Evaluation
Elena Ektoros
1
, Andreas Gregoriades
1
and Michael Georgiades
2
1
Cyprus University of Technology, Limassol, Cyprus
2
Primetel PLC, Limassol, Cyprus
Keywords: Micro-blogs, Tweeter Analytics, Product Positioning, Marketing Strategy.
Abstract: With over two billion users having access to social media accounts, people increasingly choose to express
themselves online. Electronic word of mouth generates large amounts of data, making it a valuable source for
big data analytics. This provides organisations with key capabilities for improved decision-making through
mining insights directly from online sources. In this work we gathered and analysed the sentiment of
consumers’ tweets regarding the release of two smartphone products. Tweeter data was collected using a
custom-made Android application. The research question addressed in this study focused on whether the
marketing positioning strategy of the company under investigation was successful after the release of two of
its new products. To evaluate this, we compared the product positioning strategy of the firm before and after
the release of the product. Consumers’ opinions were analysed to identify possible discrepancies between
planned consumers’ reactions and sentiments, as strategized by the company, and how these were altered with
the release of the product.
1 INTRODUCTION
A new challenge for companies is how to discover
hidden information in big data sources to remain
competitive advantage through effective data
processing (Khade, A. A., 2016). Micro-blogs
represent one type of big data that is available for
analysis and complements other forms of human
interaction (Chamlertwat, W., et al., 2012). They
gained popularity from the inherent need of people to
express their views on a wider scale. The internet
empowers consumers to gain access to information
sources, enabling them to be “active co-producers of
value” (deChernatony 2000) and sometimes referred
as prosumers. Consumers give their opinion freely
through micro-blogs and “reviews”. Micro-blogs are
viewed as an electronic word-of- mouth (eWOM)
which could trigger discussions on products or
services. Companies realised the potential from
eWOM analysis and use micro-blogging as a part of
their marketing strategy (Jansen et al., 2009).
This work aims to analyse whether Huawei’s
product release, positioning and marketing strategy
for the Huawei P20 and Huawei P20 Pro products was
successful by evaluating tweets before and after their
release. To answer this research question, we utilised
public opinion data obtained via a custom-made
Twitter collection tool.
2 LITERATURE REVIEW
To improve the process of new product release that
aim to satisfy new customers’ needs, it is important to
evaluate alternative ways to retrieve information
regarding customers’ opinions that could highlight
those needs (Jung, J. J., 2012). According to a
statement made by Scott Cook, co-founder of Intuit,
“A brand is no longer what we tell a customer it is- it
is what customers tell each other it is” (Nayab G et al,
2016). Twitter and other social networks became
valuable resource for mining sentiment in fields such
as customer behaviour. Around 20% of microblogs
mention a brand name (Jansen, B. J., et al., 2009),
hence, companies should include in their marketing
strategy the management of brand perception on
Twitter and other social media platforms. Several
studies investigate the use of Twitter and other social
networks to mine consumer-sentiment in field as
customer behaviour.
266
Ektoros, E., Gregoriades, A. and Georgiades, M.
Online Consumers’ Opinions Analysis for Marketing Strategy Evaluation.
DOI: 10.5220/0007838802660273
In Proceedings of the 21st International Conference on Enterprise Information Systems (ICEIS 2019), pages 266-273
ISBN: 978-989-758-372-8
Copyright
c
2019 by SCITEPRESS – Science and Technology Publications, Lda. All rights reserved
The role of online communities, particularly in the
context of new product development, has been
discussed by many studies (e.g., Franke and Piller,
2003). Pang (2007) highlighted that online product
reviews enable marketers and manufacturers to gain
more complete understandings of customers. Zhu and
Zhang (2010) proved that online customer reviews
can be a good proxy for communicating customer
experience by word-of-mouth.
In order to achieve successful product
development, product positioning is a critical
technique to help firms better understand the
underlying relationships between product features,
competing alternatives and diverse consumers’ needs
(Lilien and Rangaswamy 2003; Petiot and Grognet
2006; Cha, et al., 2009). Product positioning is not
what companies do to a product but is what
companies do to prospective customers.
In strategic marketing, ‘positioning’ refers to
implementing a set of tactics to ensure that a product
and its characteristics occupy a unique position in the
minds of customers (Lilien and Rangaswamy 2003).
Optimal product positioning corresponds to
determining which attributes and configurations
should be used to satisfy customer requirements
(Kwong, Luo, and Tang 2011). According to (Chih-
Hsuan W., 2015) product positioning is implemented
through a series of steps: (1) visualising competitive
alternatives and product features (2) constructing a
forecasting model to estimate how potential buyers
will react to marketing stimulus and (3) specifying
optimal position of new product(s) and identifying
niche segment(s). A perceptual map is a powerful tool
to visualise the relationships between competing
products and their associated features in a
comprehensible way. Moreover, perceptual maps can
help firms assess the strengths and weaknesses of
competing alternatives. According to (Hair J. et al,
2009), two ways are mainly used to construct a
perceptual map: the first is multi-dimensional scaling
and the second is correspondence analysis. The latter
can use categorical variables to project on a plot the
relationships between benchmarks and associated
product features, without requiring multiple
regression. Due to its simplicity correspondence
analysis is adopted in this study to evaluate Huawei’s
P20 & P20 pro products’ positioning.
Traditional approaches for studying consumer
behaviour, such as marketing survey, interviews,
focus groups, experiments and other, require a great
amount of time and resources. Moreover, some
products, such as smartphones, have a short-term
product life cycle, hence this approach could not be
appropriate due to the time required to perform these
analyses and the lifespan of the product.
Smartphone’s market competition is fierce due to the
constant advancement of technology, hence new
updated versions are hitting the market at lightening
speeds. According to HTC, the average shelf life for
smartphones has decreased from three years in 2007
to around six to nine months in 2011 (Ferreira, 2011).
Another important statistic from Statista.com shows
that the average number of months for people to
change their smartphones is less than two years (≈22
months). Therefore, producers have too little time to
research market by traditional way. Referring to
Technology Adoption Life Cycle, each model of
smartphones has limited time to prove their product
adoption using conventional means.
Twitter represent a useful platform for micro-blog
analysis due to the amount of data that is generated
from the public (Chamlertwat W. et al., 2012). Due to
these platforms, sentiment analysis and topic
extraction have been very hot research fields recently.
These capabilities make it possible to automatically
identify user’s emotions regarding a subject (Al-
Obeidat F. et al., 2018). Therefore, these methods are
more appropriate in fast changing domains such as
the smartphone market.
3 METHODOLOGY
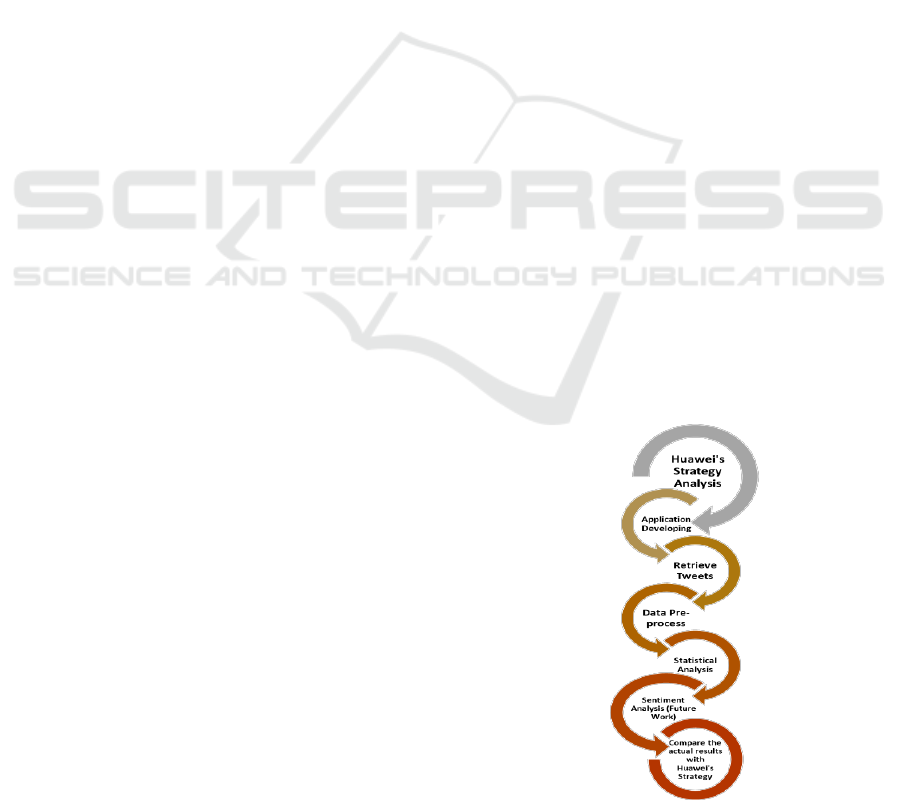
The diagram in figure 1 illustrates the steps followed
to answer our research questions. The first step in the
method was to examine Huawei’s marketing strategy
for both P20 products and their associated position-
ing. An important element of the marketing strategy
was the target customer segment and the keywords
for promoting particular features of new products.
Figure 1: Methodology.
Online Consumers’ Opinions Analysis for Marketing Strategy Evaluation
267

The second step of the methodology concentrated
on the building of an application to dynamically
collect data regarding the target customers of the
company. In this stage an android application was
developed to gather data based on specific
geolocation coordinates of the microblogs and
specific theme.
The next step in the methodology was data pre-
processing, which involved data cleaning,
dimensionality reduction and irrelevant data
elimination. This was a necessary step to enable the
processing of the data and the extraction of
meaningful insights.
Following data pre-processing, the sentiment and
statistical analysis on the dataset was performed. For
these tasks open source tools were used. Specifically,
a frequency analysis of the main themes in the dataset
and polarity of sentiment analysis were performed.
In the final step, the obtained quantitative and
qualitative data was analysed further to map the
observed data against the planned company’s
strategy. During this step, the results obtained were
compared with planned positioning to examine
whether the marketing strategy of the firm matched
the opinions of its customers. Therefore, identifying
if consumers perceived positively the features of the
new products and their quality.
4 STRATEGY ANALYSIS
The analysis of Huawei’s marketing strategy was
necessary to examine if the consumers’ perception of
the new products was analogous to the expectations
of the company prior to the smartphones release.
Based on the conducted analysis, it seems that
Huawei adopted a product and cost differentiation
strategy for the promotion of Huawei P20 and
Huawei P20 Pro. The company aimed to target
consumers that look for high specification
smartphone, usually provided by iPhone, at a lower
price. Based on this, Huawei’s marketing strategy
promoted the unique and competitive features of
photography that Huawei Pro series smartphones has.
The company tried to emphasise on the quality of the
camera resolution in order to differentiate itself in
their target market and use specific keywords to
emphasise on this feature. Samsung and iPhone
constitute Huawei’s major competitors, with, iPhone
as the leading brand owned 19,2% market share on
smartphone sales and Samsung second with 18,4%.
Huawei concentrated its efforts on the triple-camera
feature introduced in the smartphone market for first
time, utilising intelligent photography, hence
differentiating Huawei from the other brands in
smartphone industry. As part of their promotion the
firm uses the "See Mooore" slogan clearly referring
to the Leica triple-lens system presented in all
advertisements that the smartphone has.
The assumption made here is that if the company
manages to satisfy the needs of the market segment
they targeted, this will be reflected in the eWOM of
its consumers. In this study we explore the effect of
the strategy on eWOM, before and after the release of
the products.
5 THE DATA GATHERING TOOL
A data gathering tool was used to collect relevant
tweets for the analysis. A custom Twitter application
was developed for this process for Android mobiles.
To have access to Twitter’s APIs, a mobile app using
Android studio was built. This is a typical procedure
required by Twitter to secure access to Tweeters
database by authorised users. In order to have the
right data from the microblogs, the corresponding
data entries of interest were specified in each query.
i.e. data for sentiment and statistical analysis. The
best feature that Twitter offers for this purpose is the
"Search Tweets". Twitter offers two options to
retrieve tweets. The Rest API and the Streaming API.
For this task the Rest API was used, that allowed for
searching of specific tweets using certain criteria
specified in the queries searched for. The timeframe
of the data gathering was 7 days due to API
limitations. Figure 2 shows a screen shot of the
developed Android app.
The specification of the tweets query keywords
was based on preliminary analysis of the two products
features and company positioning and strategy. For
the two smartphones, terms such as #HuaweiP20,
#HuaweiP20Pro, #Huawei, #SeeMore etc. were used.
These keywords yielded 436 tweets with 140
characters length each. The #SeeMore and other
related keywords related to the products’ positioning
strategy, with emphasis on being perceived by
consumers as a product equipped with improved
mobile photography. This was the key feature of the
firm’s marketing campaign.
Tweets were restricted to English language, and
the target market for this study was the United
Kingdom, since UK is one of the top 10 countries
with active Twitter users worldwide according to
Statista.com. Four main cities in the UK were
targeted: London, Birmingham, Liverpool and
Manchester.
ICEIS 2019 - 21st International Conference on Enterprise Information Systems
268
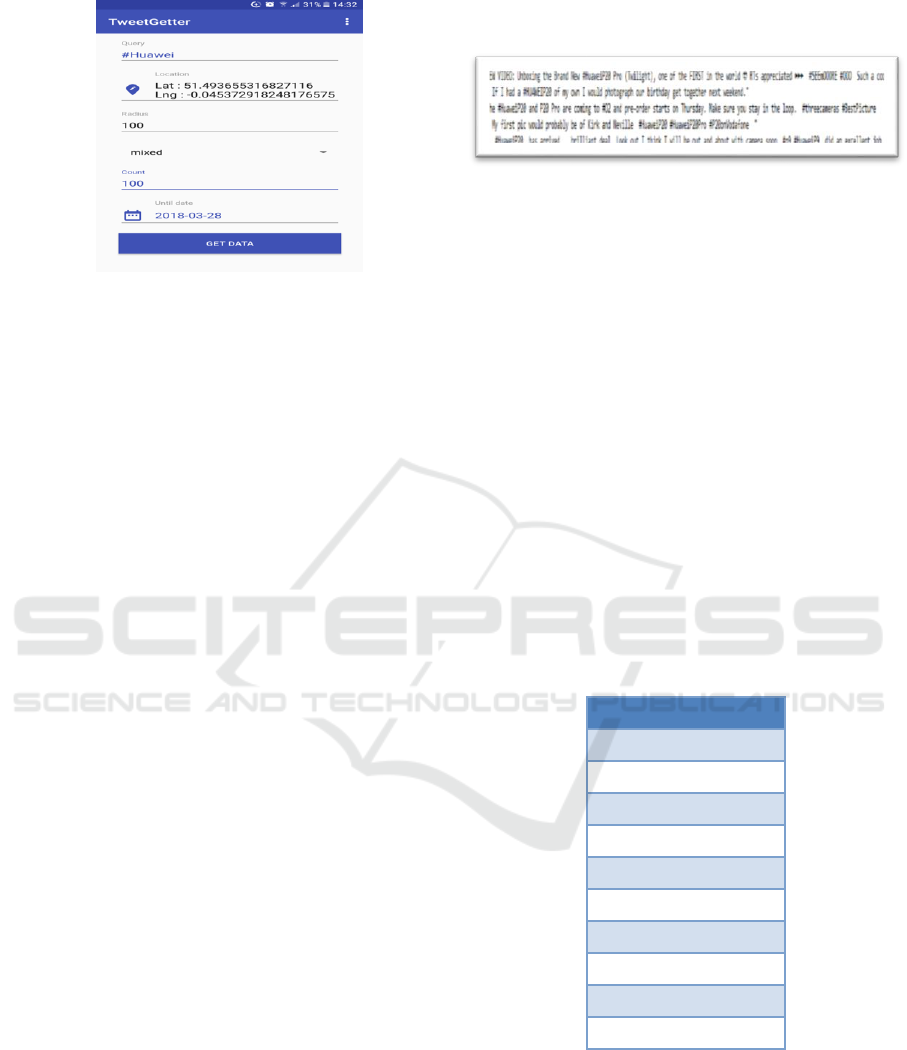
Figure 2: Screenshot of the developed tweet collector
Android application retrieving tweets for keyword
“Huawei” in London area for a specific date.
The data collection was held between 27th of
March 2018 and 11th of April 2018. On the 27th of
March the Huawei smartphones were official
introduced in an event that took place in Paris. This
date was treated as a key milestone in classifying the
data in two categories: before and after product
release.
In order to address the problem of customers
referring to product features using different terms, it
was necessary to create an ontology to enable the
grouping of similar terms under different categories.
This was manually developed based on products’
features categories obtained from the Huawei’s
website.
6 DATA PRE-PROCESSING
Filtering of tweets was a necessary step prior to the
analysis, to eliminate useless metadata information,
and keep tweets as simple format. The filtering
criteria for the Tweets were: inclusion of related
keywords in tweets without information of author’s
username and other irrelevant punctuation symbols.
The evaluated tweets were all in the English
language.
The data gathering tool downloaded tweets in txt
file-format, categorised based on their location and
hashtag keywords. Tweets were organised in sixteen
folds for all four UK cities. For each city the tweets
were organised in four categories based on their
keyword’s hashtags.
The following process describes the data
processing performed over each of the folders
mentioned above as well as on the whole set of files.
A custom tweet cleaner program was specified as a
batch file executed from Windows command prompt
and whose purpose was to consolidate all the *.txt
files placed within the same folder into a single
merged .txt file (named merged.txt).
Figure 3: Example Tweet after cleansing from irrelevant
content.
Following the file merging procedure, the data
was processed to include one tweet per line for better
text manipulation and that included the elimination of
irrelevant information such as characters, usernames,
links, protocols. An example pre-process tweet is
depicted in figure 3.
7 ANALYSIS
The keywords frequency analysis was performed
using an opensource tool that disclaims automatically
unknown symbols (i.e @, #, emojies), words in other
languages and other misleading information. This
process was repeated for each of the 16 files (4 cities
and four keywords).
Table 1: Ranking of the top 10 words that users mentioned
most frequently.
A/A
Word
Percentage
1
huaweip20
9.29
2
pro
7.32
3
huawei
5.63
4
p20
3.93
5
seemoore
2.24
6
paris
2.24
7
new
2.01
8
seemore
1.74
9
smartphone
1.33
10
unboxing
1.03
The first analysis was conducted using the
WriteWords.com and yielded 1142 unique words in
all tweets. Most words appeared in tweets more than
once, so the overall sum of the words was 7581.
Words were subsequently classified according to a
number of themes. For instance, words that were
relevant to the Huawei brand included keywords such
as: Huawei P20, Pro, P20, HuaweiMobile etc.
Online Consumers’ Opinions Analysis for Marketing Strategy Evaluation
269
Similarly, words that were referring to the phone’s
camera were filtered based on keywords:
photography, triple-camera, Leica and so on.
The top 10 most popular words, as mentioned by
users in their tweets are listed in Table 1. The word
“HuaweiP20” was mentioned 9,29% of the time and
the word “pro” 7.32%. The words “seemore” and
“seemooore”, were ranked 5
th
and 6
th
positions, and
referred to the slogan used during the promotion of
the products. The word Paris ranked in the top ten and
denoted the place of the product release. This
however had no relevance to how consumers
perceived the new product and hence was ignored
during the analysis.
Overall, 1174 out of the 4070 words were directly
related to Huawei. Manchester emerged as the city
with the highest number of relevant tweets. This
could be attributed to the fact that it has the highest
proportion of student population among the rest of the
cities that were examined.
Some of the words were written in different
spelling, such as “top” and “toop”, so we considered
these as identical. Each of the words were categorised
as either positive, negative or neutral. This was
performed using the Opinion Lexicon, which
constitutes a list of positive and negative words or
sentiments, compiled by (Hu and Liu, KDD-2004).
All tweets have been evaluated against their polarity
with 28 classified as positive, 10 negative and 12
neutral. The results from this analysis could indicate
that the Huawei P20 release, triggered a positive
reaction by consumers as indicated from the ratio of
the positive over negative words.
Huawei’s strategy as has been evaluated and
analysed in previous section is mainly based on
product-differentiation. Hence, its marketing plan
was to promote the differentiating feature of their
products. In the P20 and P20pro smartphones this was
the triple-camera. From the tweets’ analysis, forty
unique words were detected in the dataset that
described the camera in a positive way. While, from
the overall tweets mentioning the camera, 15%
referred positively to the triple-camera feature.
7.1 Sentiment Analysis
Sentiment analysis (SA) was a necessary component
of this work. Considering the sentiment analysis
methods available, this work assessed tweets that
reflect public opinion regarding the new products and
how this changed with time. SA literature (Pang and
Lee, 2008) provided methodologies from other
studies that utilised information from public opinions
to extract their polarity and content categorisation
(Gamon et ad., 2005).
SA is used to extract static data patterns and
discover dynamic trends (Lei, N. and Moon, S.K.,
2015) based on the emotional state of the author of a
text. SA is a useful for research into online opinions
due to their ability to automatically measure emotion
in online texts. SA includes algorithms to
automatically detect sentiment in text (Pang and Lee,
2008). Certain algorithms assign an overall polarity
to a text while others identify topics that users
discussed along with the polarity of the sentiment
expressed in topics (Gamon et ad., 2005). Three
common sentiment analysis approaches are: Machine
Learning approaches, Lexicon-based methods and
Linguistic Analysis techniques.
A Machine Learning (ML) approach utilises
machine learning techniques and statistics. According
to (Witten et al.,2016), training texts annotated by
human coders in terms of polarity are used to train an
algorithm to detect features that associate with the
three positive, negative or neutral emotions. The
trained algorithm can then look for the same features
in new texts to predict their polarity (Thelwall et al.,
2011). Sets of words, are also used for the algorithm
training.
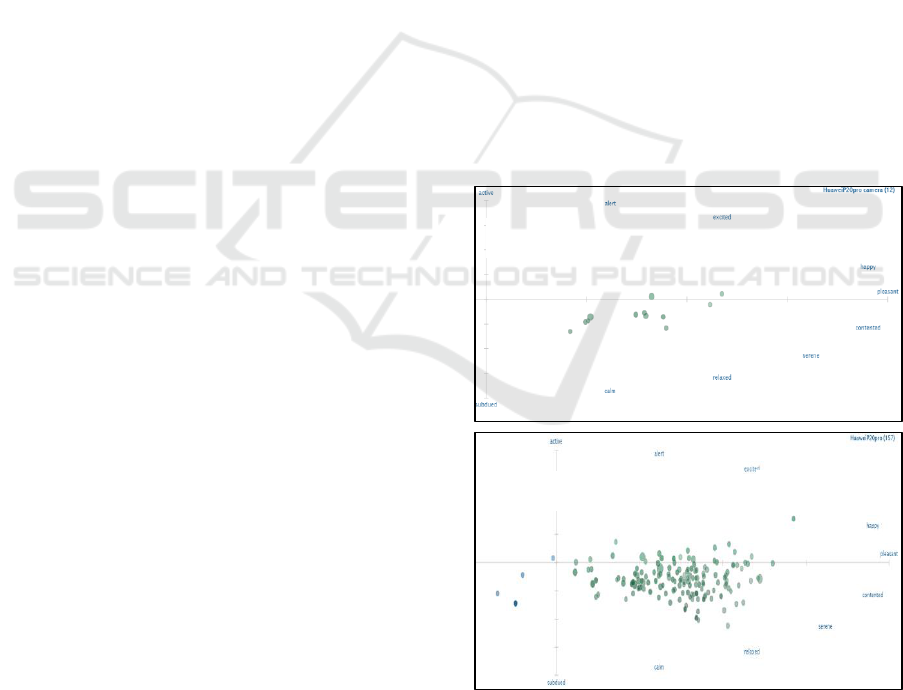
Figure 4: Sentiment analysis for the keywords:
“HuaweiP20Pro” (bottom) and “HuaweiP20Pro Camera”
visualised with the sentiment Viz tool.
Positive sentiment
Negative sentiment
Positive sentiment
Negative sentiment
ICEIS 2019 - 21st International Conference on Enterprise Information Systems
270

The Lexicon Approach is divided into two further
techniques. The first one is the dictionary technique
and the second is the corpus-based approach. It starts
with lists of words that are pre-coded for polarity and
strength, and are used as prior knowledge to evaluate
the overall polarity of a paragraph based on
occurrences of these know words (Thelwall et al.,
2011)
The linguistic analysis method exploits the
grammatical structure of text to predict its polarity,
using a lexicon. For example, linguistic algorithms
identify context and idioms as part of the polarity
prediction process (Thelwall et al., 2011).
From the above three techniques in the field of
Sentiment Analysis we selected the ML approach
since it produces more accurate results. There are two
basic ML methods that can be used for polarity
classification, which are considered as the most
efficient and simple to use:
Naïve Bayes classification
Support Vector machines
For these techniques it is important to train the
classifier using supervised learning techniques. A set
of training datasets should be used with cases that
already have been assigned as negative, positive or
neutral. In our case we used the tweeter sentiment
corpus.
The Naïve Bayes Model is more commonly used
in cases when we examine the polarity of a sentence
by recognising the polarity of each word individually.
The support vector machines is better for large texts
(phrases) or combinations of words. However, since
in Twitter, we deal with short texts, we initially
decided to use the first model.
Despite its popularity, SA and its techniques have
been criticised of their accuracy and specifically with
regards to the detection of polarity of plain text
contents. For example, in certain domain the accuracy
of sentiment analysis was lower than 50% with less
precision in detecting negative sentiments (Jongeling
et al, 2015). To escape from this problem, we
concentrated on positive and negative words alone, as
they appear in tweets and referred to the product
under study. This process identification was
performed automatically. Plus, we constrained the
search criteria to specific keywords and hence
eliminated irrelevant tweets that could have
influenced the results.
To validate our results with other methods, we
used the SentimentViz tool to obtain the overall
sentiment of consumers with regards to Huawei’s P20
for the same period of analysis. Figure 4 illustrates the
overall sentiment for the “HuaweiP20Pro” keyword.
This represents the distribution of the keywords
across the sentiment scale. The tweets in Figure 4 lean
towards the positive side of the spectrum indicating
that consumers perceived positively the new product
and its differentiating features. Similarly, the camera
keyword shows a positive sentiment as indicated also
in figure 4. Both observations confirm the results
performed from our preliminary analysis. Each tweet
is shown as a circle positioned by sentiment, an
estimate of the emotion contained in the tweet's text.
Circles correspond to tweets. Negative tweets are
drawn as blue circles on the left, and positive tweets
as green circles on the right.
8 RESULTS
From the analysis of the data, we identified
preliminary evidence which could indicate that
Huawei’s marketing strategy had a positive impact on
their targeted users. The product positioning plan of
the firm was to differentiate on price and
technological features such as the use of the Leica
triple-camera. Preliminary results showedthat
consumers received well the new triple camera
feature of P20 and referred to it in their tweets with
positive connotations. The new phones triggered
people’s interest as it was also witnessed by Google
Trends search queries in Germany, Spain and Italy for
the same period, that could also indicate an increase
in reputation.
Secondary data regarding company’s sales
performance, verified our preliminary results
regarding the success of the company’s positioning
strategy by targeting consumers and addressing their
needs. Both products were positively received by
consumers and the trend of this effect was not
declining after the first couple of weeks when
consumers had a chance to experiment with the
products. The overall opinion of users’ tweets
analyzed in this paper was positive throughout the
specified time-frame and the ratio of positive over
negative tweets was relatively constant.
This exercise showed that Twitter could be a
valuable tool for predicting and analyzing costumer
behaviour on product release. People through social
media express their views about their experiences
with products. Sentiment Analysis is an important
tool for textual data investigation and marketing
managers should include these capabilities in their
portfolio of tools during analysis of public opinion.
However, analysis of big data should be executed
with consistency and accuracy to produce useful
results.
Online Consumers’ Opinions Analysis for Marketing Strategy Evaluation
271

9 CONCLUSIONS
Product positioning is key in targeting the right
consumers. Commercial organisations continuously
monitor their product positioning by gathering data
online and offline. Products mispositioning however,
could jeopardise the marketing strategy of a company
and should be avoided. Validating strategies early in
the product release cycle constitute a vital process for
effective sales performance. Therefore, companies in
addition to other information sources, should also
utilise data from the blogosphere to understand
customers’ opinions in real time and accordingly
respond to their needs (Al-Obeidat, F., Spencer, B.
and Kafeza, E., 2018). Data mining can help
enterprises resolve marketing issues and improve
product positioning through quicker analysis of
online consumers opinions.
This work presented a technique for evaluating
product positioning using eWOM analysis. An
application of eWOM analysis was also presented, for
the marketing strategy of two Huawei smartphones.
Limitations of this work lie in the small sample size
which concentrated on specific geographical regions.
For future work the authors are considering
expanding on the methodology to evaluate the impact
of marketing strategies using more sophisticated
sentiment analysis techniques with less false positives
and false negatives rates and hence require less
manual evaluation.
REFERENCES
Jung, J. J., 2008. Taxonomy alignment for interoperability
between heterogeneous virtual organizations. Expert
Systems with Applications, 34(4), pp.2721-2731.de
Chernatony, L. (2000). Succeeding with brands on the
Internet. Brand Management, 8(3), 186-195.
Forbes, 2018 (https://www.forbes.com/companies/twitter/)
Retrieved 10 April 2018
Statista, 2018 (https://www.statista.com/statistics/282087/
number-of-monthly-active-twitter-users/) Retrieved 13
April 2018
Huawei, 2018 (http://www.huawei.com/en/about-huawei/
corporate-information/milestone) Retrieved 14 April
2018
Sagolla, D. (2009). 140 characters: A style guide for the
short form. Hoboken: Wiley.
Jansen, B. J., Zhang, M., Sobel, K., & Chowdhury, A.
(2009). Twitter power: Tweets as electronic word of
mouth. Journal of the American Society for Information
Science, 60(11), 2169-2188.
Zhang, M., Jansen, B. J. and Chowdhury, A., 2011.
Business engagement on Twitter: a path analysis.
Electronic Markets, 21(3), p.161.
Wauters, R. (2009). Twitter spawned 50,000 apps to date,
will open up firehose for more. Retrieved January 6,
2010, from http://www. techcrunch.com/2009/12/09/
twitter-le-web-2009/.
Keller, E. (2007). Unleashing the power of word of mouth:
Creating brand advocacy to drive growth. Journal of
Advertising Research, 47(4), 448–452.
Chamlertwat, W., Bhattarakosol, P., Rungkasiri, T. and
Haruechaiyasak, C., 2012. Discovering Consumer
Insight from Twitter via Sentiment Analysis. J. UCS,
18(8), pp. 973-992.
Lei, N. and Moon, S. K., 2015. A Decision Support System
for market-driven product positioning and design.
Decision Support Systems, 69, pp.82-91.
Jung, J. J., 2012. Evolutionary approach for semantic-based
query sampling in large-scale information sources.
Information Sciences, 182(1), pp.30-39.
Ferreira, A., 2011. Android OS changes smartphone life
cycle. The Vista, February.
Mostafa, M.M., 2013. More than words: Social networks’
text mining for consumer brand sentiments. Expert
Systems with Applications, 40(10), pp.4241-4251.
Olobatuyi, M. E., 2006. A user’s guide to path analysis.
Lanham: University Press of America, Inc. p.32.
Thelwall, M., Buckley, K. and Paltoglou, G., 2011. Senti-
ment in Twitter events. Journal of the Association for
Information Science and Technology, 62(2), pp.406-418.
Huang, J., Thornton, K. M. and Efthimiadis, E. N., 2010,
June. Conversational tagging in twitter. In Proceedings
of the 21st ACM conference on Hypertext and
hypermedia (pp. 173-178). ACM.
Honey, C. and Herring, S. C., 2009, January. Beyond
microblogging: Conversation and collaboration via
Twitter. In System Sciences, 2009. HICSS'09. 42nd
Hawaii International Conference on (pp. 1-10). IEEE.
Franke, N. and Piller, F. T., 2003. Key research issues in
user interaction with user toolkits in a mass
customisation system. International Journal of
Technology Management, 26(5-6), pp.578-599.
Zhu, F. and Zhang, X., 2010. Impact of online consumer
reviews on sales: The moderating role of product and
consumer characteristics. Journal of marketing, 74(2),
pp.133-148.
Lilien, G. L. and Rangaswamy, A., 2003. New Product and
Brand Management: Marketing Engineering
Applications. Prentice Hall.
Boyd, D., Golder, S. and Lotan, G., 2010, January. Tweet,
tweet, retweet: Conversational aspects of retweeting on
twitter. In System Sciences (HICSS), 2010 43rd Hawaii
International Conference on (pp. 1-10). IEEE.
Petiot, J. F. and Grognet, S., 2006. Product design: a vectors
field-based approach for preference modelling. Journal
of engineering design, 17(03), pp.217-233.
Kwong, C. K., Luo, X. G. and Tang, J. F., 2011. A
methodology for optimal product positioning with
engineering constraints consideration. International
Journal of Production Economics, 132(1), pp.93-100.
Pang, B. and Lee, L., 2008. Opinion mining and sentiment
analysis. Foundations and Trends® in Information
Retrieval, 2(1–2), pp.1-135.
ICEIS 2019 - 21st International Conference on Enterprise Information Systems
272

Gamon, M., Aue, A., Corston-Oliver, S., & Ringger, E.
2005. Pulse: Mining customer opinions from free text.
Lecture Notes in Computer Science, 3646, 121–132.
Witten, I. H., Frank, E., Hall, M. A. and Pal, C. J., 2016.
Data Mining: Practical machine learning tools and
techniques. Morgan Kaufmann.
Kim, S. M. and Hovy, E., 2004, August. Determining the
sentiment of opinions. In Proceedings of the 20th
international conference on Computational Linguistics
(p. 1367). Association for Computational Linguistics.
Martinčić-Ipšić, S., Močibob, E. and Perc, M., 2017. Link
prediction on Twitter. PloS one, 12(7), p.e0181079.
Khade, A.A., 2016. Performing customer behavior analysis
using big data analytics. Procedia computer science,
79, pp.986-992.
Jongeling R, S. Datta, and A. Serebrenik. Choosing your
weapons: On sentiment analysis tools for software
engineering research. In Proceedings of the
International Conference on Software Maintenance
and Evolution, pages 531–535, 2015.
Nayab G , Bilal M , Shrafat A, 2016, “A brand is no longer
what we tell the customer it is - it is What customers tell
each other it is: Validation from lahore, Pakistan,
Sci.Int. (Lahore), 28(3),2757-2762.
Chih-Hsuan W, 2015, A market-oriented approach to
accomplish product positioning and product
recommendation for smart phones and wearable
devices, International Journal of Production Research,
53:8, 2542-2553.
Hair, J. F., Black, W. C.,Babin, B. J., & Anderson, R. E.
2009. Multivariate data analysis (7th Ed.). Upper
Saddle River, NJ: Prentice Hall.
Online Consumers’ Opinions Analysis for Marketing Strategy Evaluation
273
