
A Community Detection Approach for Smart-Phone Addiction
Recognition
Fabio Cozzolino
1
, Vincenzo Moscato
1
, Antonio Picariello
1
and Giancarlo Sperli
2
1
DIETI, University of Naples Federico II, Italy
2
ITEM National Lab, CINI, Naples, Italy
Keywords:
Smart-Phone Addiction, Knowledge Discovery, Social Network Analysis, Community Detection.
Abstract:
In this paper, we present a novel approach for Smart-Phone Addiction recognition that leverages community
detection algorithms from the Social Network Analysis (SNA) theory. Our basic idea is to model data con-
cerning users’ behavior while they are using mobile devices as a particular social graph, discovering by means
of SNA facilities patterns that better identify users with a high predisposition to smart phone addiction. Even-
tually, several experiments on a sample of users monitored for several weeks have been carried out to verify
effectiveness of the proposed approach in correctly recognizing the related addiction degree.
1 INTRODUCTION
During the last years Psycho-Informatics has attracted
more and more the interest of researchers in order to
better understand human behavior within the mod-
ern “data-rich” world: it consists of the application
of novel methodologies for acquisition, management
and analysis of vast quantities of psychological data,
combining behavioral psychology and computer sci-
ence techniques (Markowetz et al., 2014).
Indeed, one of the most natural way for eliciting
nowadays persons’ habit is the analysis of their smart
phones’ data. Unfortunately, the variety of function-
alities that such devices offer – including the use of
the Internet for web browsing, on-line games, digi-
tal cameras, GPS navigation, and a lot of interactive
and social applications – can deeply capture attention
of users, who could be dangerously distracted from
real events ((Hooper and Zhou, 2007)). Several recent
studies (Leung, 2008) have shown how their excessive
use, namely Smart-Phone Addiction, can generate dif-
ferent complications for users’ health, especially psy-
chological pathology: lack of self-control, abstinence,
insomnia, social isolation, depression, difficulty of
concentration, as well as signs of irritability, restless-
ness, stress and mood changes (Ch
´
oliz et al., 2016;
Ha et al., 2008; Ben-Yehuda et al., 2016).
In according to the most recent vision, Smart-
Phone Addiction can be defined as “an unstoppable
and uncontrollable desire of using a smart phone de-
spite its negative and harmful effects” (De-Sola et al.,
2017). The smart-phone addiction does not easily
fit the standard classification of psycho pathologi-
cal disorders provided by the Diagnostic and Statis-
tical Manual of Mental Disorders (DSM). Thus, try-
ing to recognize persons’ predisposition with respect
to such new pathology, by means of the application
of novel methodologies and techniques from Psycho-
Informatics, turns out to be very important.
The main idea behind our work is to propose a
novel methodology based on the application of com-
munity detection algorithms from the Social Network
Analysis theory on a particular “social graph” that
considers users’ behaviors during the usage of their
mobile phone. In particular, we provide answers to
questions such as: How much smart-phone addicted
is a particular user? What is the app preferred by a
smart-phone addicted user?
To these aims, we designed and realized a frame-
work for monitoring and evaluating users’ behavior
with respect to the use of mobile devices for support-
ing smart-phone addiction diagnosis and assessment.
Successively, we have analyzed the collected data for
identifying possible social patterns that characterize
users with a high predisposition to smart phone addic-
tion, in conjunction with the analysis of well-known
self-assessment tests that are currently used by psy-
chologists to determine the onset of such pathology.
Eventually, an experimental evaluation was car-
ried out on a significant sample of users (aged be-
tween 19 and 50 years) monitored for several week
in order to verify the reliability and effectiveness of
Cozzolino, F., Moscato, V., Picariello, A. and Sperli, G.
A Community Detection Approach for Smart-Phone Addiction Recognition.
DOI: 10.5220/0007839100530064
In Proceedings of the 8th International Conference on Data Science, Technology and Applications (DATA 2019), pages 53-64
ISBN: 978-989-758-377-3
Copyright
c
2019 by SCITEPRESS – Science and Technology Publications, Lda. All rights reserved
53

the proposed approach in correctly recognizing and
calssifying the related addiction degree.
The paper is organized as in the following. Sec-
tion 2 provides a review of the Related Work on
smartphone addiction problem. In Section 3, we
describe the proposed methodology for evaluating
users’ smartphone addiction with respect to their mo-
bile devices. System architecture and experimental
results are then presented and discussed in Sections 4
and 5. Finally, conclusions are reported in Section 6.
2 RELATED WORK
The most diffused clinical methods – based on psy-
chometric questionnaires and interviews – for smart
phone-addiction prediction presents several limita-
tions that can be synthesized in the following points
(Markowetz et al., 2014): i) coarse temporal granular-
ity, ii) considerable costs, iii) distortion and poor ob-
jectivity of the available data, iv) impossibility of spe-
cialists to perform an ongoing patient’s assessments
and interventions, v) subjectivity of evaluations.
In more details, researchers actually rely on spe-
cific clinical experiments and self-assessed psycho-
metric tests to perform diagnosis of user’s mental ill-
ness related to the smart phone addiction pathology.
Even though these methods have found a widespread
application in research, they are not used yet in clin-
ical practice due to difficulty in managing the related
data and to the cost of obtaining and storing them.
Several works have recently offered solutions to
the smart phone addiction problem to overcome the
discussed limitations.
First of all, several correlations between the ex-
cessive usage of smart-phones and the Internet Ad-
diction (which literature is quite consolidated) have
been commonly observed in many studies (Ben-
Yehuda et al., 2016), even if a recent review (De-
Sola Guti
´
errez et al., 2016) discusses some peculiar
characteristics that clearly distinguish the two phe-
nomena. The authors have shown that smart-phone
addicted users are mostly young and female that seek
social gratifications, while Internet-dependent indi-
viduals are more likely to be males and socially in-
troverted.
The majority of works focusing on smart-phone
addiction proposed statistical approaches to correlate
smart-phone addiction to different mental problems.
(Bian and Leung, 2015) defined a statistical model
that underlines how some smart-phone usage pat-
terns within a social context can be considered spe-
cific symptoms of smart-phone addiction. A different
perspective has been then analyzed in (Van Deursen
et al., 2015), where authors demonstrate as social
stress can influence a smart-phone addiction behav-
ior. In addition, (Samaha and Hawi, 2016) and (Sano
and Picard, 2013) discovered interesting relationships
among smart-phone addiction, level of stress and
school performances.
Concerning frameworks to support the smart-
phone addiction analysis, (Lee et al., 2014) realized a
system, namely SAMS (Smart-phone Addiction Man-
agement System and Verification) able to perform
a statistical analysis of relationships between smart
phone apps and the possible levels of dependency.
Furthermore, the Smart-phone Overdependence Man-
agement System (SOMS) (Lee et al., 2016) has been
implemented to analyze user behavioral models that
can directly cause excessive dependence on smart
phones and also to prevent and to monitor excessive
smart-phone usage managing the assessment of pa-
tients. Finally, in (Lawanont and Inoue, 2017) it has
been designed an architecture for the recognition of
smart-phone addiction based on a classification model
that analyses only some particular psychometric vari-
ables (such as average/minimum/maximum duration
of smart phone usage per unlock, number of apps’
context-switches, average duration of smart phone,
number of unlocks, number of reebots, etc.) acquired
by mobile devices.
Summing up, the results derived by the adoption
of SAMS and SOMS, an other very recent studies
(Lawanont and Inoue, 2017) showed strong correla-
tions between dependency on smart-phones and eval-
uation of the daily usage of these devices, both by
means acquisition and analysis of some specific psy-
chometric variables and statistics relating to the inter-
action between users and mobile applications. Table
1 summarizes the main prominent approaches.
3 METHODOLOGY
Here we propose a Multi-source Smart phone Addic-
tion Analysis (MSAA), a novel approach for recogniz-
ing users affected by the smart-phone addiction syn-
drome. We model the interactions between users and
mobile devices as a particular social graphs leverag-
ing community detection algorithms from Social Net-
work Analysis theory to infer useful social patterns
that describe different categories of social addiction
degree.
The MSAA approach is formed by four main
phases:
• the first stage concerns acquisition and clean-
ing of data generated by the different actors
(users/participants and psychologists/supervisor);
DATA 2019 - 8th International Conference on Data Science, Technology and Applications
54
Table 1: Smart-phone addiction approaches.
Authors Outcome
(Bian and Leung, 2015)
Identification of some smart phone usage patterns
within a social context as symptoms of smart phone
addiction symptoms.
(Van Deursen et al., 2015)
Analysis of social stress’s influence on
smart phone addiction behavior.
(Samaha and Hawi, 2016)
Identified relationships among smart phone
addiction, level of stress and school performances.
(Sano and Picard, 2013)
Use of wearable sensors and mobile phones
for stress recognition.
(Lee et al., 2014)
Identification of relationships between smart phone
apps and the possible levels of dependency.
(Lee et al., 2016)
Analysis of user behavioral models that can
directly cause excessive dependence on smart phones.
(Lawanont and Inoue, 2017)
Analysis of psychometric variables for
smartphone addiction classification.
• in the second phase, we model the gathered in-
formation through a graph data structure, namely
Initial Global Graph (IGG);
• the third phase produces an enriched version of
IGG, namely Final Global Graph (FGG), by com-
puting new edges based on the analysis of three
different types of relationships (between users,
between users and apps and between apps);
• the fourth and last stage performs a community
detection algorithm on FGG for classifying users
into four communities related to different levels of
smart-phone addiction combining self-assessment
test scores and the data obtained by the monitor-
ing phase.
3.1 Knowledge Base Building
Formally, we model users’ behavior while they are us-
ing their smart-phones as a directed a-cyclical graph,
namely Initial Global Graph (IGG).
Definition 3.1 (Initial Global Graph). An Initial
Global Graph is the pair IGG = (V, E), V being a
set of Vertices, composed by four entities: users,
supervisors, tracking days, apps; E being a set of
Edges, formed by three types of relationships: user-
to-supervisor, user-to-tracking day, tracking day-to-
app.
Table 2 describes in more details both entities and
relationships in the IGG graph.
The IGG has been implemented by means of a par-
ticular property graph, in which both nodes and edges
are particular Abstract Data Type (ADT). Supervi-
sor/clinical and user have both personal attributes
but on one hand a supervisor can also choose test’s
type, psychometric variables and weights for the Re-
cency Frequency Duration (RFD) analysis (Lee et al.,
2014); on other hand, user node has the obtained score
to the assessment test. Furthermore, several features
related to the number of locks, reboots, average, max-
imum and minimum usage for unlock and pedometer
values have been chosen for app nodes.
In Figure 1 an example of IGG is shown.
3.2 Knowledge Discovery Process
In this step, we perform an enrichment of IGG by
computing new edges between the existing nodes. We
leverage three different types of relationships: be-
tween users, between users and apps and between
apps. These relationships are generated by means
of a knowledge discovery process that aims to infer
several useful correlations between involved entities
from different points of view.
The user-to-user edges are focused on the dif-
ference between smart-phone addiction levels of two
users. More in details, we compute the Smart-
phone Addiction User Level (SAUL) for each user,
which corresponds to the sum of two terms: the self-
assessment test score (T S) and the average weighted
sum of the different psychometric variables related to
the smart-phone usage. The SAUL value is defined as
in the following:
SAUL = T S +
N
PV
∑
j=1
(
∑
N
T D
i=1
w
j
· PV
ji
N
T D
) (1)
N
PV
and N
T D
being respectively the number of psy-
chometric variables related to the smart-phone use
and the tracking days for each user, PV
ji
representing
the j−psychometric variable related to i−th monitor-
ing day and w
j
corresponds to the weight assigned
A Community Detection Approach for Smart-Phone Addiction Recognition
55
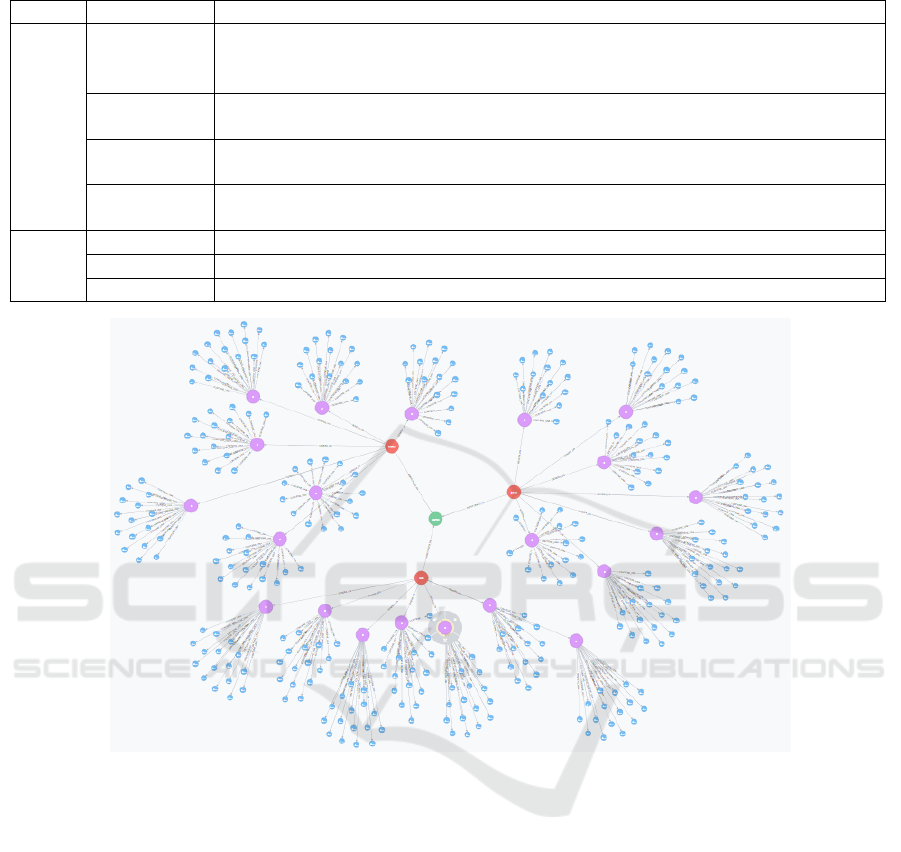
Table 2: Initial Global Graph entities and their relationships.
Label Meaning
Nodes
Supervisor
The clinician/supervisor that monitors the various users.
She/he registers to the platform the self-assessment tests for users.
She/he selects weights to be attributed to the psychometric variables.
User
User/participant who executes the self-assessment test.
She/he is then monitored for a given period.
TrackingDay
Single day during which a user is monitored.
It contains the daily values of the psychometric variables for a given smartphone.
App
Single app used by a user during a tracking day.
It contains different daily usage data of the app.
Edges
Monitored
Relationship between supervisor and monitored user.
Produced
Relationship between the psychometric variables of a tracking day and users.
Related
Relationship between data about used apps and tracking days.
Figure 1: Example of IGG graph at the end of the monitoring of 3 users. It is possible to note that the presence of a Supervisor
node (in green), 3 User nodes (in red), 7 Tracking Day nodes (in purple) for each user and several App nodes (in blue) for
each tracking day.
to of j−th psychometric variable. Successively, the
edge direction is assigned by comparing the SAUL co-
efficients of user pairs, since it indicates a greater de-
pendence of the source user node with respect to the
destination one. Finally, we compute the relationship
weight as difference between the SAUL coefficients
of the analyzed user pairs.
The second family of relations is composed by
user-to-app relationships that connect each user to the
related most used apps according to a RFD analysis
for each tracking day. In particular, the RFD analy-
sis is based on the following three parameters: i) Re-
cency (R) corresponds to the elapsed time since the
last use of the application by a user u within a certain
period T ; ii) Frequency (F) is the number of times a
user u has interacted with the application a within a
certain period T; iii) Duration (D) represents the total
duration of effective interaction with the application
a by a user u during the period T . This analysis aims
to provide an estimation about user’s preferences of a
given application. The RFD score is defined as fol-
lows:
RFD = w
R
· R + w
F
· F +w
D
· D (2)
w
R
, w
F
, w
D
being the assigned weights to each com-
ponent of RFD analysis based on its importance and
according to the application goals. Analyzing the
RFD value it is easy to understand how the applica-
tions have been used more recently, more frequently
and for longer times will probably be preferred by
users.
Finally, the app-to-app edges represent the usage
relationships between pairs of user apps in the same
DATA 2019 - 8th International Conference on Data Science, Technology and Applications
56
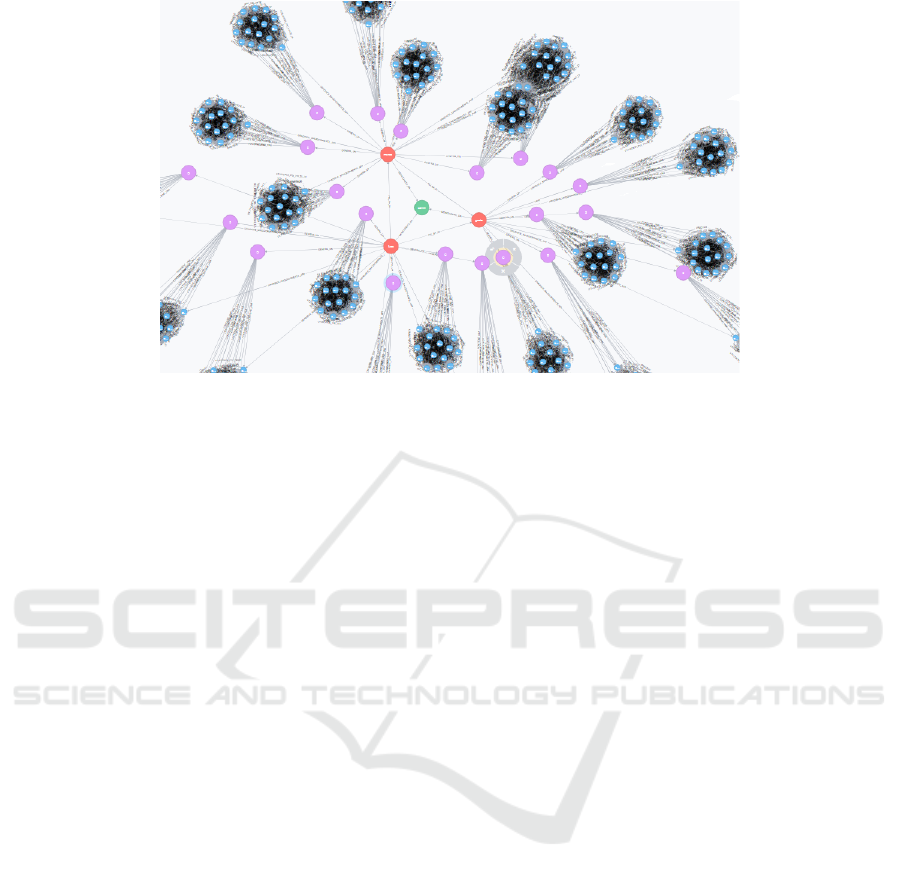
Figure 2: Example of FGG graph.
monitoring day. In particular, these relationships con-
sider several parameters, such as the usage chronolog-
ical order of apps in a single monitoring day, the dif-
ferences in terms of duration/frequency of usage be-
tween apps, the differences in terms of the quantity of
bytes transmitted/received via Internet connection be-
tween apps. The weight of each edge is computed as
the difference between the pairs of homologous fea-
tures related to two examined nodes.
In conclusion, we have an enriched version of
IGG, namely Final Global Graph (FGG), inferring
the discussed new edges for increasing information
necessary to smart-phone addiction analysis. We de-
fine the FGG as in the following.
Definition 3.2 (Final Global Graph). The Final
Global Graph is the pair FGG = (V, E), V being a
set of Vertices composed by users, supervisors/clinics,
tracking days and apps; E being a set of Edges
composed by user-to-supervisor, user-to-tracking day,
tracking day-to-app, user-to-user, user-to-app and
app-to-app relationships.
Figure 2 shows an example of FGG, derived from
the IGG graph of Figure 1.
3.3 Smart-Phone Addiction Community
Detection Algorithm
The FGG can be seen as a sort of knowledge base for
supporting several applications. Here, we describe the
proposed approach for community detection over the
extracted FGG.
In our vision, the inherent semantic of user-to-
user relationships plays a key role for identifying user
nodes’ groups according to their smart-phone addic-
tion level. In addition, we also exploit the RFD anal-
ysis values between users and apps belonging to the
“communication” and “social” categories (i.e. What-
sapp, Facebook, Messenger, etc), because, as shown
in (Salehan and Negahban, 2013), they represent the
most useful applications for smart-phone addiction.
In particular, we define a Weighted Users Ma-
trix that jointly considers the two described contribu-
tions to identify groups of users suffering of the same
pathology.
Definition 3.3 (Weighted Users Matrix). A Weighted
User Matrix is the matrix:
Θ = {θ
i j
} =
(
(1 − ∆
SAUL
i j
) + (1 −
∑
a∈A
∆
RFD
i j|a
) i f i 6= j
0 i f i = j
A being a subset of apps in FGG, ∆
SAUL
i j
is the
difference of SAUL values between user i and user j
and ∆
RFD
i j|a
represents the sum of difference of RFD
analysis between two users i and j w.r.t. apps in A.
Following the idea discussed in (Gupta and Ku-
mar, 2016), we propose as community detection ap-
proach a vertex selection strategy that guarantees
high coverage and good conductance on expansion
of communities. However, we enhance the meth-
ods in (Gupta and Kumar, 2016) in according to: (i)
the data-model, that integrates both information about
users and their behaviors with respect to used smart
phone’s apps modeled by a property graph data struc-
ture; (ii) the comparison of users’ behavior with re-
spect to the apps relevant for smart-phone addictions;
(iii) a new way to build the user-to-user matrix com-
bining topological features and nodes’ attributes.
In the following, we report the algorithm exploited
for community detection.
More in details:
A Community Detection Approach for Smart-Phone Addiction Recognition
57
Algorithm 1: Community detection algorithm.
1: procedure SA Community Detection(FGG)
2: C ←
/
0
3: Compute Matrix θ
4: while more visited nodes do
5: C
i
=
/
0
6: u ← argmax
u∈U
{
∑
v∈U
θ
vu
}
7: C
i
← C
i
∪ {u}
8: while (φ(C
i
) − φ(
ˆ
C
i
) ≥ 0) do
9: u ← argmax
u∈U
{
∑
v∈U
θ
vu
}
10: C
i
← C
i
∪ {u}
11: end while
12: C ← C ∪C
i
13: i ← i + 1
14: end while
15: return C
16: end procedure
• (lines 5-7) – the algorithm identifies the nodes
showing the highest weight degrees as seed nodes.
The weighted degree of node u is computed as the
sum of column related to user u of the Weighted
User Matrix.
• (lines 9-11) – successively, the conductance mea-
sure has been used to evaluate the quality of
community during the expansion phase: in fact,
the increase of users in the examined commu-
nity corresponds to a decrease of conductance
value. The conductance is defined as φ(C
i
) =
cut(C
i
)
min{deg(C
i
),deg(
¯
C
i
)}
, where cut(C
i
) denotes the size
of a cut induced by C
i
,
¯
C
i
is the complement set of
C
i
and deg(C
i
) is the sum of degrees of vertices in
C
i
.
• (lines 8-11) – once a seed node is identified, we
perform an incremental expansion of the commu-
nity for including the user that maximize the de-
creasing value of conductance. This is an iterative
process until the conductance difference related to
communities computed in successive steps does
not assume a negative value.
4 SYSTEM ARCHITECTURE
The system consists of a client-side application, to
be installed on the users’ mobile devices, and a web
server-side application, responsible for the data ac-
quisition and analysis through the methodological ap-
proach previously illustrated.
The entire system architecture together with the
adopted technologies are shown in Figure 3, that has
been deployed – at the moment – only for Android
Platforms..
More in details, the client-side consists of an An-
droid app: after the sign-up procedure, users can exe-
cute a self-assessment test whose typology is chosen
by clinicians. In addition, once the mobile device has
been set to start the smart-phone addiction recogni-
tion process, the user can access to a personal web
page on the server, containing the summary data con-
cerning personal test score and the current daily mon-
itoring statistics (both in terms of apps’ usage and of
interactions with the smart phone).
The Android app continuously monitors the run-
ning applications on the mobile device (Apps Usage
Statistics module), and also, the different user/smart-
phone interactions (Smart-phone Usage Statistics
module), locally storing the usage records (mainly
on a SQLite database but also through Shared Prefer-
ences mechanisms) by means of the Data Persistence
module. Furthermore, users can perform a real-time
self-monitoring of their smart phone usage level (Self-
Usage Check module) by viewing along the monitor-
ing period both the usage data related to the individual
apps and the entire interaction with the mobile device.
The data acquired by the mobile device using Android
apps are locally and daily stored and sent to the web
server at the end of the observation week of monitor-
ing (Statistic Server Upload module).
From the server side, the clinician performs the
registration operations to the system (Sign up), setting
also the type of test to be submitted to the users and all
the weights related to the psychometric variables. The
clinician can access to a personal web page contain-
ing the summary data (at various levels of detail) of
the users involved in the monitoring process. In par-
ticular, it is possible to view the information related
to the daily statistics and those resulting from several
analytics (Graph Analysis, RFD Analysis, Link Anal-
ysis and Graph Community Detection). Daily usage
records from the Android app at the end of the moni-
toring period are then stored stored into Neo4j graph
database. All the data processing and analytics fa-
cilities have been implemented using Scala functions
within the Apache Spark framework.
5 EXPERIMENTS
5.1 Dataset and Experimental
Environment
To test the reliability and the effectiveness of the de-
veloped system, several experiments were carried out
on a sample of about 50 users (aged between 12 and
77) monitored for a period of 7 days (from Monday
DATA 2019 - 8th International Conference on Data Science, Technology and Applications
58
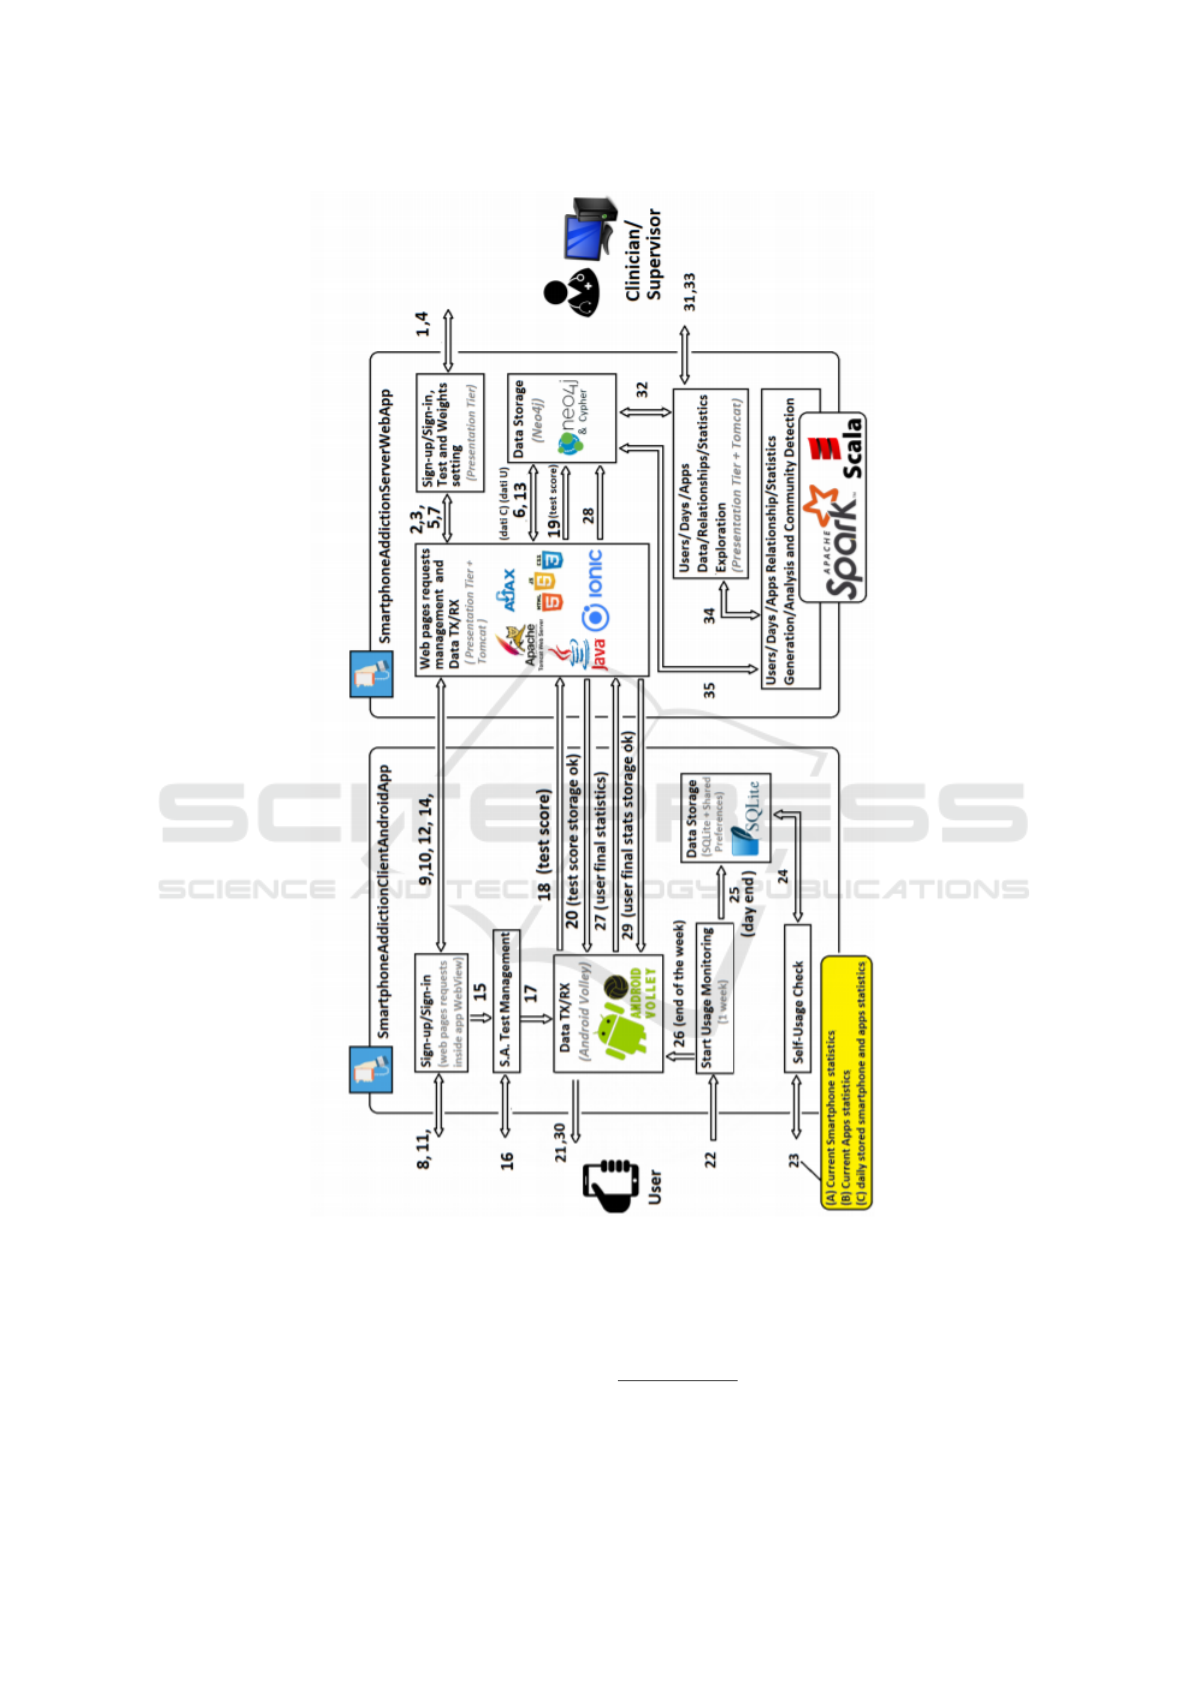
Figure 3: System Architecture and Data Flow.
to Sunday).
Figure 4 shows the characterization of the users.
Note that we selected users in order to have the
same number of samples with respect to different age
groups (12-17, 18-27, 28-40, 40-60, 60-77). People
were randomly selected from a urban area, related
(relatives, friends) to students of our Lab, and no a-
priori knowledge was used except that they used ex-
tensively their smart phones for work or fun
1
. The
dataset is also composed by information about users’
behavior with respect to the use of mobile devices (i.e.
bytes transmitted/received via Internet or data con-
1
The participants provided informed consent (by parents
in case of minors) and all the assessed data were preserved
in a suitably protected database.
A Community Detection Approach for Smart-Phone Addiction Recognition
59
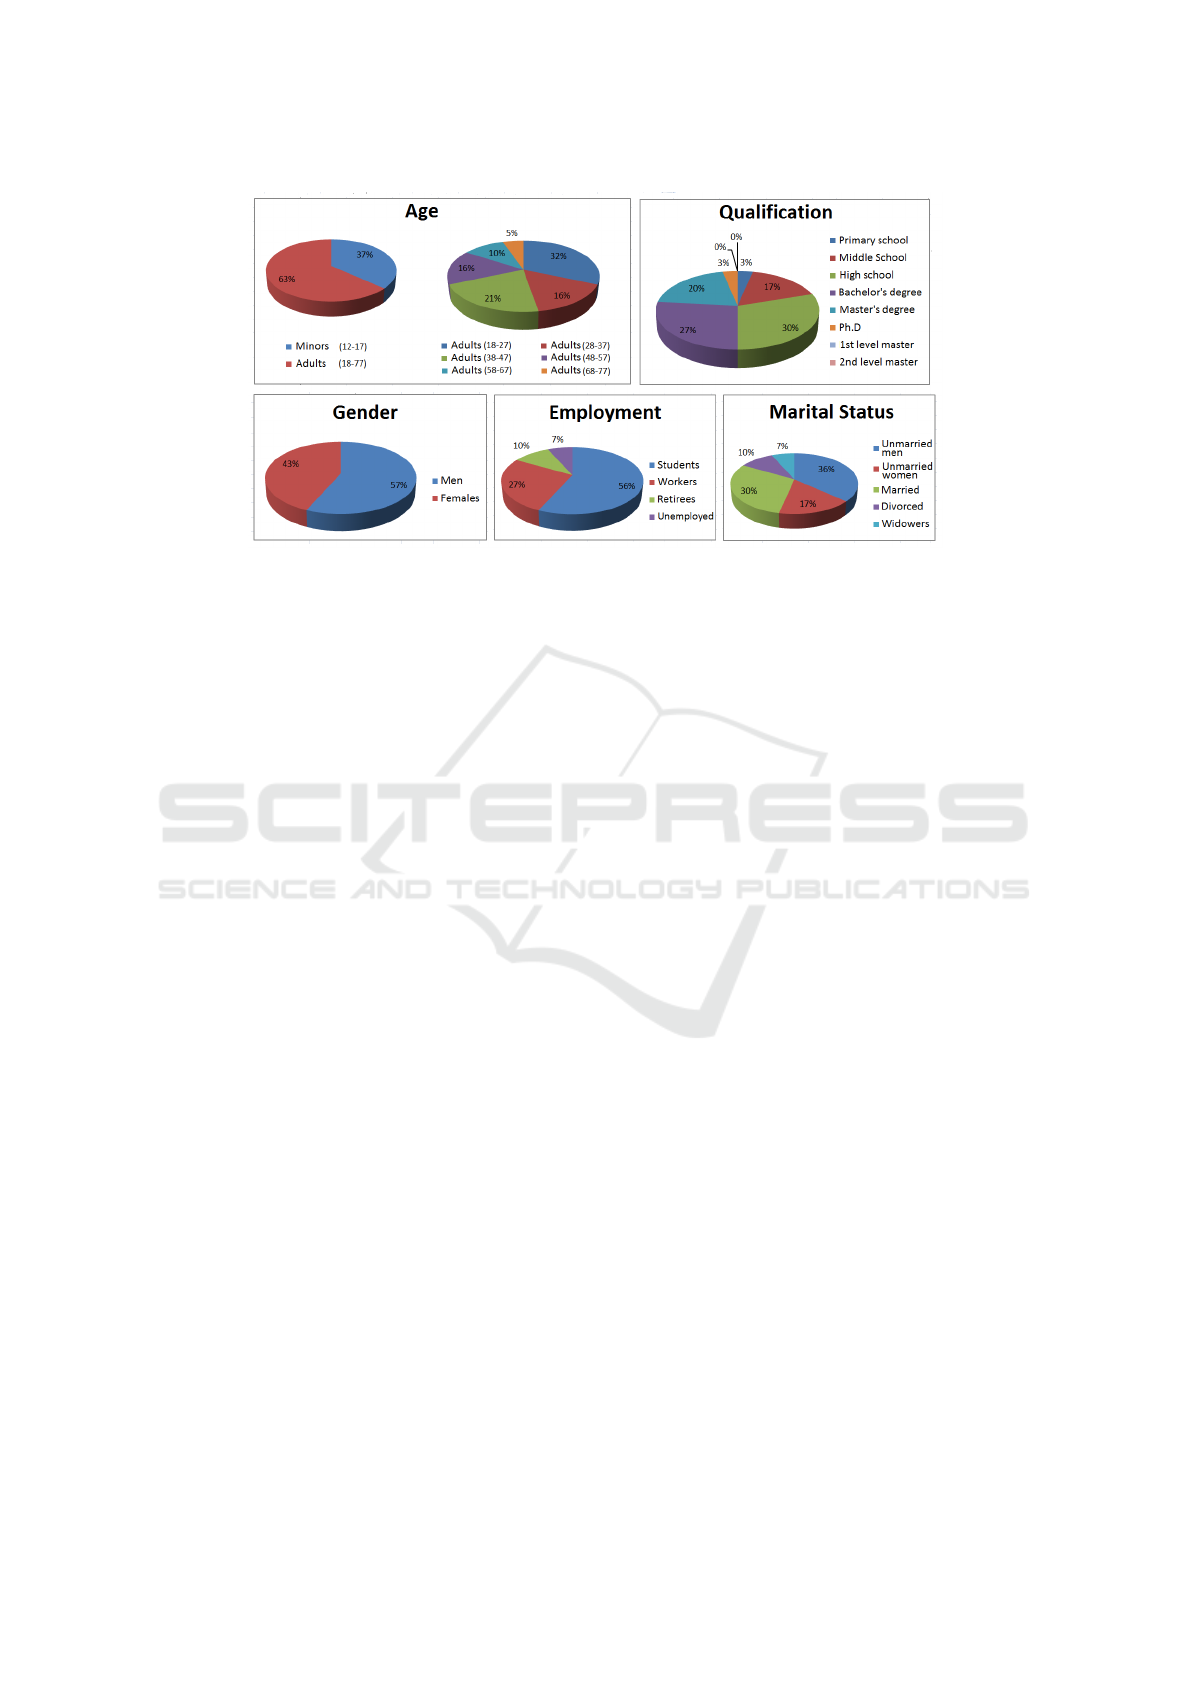
Figure 4: Dataset characterization.
nection between apps and so on). In this evaluation
we show how the use of our system offers interesting
perspectives, automatically detecting and classifying
behaviours and life-style of users.
The main characteristics of the used client and
server side hardware/software infrastructure for ex-
periments are summarized in the Table 3.
5.2 Experimental Protocol
The experimental protocol is composed by 4 main
stages.
The first stage consists of the registration of the
clinician/supervisor to the system by creating a proper
account, together with the setting of the particular
type of test to be administered to the participants
(choosing between IAT, UADI, NMP-Q, MPACS and
SAS-SV) and the setting of the psychometric vari-
ables weights related to the RFD analysis and to the
calculation of the SAUL coefficient of each user.
The second stage consists of explaining to the po-
tential participants the aims of the experiments: if one
chooses to participate, the Android application will be
installed on her/his smart phone, also registering the
necessary information within the system and the sub-
sequent execution on the app of the specific assess-
ment test of the level of smart-phone addiction. The
application will compute the test score and send it to
the server.
In the third stage, all the subjects – that have com-
pleted the test – can start the weekly monitoring of
their devices. Monitoring acts as a background ser-
vice allowing subjects to close the application and use
their smart phone normally.
In the fourth stage, at the end of the monitoring
period, the clinician/supervisor uses the data related
to all users who have completed the monitoring and,
through appropriate interface, obtains different types
of statistics (at various levels of granularity) as well
as the result of the community detection algorithm.
The aim of the provided evaluation is to:
• detect the kind of applications that exerts more in-
fluence on users and may represent a possible fea-
ture for predicting smart-phone addiction;
• detect the users’ categories that shows a possible
correlation with smart-phone dependence;
• analyze the usage patterns for better discriminate
addicted vs not addicted users;
• compare the outcome of our proposed technique
with respect to surveys methods.
5.3 Popularity and Category
Applications Analysis
First of all, we have conducted a popularity analysis
of the applications w.r.t. the weekly usage of users’
smart-phones . The top 10 ranked applications (out
of a total of 124) on the basis of the duration and fre-
quency of their average daily use can be seen in Table
4.
The contrast between duration and frequency of
use for each application is due to the related category.
WhatsApp, Messenger, Instagram and Snapchat, be-
longing to the Social/Communication category, have a
greater tendency to be used more frequently, with less
usage time. Other categories such as Game and Me-
dia & Video, to which applications such as YouTube
or the FarmVille game belong, for example, are used
less frequently: however, once a user runs these ap-
plications, the usage time is extended.
According to the study of (Salehan and Negahban,
2013; Lee et al., 2014), which shows a correlation be-
tween the use of applications belonging to the social
DATA 2019 - 8th International Conference on Data Science, Technology and Applications
60
Table 3: Hardware/software infrastructure.
Client-side
Hardware
Category Smartphones
Manufacturer and/or Samsung, Huawei, Honor, Oppo, Xiaomi,
model Motorola, Vivo, HTC, Meizu, Cubot
CPU da 1.9 GHz Quad Core
a Quad core 2.3 GHz + Quad core 1.7 GHz
RAM 2-4 GB
Storage da 16 GB (only internal storage)
a 128 GB (with micro SD extention)
Software
O.S. Android 6.0 (Marshmallow) +
Database SQLite
Framework Android Volley
Libraries Android MPAndroidChart
Server-side
Hardware
Category Ultrabook
Manufacturer and/or Dell XPS 14
model
CPU Intel i7-3667U Dual-core 2.00 GHz, 2.50 GHz
RAM 8 GB
Storage 500 GB (SSD) + 32 GB (SSD)
Software
O.S. Windows 7 64 bit
Database Neo4j
Framework Apache Spark, Apache Tomcat
Libraries GraphX
category and the smartphone dependence, in our case
there is a high percentage of daily use (both in terms
of frequency and duration) of this category highlight-
ing a potential presence of a smart-phone addiction.
5.4 Smart-Phone Addiction Detection
via Community Detection
The goal of such experiments is to compare the results
proposed community detection algorithm (based on
the combination of SAUL values from different tests
and psychometric variables) in distinguishing smart-
phone addicted (S.A.) users from not smart-phone ad-
dicted (No S.A.) with respect t the outcomes provided
by the MPAC test.
Figure 5 summarizes the obtained results.
The achievement of a lower percentage of S.A.
users compared to that produced only by the MPAC
test follows the results of previous studies (Mon-
tag et al., 2015a; Lin et al., 2015; Boase and Ling,
2013) which showed how the total weekly use of
the smart phone is overestimated by the participants
which are not very reliable in providing an effec-
tive estimate of their interaction with the mobile de-
vice (both in emotional terms through the answers
to the items/questions of the self-assessment test and
in terms of quantitative estimation of the number of
weekly hours used with the device as answer to fur-
ther questions that are integral to those of the test).
We want to note as the users classified as S.A. by
our algorithm have shown, as a result of the RFD anal-
ysis, a clear preference in the use of applications ac-
cording to the ordering: 1) Whatsapp, 2) Facebook
and 3) Youtube.
In addition, a further survey concerning these
users showed that this preference was also found in
the top 10 used apps in terms of the usage frequency
only. In turn, for what concerns only the duration, the
resulting ranking showed how users show a prefer-
ence in the order: 1) Youtube, 2) Whatsapp, 3) Face-
book.
These results confirmed the findings of previ-
ous studies (Montag et al., 2015b; Olivencia-Carri
´
on
et al., 2016) which identify the WhatsApp application
as one of the driving forces behind the use of smart
phones, attributing to its overuse a high potential cor-
relation with smart phone dependency.
Eventually, it should be noted that the majority of
S.A. users belong to the group 18-27, confirming the
trend that sees the phenomenon of smart- phone ad-
diction is growing among the youth population.
6 CONCLUSIONS
In this paper we introduced a novel methodology for
smart-phone addiction classification based on the ap-
plication of community detection algorithms from the
SNA theory.
In particular, we:
A Community Detection Approach for Smart-Phone Addiction Recognition
61
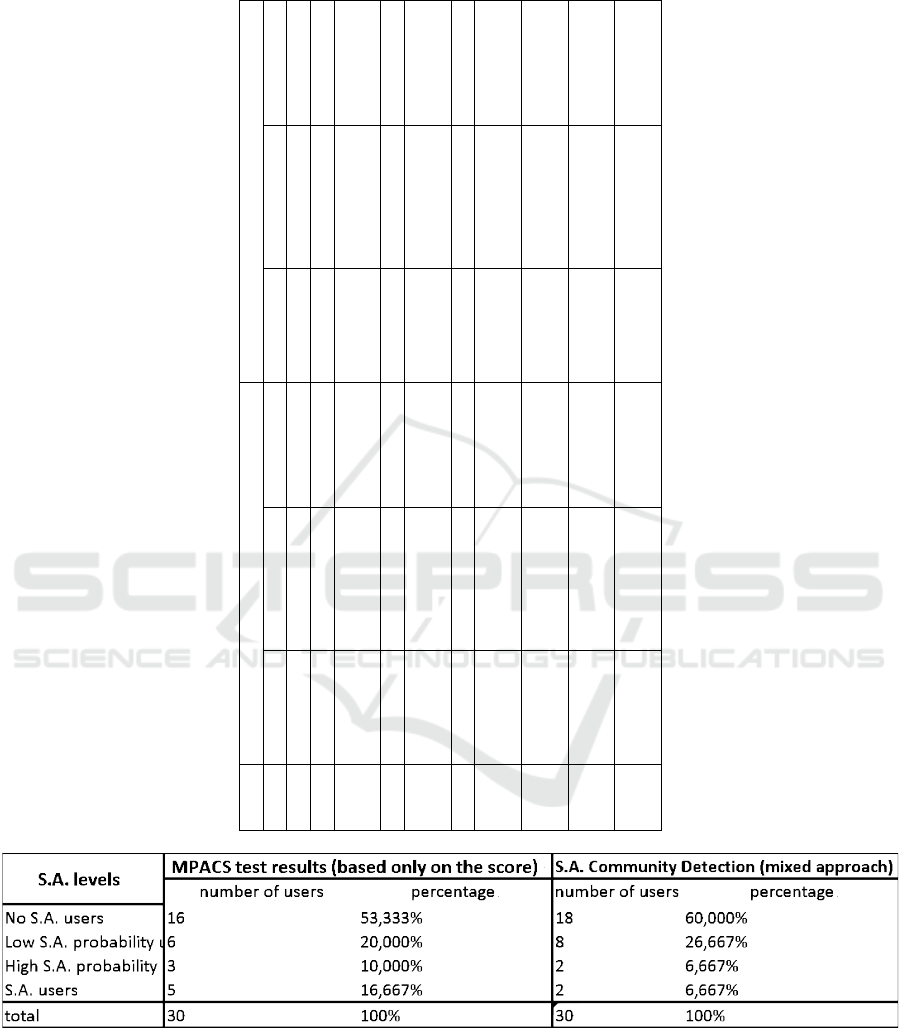
Table 4: Ranking of the top 10 applications based on the duration and frequency of their average daily use.
Rank Sorting by usage duration Sorting by usage frequency
App name Frequency (%) Duration(%) App name Frequency (%) Duration(%)
1 Whatsapp 18.86 17.48 Whatsapp 18.86 17.48
2 YouTube 10.02 8.69 YouTube 10.02 8.69
3
Android
0.28 5.52 Facebook 7.06 4.97
browser
4 Facebook 7.06 4.97 Messenger 5.22 1.19
5
Amazon
0.48 4.48 Instagram 5.07 1.27
shopping
6 Messenger 3.28 4.34 Snapchat 3.45 2.09
7
Amazon
1.03 3.92 AliExpress 3.28 4.34
Kindle
8
Zynga
0.76 3.71 Fifa calcio 3.12 1.48
Poker
9
Google
1.27 3.00
Amazon
3.04 0.37
Maps shopping
10 AliExpress 3.45 2.09
Google
2.89 0.87
Maps
Figure 5: Results of the comparison between the score of the MPACS test and the outcome of the proposed community
detection algorithm.
• modeled data related to users’ behavior with re-
spect to the use of mobile devices as a particular
social graph;
• discovered by means of the SNA algorithms pat-
terns that better characterize users with a high pre-
disposition to smart phone addiction;
• designed and realized a system supporting smart-
phone addiction analysis;
DATA 2019 - 8th International Conference on Data Science, Technology and Applications
62

• performed several experiments on a sample of
users to verify the reliability and effectiveness of
the proposed approach in correctly recognizing
the related addiction degree.
We think that the empirical study reported in this
paper represents an important starting point to illus-
trate the advantages of the inclusion of Social Net-
work Analysis tools and methodologies in the psy-
chological/psychiatric field.
The combination of self-report data and actual be-
havioral monitoring provides a clearer picture of a pa-
tient, as well as a more in-depth view of his potential
dependency status, useful to psychiatric doctors. Fu-
ture work will be devoted to extend experimentation
increasing the number of human subjects and com-
paring our approaches with different and more recent
ones.
ACKNOWLEDGEMENT
This work is part of the Synergy-net: Research and
Digital Solutions against Cancer project (funded in
the framework of the POR Campania FESR 2014-
2020).
REFERENCES
Ben-Yehuda, L., Greenberg, L., and Weinstein, A.
(2016). Internet addiction by using the smartphone-
relationships between internet addiction, frequency of
smartphone use and the state of mind of male and
female students. Journal of Reward Deficiency Syn-
drome & Addiction Science, 2(1):22–27.
Bian, M. and Leung, L. (2015). Linking loneliness, shy-
ness, smartphone addiction symptoms, and patterns of
smartphone use to social capital. Social Science Com-
puter Review, 33(1):61–79.
Boase, J. and Ling, R. (2013). Measuring mobile phone
use: Self-report versus log data. Journal of Computer-
Mediated Communication, 18(4):508–519.
Ch
´
oliz, M., Pinto, L., Phansalkar, S. S., Corr, E., Mujjahid,
A., Flores, C., and Barrientos, P. E. (2016). Devel-
opment of a brief multicultural version of the test of
mobile phone dependence (tmdbrief) questionnaire.
Frontiers in psychology, 7:650.
De-Sola, J., Talledo, H., Rubio, G., and de Fonseca, F. R.
(2017). Development of a mobile phone addiction
craving scale and its validation in a spanish adult pop-
ulation. Frontiers in psychiatry, 8:90.
De-Sola Guti
´
errez, J., Rodr
´
ıguez de Fonseca, F., and Rubio,
G. (2016). Cell-phone addiction: a review. Frontiers
in psychiatry, 7:175.
Gupta, S. and Kumar, P. (2016). Community detection in
heterogenous networks using incremental seed expan-
sion. In Data Science and Engineering (ICDSE), 2016
International Conference on, pages 1–5. IEEE.
Ha, J. H., Chin, B., Park, D.-H., Ryu, S.-H., and Yu, J.
(2008). Characteristics of excessive cellular phone use
in korean adolescents. CyberPsychology & Behavior,
11(6):783–784.
Hooper, V. and Zhou, Y. (2007). Addictive, dependent,
compulsive? a study of mobile phone usage. BLED
2007 Proceedings, page 38.
Lawanont, W. and Inoue, M. (2017). A development of clas-
sification model for smartphone addiction recognition
system based on smartphone usage data. In Interna-
tional Conference on Intelligent Decision Technolo-
gies, pages 3–12. Springer.
Lee, H., Ahn, H., Choi, S., and Choi, W. (2014). The sams:
Smartphone addiction management system and verifi-
cation. Journal of medical systems, 38(1):1.
Lee, S.-J., Rho, M. J., Yook, I. H., Park, S.-H., Jang, K.-S.,
Park, B.-J., Lee, O., Lee, D. K., Kim, D.-J., and Choi,
I. Y. (2016). Design, development and implementation
of a smartphone overdependence management system
for the self-control of smart devices. Applied Sciences,
6(12):440.
Leung, L. (2008). Leisure boredom, sensation seeking, self-
esteem, and addiction. Mediated interpersonal com-
munication, 1:359–381.
Lin, Y.-H., Lin, Y.-C., Lee, Y.-H., Lin, P.-H., Lin, S.-H.,
Chang, L.-R., Tseng, H.-W., Yen, L.-Y., Yang, C. C.,
and Kuo, T. B. (2015). Time distortion associated with
smartphone addiction: Identifying smartphone addic-
tion via a mobile application (app). Journal of psychi-
atric research, 65:139–145.
Markowetz, A., Błaszkiewicz, K., Montag, C., Switala, C.,
and Schlaepfer, T. E. (2014). Psycho-informatics:
big data shaping modern psychometrics. Medical hy-
potheses, 82(4):405–411.
Montag, C., Błaszkiewicz, K., Lachmann, B., Sariyska,
R., Andone, I., Trendafilov, B., and Markowetz, A.
(2015a). Recorded behavior as a valuable resource for
diagnostics in mobile phone addiction: evidence from
psychoinformatics. Behavioral Sciences, 5(4):434–
442.
Montag, C., Błaszkiewicz, K., Sariyska, R., Lachmann,
B., Andone, I., Trendafilov, B., Eibes, M., and
Markowetz, A. (2015b). Smartphone usage in the 21st
century: who is active on whatsapp? BMC research
notes, 8(1):331.
Olivencia-Carri
´
on, M., P
´
erez-Marfil, M., Ramos-Revelles,
M., and L
´
opez-Torrecillas, F. (2016). Personalidad y
su relaci
´
on con el uso versus abuso del tel
´
efono m
´
ovil.
Acci
´
on Psicol
´
ogica, 13(1):109–118.
Salehan, M. and Negahban, A. (2013). Social networking
on smartphones: When mobile phones become ad-
dictive. Computers in Human Behavior, 29(6):2632–
2639.
Samaha, M. and Hawi, N. S. (2016). Relationships among
smartphone addiction, stress, academic performance,
A Community Detection Approach for Smart-Phone Addiction Recognition
63

and satisfaction with life. Computers in Human Be-
havior, 57:321–325.
Sano, A. and Picard, R. W. (2013). Stress recognition us-
ing wearable sensors and mobile phones. In Affective
Computing and Intelligent Interaction (ACII), 2013
Humaine Association Conference on, pages 671–676.
IEEE.
Van Deursen, A. J., Bolle, C. L., Hegner, S. M., and Kom-
mers, P. A. (2015). Modeling habitual and addic-
tive smartphone behavior: The role of smartphone us-
age types, emotional intelligence, social stress, self-
regulation, age, and gender. Computers in human be-
havior, 45:411–420.
DATA 2019 - 8th International Conference on Data Science, Technology and Applications
64
