
Case Study of Anomaly Detection and Quality Control of Energy
Efficiency and Hygrothermal Comfort in Buildings
Carlos Eiras-Franco
1 a
, Miguel Flores
2 b
, Ver
´
onica Bol
´
on-Canedo
1 c
, Sonia Zaragoza
3,4
,
Rub
´
en Fern
´
andez-Casal
5,6 d
, Salvador Naya
6,7 e
and Javier Tarr
´
ıo-Saavedra
6,7 f
1
LIDIA Group, Department of Computer Science, CITIC, Universidade da Coru
˜
na, Campus de Elvi
˜
na, A Coru
˜
na, Spain
2
Department of Mathematics, Escuela Polit
´
ecnica Nacional, Quito, Ecuador
3
PROTERM Group, Department of Naval and Industrial Engineering, Escola Polit
´
ecnica Superior,
Universidade da Coru
˜
na, Mendiz
´
abal s/n, Ferrol, Spain
4
Σqus company, Oleiros, Spain
5
MODES Group, Department of Mathematics, Facultade de Inform
´
atica, Universidade da Coru
˜
na,
Campus de Elvi
˜
na, A Coru
˜
na, Spain
6
Centro de Investigaci
´
on TIC (CITIC), Universidade da Coru
˜
na, Campus de Elvi
˜
na, A Coru
˜
na, Spain
7
MODES Group, Department of Mathematics, Escola Polit
´
ecnica Superior, Universidade da Coru
˜
na,
Mendiz
´
abal s/n, Ferrol, Spain
Keywords:
Statistical Quality Control, Anomaly Detection, Feature Selection, Energy Efficiency, HVAC, Industry 4.0,
LOCI, ReliefF, Functional Data Analysis.
Abstract:
The aim of this work is to propose different statistical and machine learning methodologies for identifying
anomalies and control the quality of energy efficiency and hygrothermal comfort in buildings. Companies
focused on energy sector for buildings are interested on statistical and machine learning tools to automate
the control of energy consumption and ensure quality of Heat Ventilation and Air Conditioning (HVAC) in-
stallations. Consequently, a methodology based on the application of the Local Correlation Integral (LOCI)
anomaly detection technique has been proposed. In addition, the most critical variables for anomaly detec-
tion are identified by using ReliefF method. Once vectors of critical variables are obtained, multivariate and
univariate control charts can be applied to control the quality of HVAC installations (consumption, thermal
comfort). In order to test the proposed methodology, the companies involved in this project have provided
the case study of a store of a clothing brand located in a shopping center in Panama. It is important to note
that this is a controlled case study for which all the anomalies have been previously identified by maintenance
personnel. Moreover, as an alternatively solution, in addition to machine learning and multivariate techniques,
new nonparametric control charts for functional data based on data depth have been proposed and applied to
curves of daily energy consumption in HVAC.
1 INTRODUCTION
The recent advances in the framework of Industry 4.0
allow the companies to monitor the processes that de-
fine products and services (Naya, 2017) continuously
with respect to time. The improvements correspond-
a
https://orcid.org/0000-0001-6322-7593
b
https://orcid.org/0000-0002-7742-1247
c
https://orcid.org/0000-0002-0524-6427
d
https://orcid.org/0000-0002-5785-3739
e
https://orcid.org/0000-0003-4931-9859
f
https://orcid.org/0000-0002-9584-127X
ing to sensoring have lead a high rising in volume and
variety of data, now easily available in a remote way
through web applications. This new paradigm of data
make difficult to control manually the quality of pro-
cesses. Thus, statistical and machine learning tech-
niques that automate the procedures of anomaly de-
tection and quality control of products and services
are increasingly needed (Lee et al., 2014). Specif-
ically, the companies of building energy efficiency
sector have recently developed energy web platforms
that require the implementation of statistical tools to
automate the anomaly detection, the predictive main-
tenance, and the quality control of building installa-
Eiras-Franco, C., Flores, M., Bolón-Canedo, V., Zaragoza, S., Fernández-Casal, R., Naya, S. and Tarrío-Saavedra, J.
Case Study of Anomaly Detection and Quality Control of Energy Efficiency and Hygrothermal Comfort in Buildings.
DOI: 10.5220/0007839701450151
In Proceedings of the 8th International Conference on Data Science, Technology and Applications (DATA 2019), pages 145-151
ISBN: 978-989-758-377-3
Copyright
c
2019 by SCITEPRESS – Science and Technology Publications, Lda. All rights reserved
145
tions (Barbeito et al., 2017; Flores et al., 2018). That
is the case of web platform developed by Σqus com-
pany, that provides the real case study described in
this work. It consist on the energy deficiency con-
trol of the Heating, Ventilation and Air Condition-
ing (HVAC) installation of a clothing store placed in
Panama City, from the data provided by Σqus web
platform.
The statistical models used to detect anomalies
could be classified in two main groups. On one hand,
those based on the application of supervised classi-
fication techniques (Francisco-Fern
´
andez et al., 2012;
Mallik et al., 2011; Bolon-Canedo et al., 2011; Bolon-
Canedo et al., 2017) and, on the other hand, the con-
trol charts, in the framework of statistical quality con-
trol (Barbeito et al., 2017). Control charts, either for
scalar or multivariate cases, have been profusely used
in all the sectors of industry (Montgomery, 2007).
Broadly speaking, control charts estimate the range
of normal performance of a process, i.e. they pro-
vide information about the studied process is in con-
trol. If the process is not under control, this could be
related with the presence of an anomaly in the pro-
cess. When using control charts, training a model
considering of all the types of anomalies is not nec-
essary. This is an advantage with respect to ma-
chine learning methods based on supervised classifi-
cation. This goal can be extrapolated to those cases
in which the quality of a process is defined by the
relation between two variables by using the profile
control charts. These charts are used when the pro-
cess is defined by curves depending on time or fre-
quency, among others continuous variables (Woodall,
2007), in fact they can be studied from the Func-
tional Data Analysis (FDA) approach, a branch of
statistics that includes all those techniques that can
be applied when data are curves (infinite dimension
data) (Ferraty and Vieu, 2006; Francisco-Fern
´
andez
et al., 2012). In this work, a FDA methodology based
on functional data depth (L
´
opez-Pintado and Romo,
2009) combined with nonparametric control charts
based on ranks (Liu, 1995) is proposed.
This study is organized as follows. The Section
2 describes the energy efficiency case study, and its
corresponding dataset composed of critical to qual-
ity variables for building energy efficiency. In Sec-
tion 3, the machine learning techniques applied to de-
tect anomalies and to extract the relevant features that
help to identify them are briefly introduced. Section
4 accounts for the FDA control chart approach intro-
duction and description. The results obtained from
the application of the statistical and machine learning
methodologies are presented in Section 5, whereas the
Section 6 includes the final remarks.
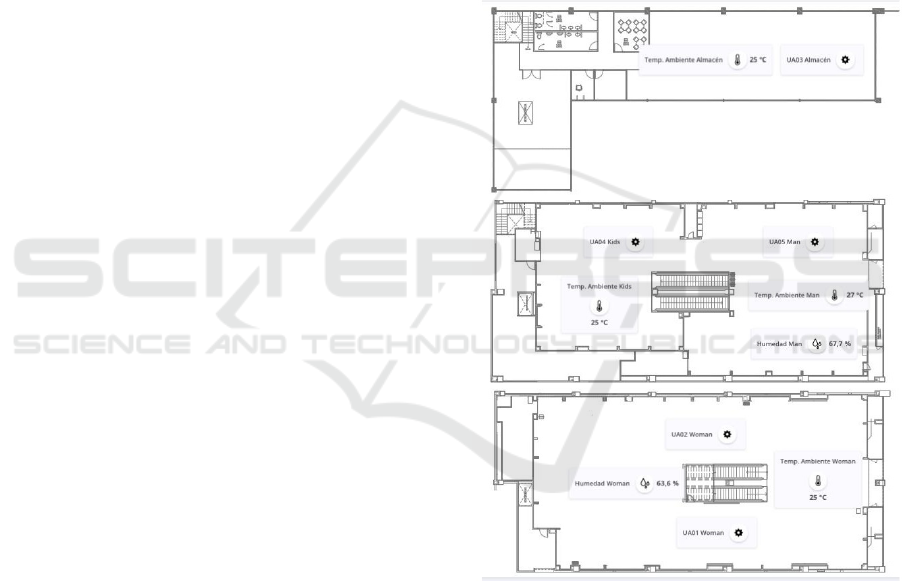
2 CASE STUDY: DETECTION OF
ANOMALIES DEALING WITH
THE ENERGY EFFICIENCY OF
HVAC INSTALLATIONS
A clothing store located in a commercial center of
Panama City is studied by continuously monitoring
using the Σqus web platform. Overall 16 critical to
quality variables are measured, including indoor tem-
peratures, energy consumption, energy consumption
in HVAC, relative humidity, CO
2
amount, and tem-
peratures of impulsion and return corresponding to
the chillers of the different areas of the store (see Fig-
ure 1).
Figure 1: Plan of the study case store placed in Panama
City.
Hourly measurements are obtained from August 1
2017 to October 31 2018. The HVAC installation of
the store begins to run at 9:00 or 10:00 in the morning.
At start-up, a peak in the energy consumption occurs
due to the characteristics of the HVAC installation.
From 12:00, consumption remains relatively constant
until 20:00, 21:00 pm or 22:00 pm, when the store
closes. The shut-down takes about 1 or 2 hours, with
consumption falling at a constant rate of change. The
resulting data can be considered functional data and
thus FDA techniques can be applied. It is also impor-
DATA 2019 - 8th International Conference on Data Science, Technology and Applications
146

tant to note that this case study is a controlled study in
which the anomalies and their assignable causes have
been previously detected for the maintenance staff.
In the following lines, some of the anomalies iden-
tified by the maintenance staff are described. Thus,
on September 11 there was a decrease in air condi-
tioning consumption towards the middle of the day.
On September 21, 22 and 30 the shopping center was
closed, so there was no consumption and tempera-
tures were high. On September 27, maintenance tests
were carried out at the store facilities. On September
29, the store HVAC installation was stopped one hour
earlier than usual. As of September 19, the air condi-
tioning is turned off half an hour before, that is, there
is a regulation change in the HVAC system. At the
middle of October, there is a leak in the air condition-
ing circuit. From that moment, energy consumption
began to rise. Moreover, on November 1, repairing
activities were made. Consequently, the consumption
decreased and, in addition, the star-up consumption
peak was prevented. Between November 17 and 20
the consumption returned to increase. Apart from the
anomalies above mentioned, many others have been
detected and used to train and evaluate the proposed
models.
3 STATISTICAL AND MACHINE
LEARNING METHODOLOGIES
3.1 Machine Learning Methodology
The case study data are vectors composed of 18 vari-
ables (16 variables in addition to the date and time)
that correspond to the measurements made by 14 sen-
sors and 2 meters every 5 minutes. We have trans-
formed these measurements into daily vectors in or-
der to perform the analysis of anomalies at the level
of full days. For this purpose, the 288 measurements
of each day have been grouped into 24 measurements
that correspond to the hourly measurements of the
measurements vector. These hourly mean vectors
have been concatenated chronologically giving a vec-
tor composed of 24 × 16 = 384 variables per day. On
the set formed by those daily vectors, from which the
vectors identified as anomalies by the user have been
eliminated, the LOCI anomaly detection method has
been applied (Papadimitriou et al., 2003) using Mat-
lab software to obtain a normality model that evalu-
ates the complete set in order to obtain a score that
accounts for the degree in which each vector can be
identified as an anomaly. Consequently, a threshold
on this score has been defined that allows us to ob-
tain a classifier that identifies the anomalies against
the normal vectors. With this information we can
obtain a tagged dataset that has the same number of
positive examples (anomalies) as negative ones (nor-
mal vectors). Afterward, the ReliefF feature selection
method (Kira and Rendell, 1992) can be applied (us-
ing Weka software) to obtain an ordering of the vari-
ables according to their ability to predict the output
class, in this case the presence of an anomaly. That
sorted list will be used to select only the most relevant
variables and discard the remaining. This is an impor-
tant contribution taking into account the increasingly
high dimension of modern datasets in building energy
efficiency.
3.2 Control Charts for Functional Data
A methodology to build process control charts for
functional data is proposed. The control consists of
two phases: Phase I of process calibration and Phase
II of process monitoring.
1. PHASE I: A control chart for functional
data based on functional data depth and
rank control charts is developed. With
{X
1
(t),X
2
(t),...,X
n
(t)}, observations of a
functional variable X , this hypothesis is tested:
H
0
: X
i
(t)
d
= X
j
(t),∀i, j ∈ {1, . . . , n},, with respect
to H
a
: X
i
(t)
d
6= X
j
(t), for some i, j ∈ {1,...,n}
• An iterative method to detect and discard atypical
curves in order to obtain a process sample under
control is performed.
• The depth of each curve is calculated with respect
to D(X
i
)
n
i=1
using functional data depth measures
such as Fraiman, mode and random projections.
• The lower control limit (LCL) of rank chart is
chosen by a bootstrap procedure based on trim-
ming:
– Reorder the curves according to their depths in
a decreasing way. X
(1)
,...,X
(N)
.
– It is assumed that at most α % of the sample
can be considered atypical data.
– B samples X
∗b
i
,i = 1, . . . , N, b = 1,...,B are ob-
tained by a smoothed bootstrap:
∗ A uniform sampling is done, i
∗
of
1,...,[N(1 − α)].
∗ Z
i∗
is generated as a Gaussian process with
zero mean and variance-covariance matrix
δΣ
X
with δ ∈ [0, 1]. Where Σ
X
is the vari-
ance and covariance matrix of observations
X
(1)
,...,X
([N(1−α)])
.
∗ Finally, X
∗b
i
= X
(i∗)
+ Z
i∗
is obtained
Case Study of Anomaly Detection and Quality Control of Energy Efficiency and Hygrothermal Comfort in Buildings
147

– For each b = 1,. . . , B, we obtain C
b
, the 1%
quantile of depth distribution, D(X
∗b
i
). The fi-
nal value C = LCL is the median of C
b
.
• Curves that verify D(X
i
) ≤ LCL are outliers and
thus process is out of control. They have to be dis-
carded. A chart that includes the original curves
and the functional envelope obtained from 99% of
the deeper bootstrap replicas is also performed.
2. PHASE II: Another control chart based on rank
control charts and functional depth is proposed to
monitor the process.
• We want to monitor the sample
{X
n+1
(t),X
n+2
(t),...,X
m
(t)} from G distri-
bution, taking into account the calibrating sample
obtained in Phase I {X
1
(t),X
2
(t),...,X
n
(t)},
belonging to F distribution. The H
0
: F = G
versus H
1
: F 6= G is tested.
• From {X
1
(t),X
2
(t),...,X
n
(t)}, the depths for cal-
ibration sample D(X
i
)
n
i=1
, and for monitored sam-
ple, D(X
j
)
m
j=n+1
, are obtained.
• The rank statistic for monitored sample are es-
timated by r
G
(X
n+1
),...,r
G
(X
m
), using as refer-
ence sample {X
1
(t),X
2
(t),...,X
n
(t)}: r
G
(X ) =
#{X
i
|D(X
i
)≤D(X ),i=1,...,n}
n
• The rank statistic, the center line CL=0.5, and the
LCLα are plotted in a control chart. The pro-
cess is monitored. IF r
G
(X
j
) ≤ LCI for some j,
the process is out of control. Functional control
chart is developed, including original curves and
the functional envelop of the 99% deeper curves
of calibrating sample.
4 RESULTS
4.1 Machine Learning Approach for
Anomaly Detection and Features
Selection
The calendar image is updated to reflect the anomaly
score predicted by the LOCI method (Figure 2). The
bar that appears in the background of each panel rep-
resents that score. The bar is ochre if it exceeds the
first threshold (pre-alarm threshold) and red if it ex-
ceeds the second threshold (alarm threshold). The
days labeled as anomalies by the maintenance per-
sonal have been removed from the training set. Then,
the estimated model has been used to classify be-
tween normal system performance and anomaly using
the complete set. The two used thresholds are those
defined by a score equal to 1.5 (which identifies as
Table 1: Variables orderer taking into account their relation-
ship with respecto to the identification of an anomaly.
Score Variable
0.045694452 Indoor temperature (CL02, sale area)
0.041626373 Temperature for general entrance of water
0.041031993 Supply-temperature (CL02, sale area)
0.040609546 Water return temperature (CL02, sale area)
0.036097602 Water return temperature (CL01, sale area)
0.035123600 Supply-temperature (CL01, sale area)
0.034024427 Indoor temperature (CL01, sale area)
0.031257874 Energy consumption of HVAC (KW)
0.03001870 Relative humidity (Sales)
0.023807473 Water return temperature (CL03, store)
0.022419010 Supply-temperature (CL03, store)
0.022344179 Indoor temperature (CL03, store)
0.020897972 Overall energy consumption (KW)
anomalies approximately 1 in 4 days) and by a score
of 2.5 (which marks as anomaly approximately 1 in
10 days). It is important to note that the Figure 2 only
shows the variable of total energy consumption for an
illustrative purpose.
The ReliefF method application provides an or-
dered list of variables according to their importance
to identify anomalies from normal performance (tak-
ing into account the chosen anomaly level, 1.5 or
2.5). The more influencing variables are those re-
lated to the supply and return temperature of HVAC,
and even the water temperature of general HVAC sys-
tem, than energy consumption and indoor tempera-
tures. In addition, those variables corresponding to af-
ternoon and evening are more related with the anoma-
lies than those corresponding to the morning. The
assignable cause is that the maximum occupation oc-
curs from 13:00. Therefore, monitoring these fea-
tures is strongly recommended. Moreover, an aver-
age of the weights (importance) of each sensor-meter
throughout the day has been performed (see Table 1).
Moreover, once the score variable is obtained,
control charts for scalar variables can be applied. A
Tukey transformation is previously applied in order
to the scores are Gaussian distributed (Tukey, 1977).
Figure 3 shows the application of control charts for in-
dividual observations (Montgomery, 2007). The nat-
ural control limits are estimated using a retrospective
sample from August to October 2017. The anoma-
lies corresponding to August, September and October
have been identified and removed from the retrospec-
tive dataset through an iterative process. Then, the
sample corresponding to November has been moni-
tored (compared with respect to the previous calcu-
lated natural control limits). We can observe that the
process lead out of control at the beginning of Novem-
ber: points (each one corresponding to a different
day) fall out of control limits. This is an indicative
DATA 2019 - 8th International Conference on Data Science, Technology and Applications
148
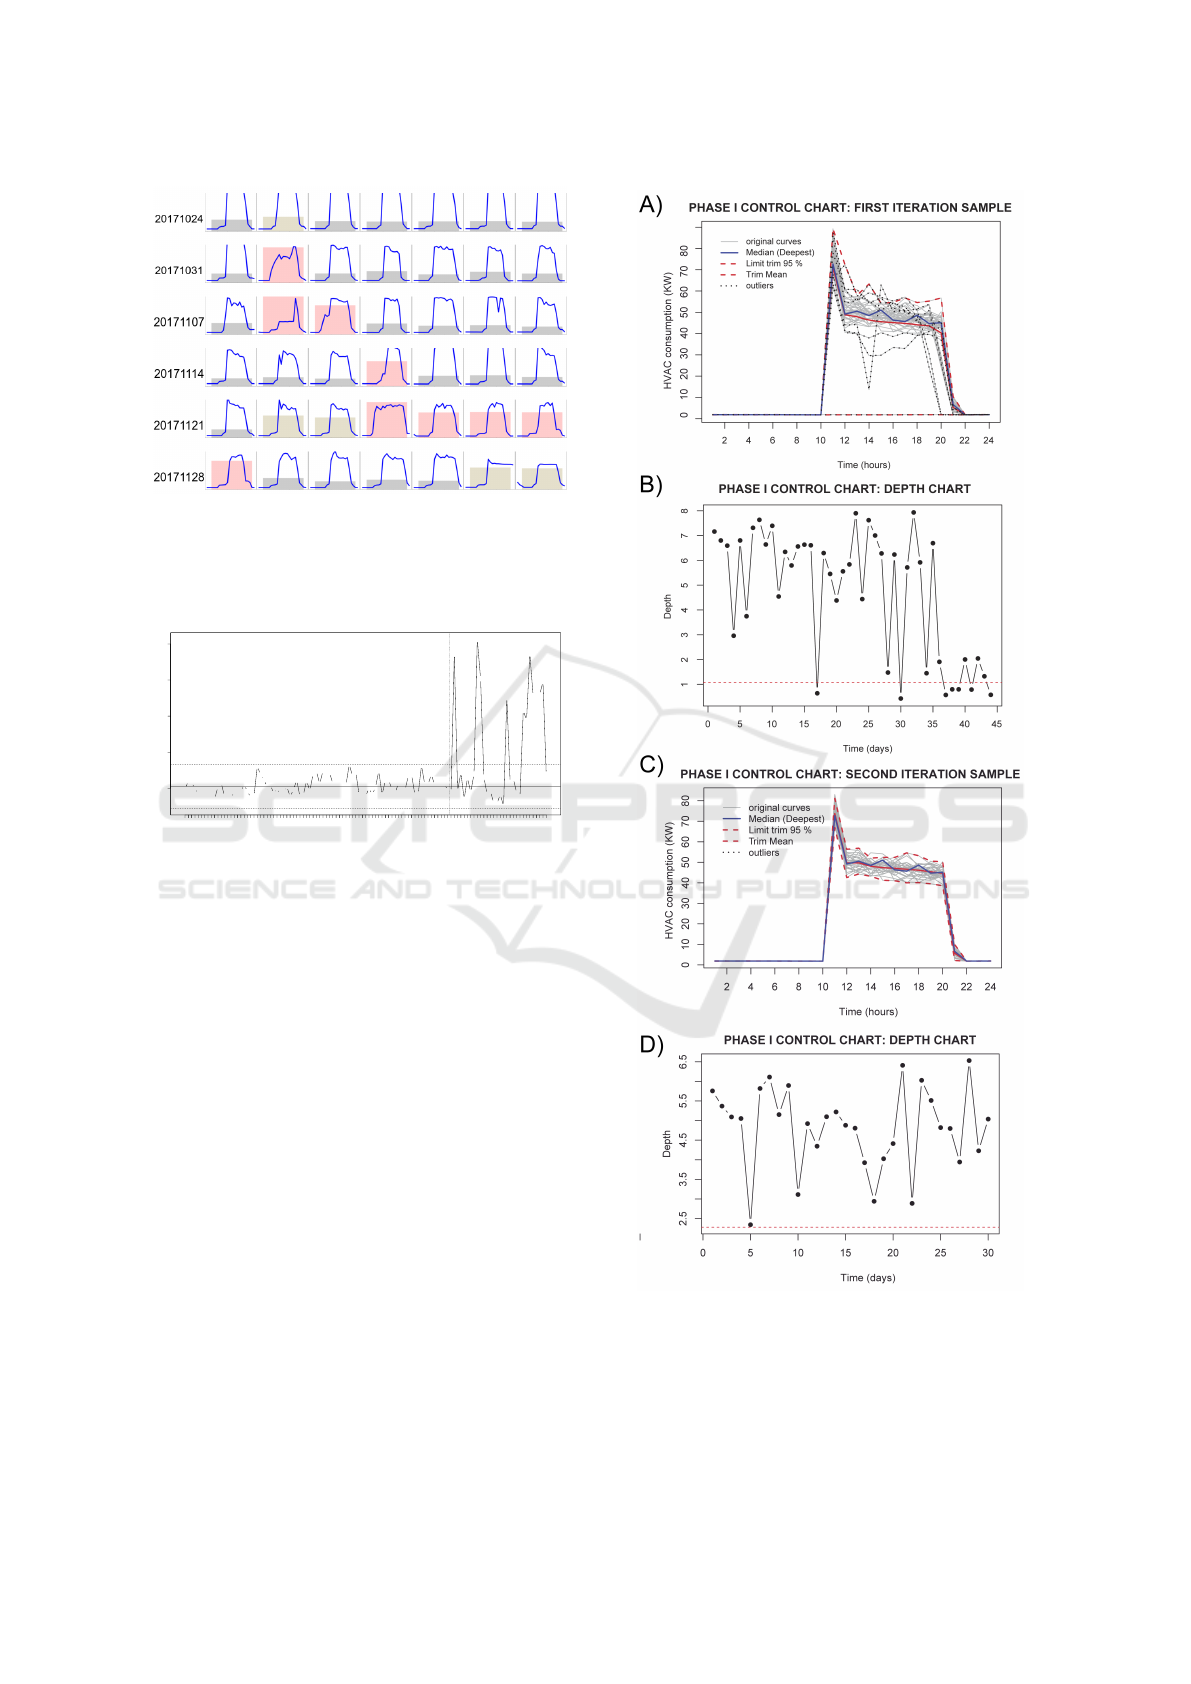
Figure 2: Calendar that shows each day symbolized by its
daily energy consumption curve. The height and color of
the background bar indicate how plausible the the detection
of an anomaly is (ochre color means pre-alarm and red ac-
counts for an alarm).
Group
Transformed scores
1 3 5 7 9 12 15 18 21 24 27 30 33 36 39 42 45 48 51 54 57 60 63 66 69 72 75 78 81 84 87 90 93 96 99 103 107 111
1.0 1.2 1.4 1.6 1.8
●
●
●
●
●
●
●
●
●
●
●
●
●
●
●
●
●
●
●
●
●
●
●
●
●
●
●
●
●
●
●
●
●
●
●
●
●
●
●
●
●
●
●
●
●
●
●
●
●
●
●
●
●
●
●
●
●
●
●
●
●
●
●
●
●
●
●
●
●
●
●
●
●
●
●
●
●
●
●
●
●
●
●
●
●
●
●
●
●
●
●
●
●
●
●
●
●
●
●
●
●
●
●
●
●
●
●
●
●
●
●
LCL
UCL
CL
●
●
●
●
●
●
●
●
●
●
●
●
●
●
●
●
●
●
Calibration data New data
Number of groups = 111
Center = 1.010281
StdDev = 0.0368899
LCL = 0.8888943
UCL = 1.131669
Number beyond limits = 12
Number violating runs = 6
Figure 3: Control chart for individual measurements ap-
plied to the score variable obtained by LOCI method. The
control limits are obtained using the calibration or retro-
spective sample.
of something in the installation has changed. The
assignable cause is that HVAC installation had been
repaired as pointed out in Section 2.
4.2 Application of FDA Approach for
Control Charts
Phase I control chart for functional data is applied to a
retrospective sample of daily HVAC energy consump-
tion that involves the measurements obtained between
August and September (Figure 4). All the previously
mentioned anomalies (see Section 2) have been de-
tected by the application of functional depth chart dur-
ing an iterative process. The real curves represen-
tation helps to identify the assignable cause of each
anomaly. Namely, the absence of energy consumption
peak due to improvements during November 2017,
changes in opening and closing timetable, and fail-
ures in sensors and HVAC installations, among other
assignable causes.
Figure 4: Panel A: Phase I FDA control chart where the
first iteration of outlier detection is implemented. Panel B:
The corresponding control chart based on FDA data depth
(Fraiman and Muniz depth). Panel C: Phase I FDA con-
trol chart once the outlier detection is implemented (sample
under control). Panel D: Control chart based on FDA data
depth once the sample is under control.
Case Study of Anomaly Detection and Quality Control of Energy Efficiency and Hygrothermal Comfort in Buildings
149
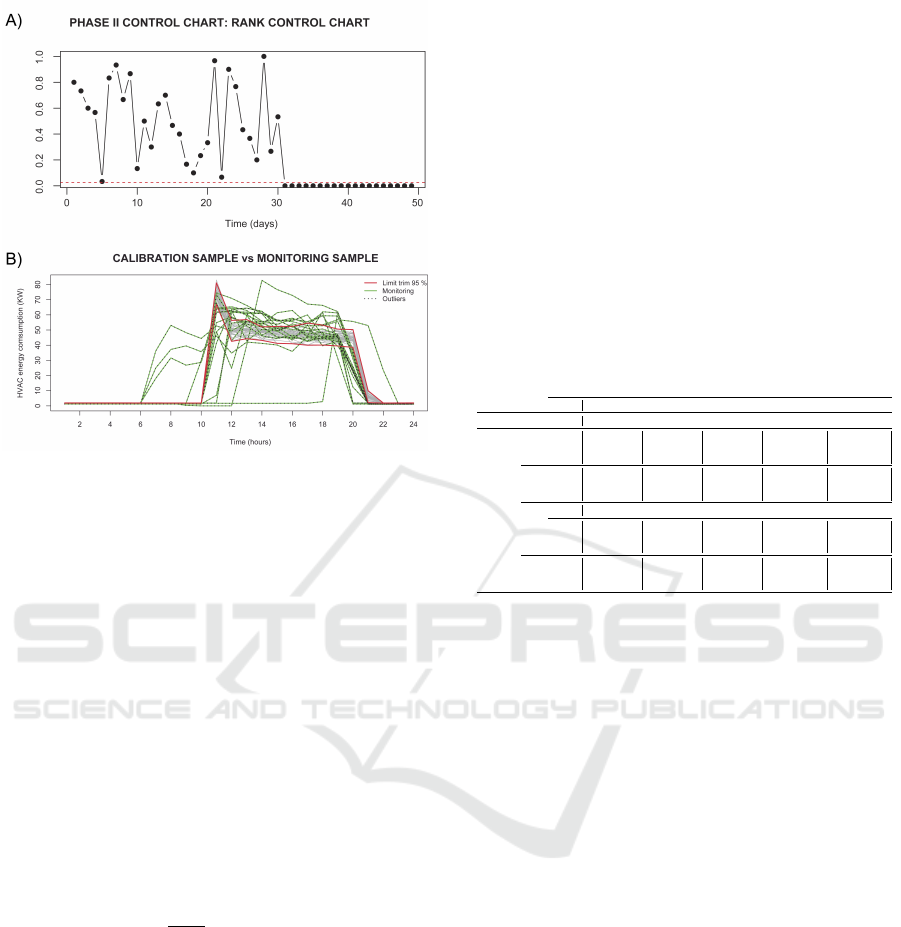
Figure 5: Panel A: Phase II ontrol chart based on FDA
data depth (Fraiman and Muniz depth). Panel B: The corre-
sponding Phase II FDA control chart where curves of both
calibration and monitoring sample are ploted.
Once the reference sample is obtained, a Phase
II control chart based on a nonparametric rank chart
with functional depth is applied (Figure 5). The
consumption curves corresponding to November are
monitored and detected as anomalies when compared
with the reference sample.
In order to evaluate the performance of the pro-
posed FDA control chart, a simulation study has been
performed. Following other previous works dealing
with outlier detection (Febrero et al., 2008), sim-
ulated curves have been generated as follows, as-
suming a Gaussian process, X (t) = µ(t) + σ(t) · ε(t),
where σ
2
(t) = 0.5 and µ(t) = E(X (t)) = 30t(1 −
t)
3/2
. Moreover ε(t) is a Gaussian process ε(t) ∼
GP(0,Σ) with mean 0 and variance covariance matrix
E[ε(t
i
) × ε(t
j
)] = e
−
|
t
i
−t
j
|
0.3
.
In order to generate scenarios of atypical curves
(varying in mean an shape), the following means are
considered taking into account other previous work
(Febrero et al., 2008).
• Magnitude change (M1): µ(t) = 30t(1 −t)
3/2
+δ,
with δ control the change of magnitude at levels
between 0.4 and 2.
• Shape change (M2): µ(t) = (1 − η) · 30t(1 −
t)
3/2
+ η · 30t
3/2
(1 − t), with η the shape change
level, between 0.2 and 1.
Dependent curves are generated by the model
˜
Y
i
(t) = µ(t) + σ(t) ·
˜
ε(t), con
˜
ε(t) = ρ ·
˜
ε
i−1
(t) + (1 −
ρ) · ε
i
(t). Whereas ρ is the measure of correlation be-
tween curves, σ(t) = 0.5, and ε(t) and
˜
ε(t) are Gaus-
sian processes.
Table 2 shows the ˆp
c
(proportion of curves cor-
rectly detected as anomalies,%) and ˆp
f
(proportion
of false alarms, %) for M
1
and M
2
cases under
the assumption of dependence between curves (ρ =
0.9), obtained from B = 1000 resamples, with α =
0.01. Fraiman and Muniz (FM), Random projections
(RM) and Mode data depth types have been applied
(Febrero-Bande et al., 2012). The results supports the
application to real study cases.
Table 2: ˆp
c
(proportion of curves correctly detected as
anomalies,%) and ˆp
f
(proportion of false alarms, %) for M
1
and M
2
cases under the assumption of dependence between
curves (ρ = 0.9), obtained from B = 1000 resamples, with
α = 0.01.
δ 0.4 0.8 1.2 1.6 2
Scenario Size Depth ˆp
f
ˆp
c
ˆp
f
ˆp
c
ˆp
f
ˆp
c
ˆp
f
ˆp
c
ˆp
f
ˆp
c
M
1
50 FM 0.45 24.60 0.09 52.30 0.00 42.10 0.00 25.90 0.00 15.40
RP 0.93 29.70 0.35 60.00 0.07 66.90 0.01 67.30 0.00 65.00
Mode 0.20 45.80 0.02 85.30 0.00 94.30 0.00 90.50 0.00 86.30
100 FM 1.04 31.60 0.77 83.60 0.66 98.90 0.56 100.00 0.46 100.00
RP 1.64 32.50 1.57 82.30 1.51 97.90 1.36 99.90 1.26 100.00
Mode 0.79 43.10 0.70 91.90 0.63 99.50 0.57 100.00 0.49 100.00
η 0.2 0.4 0.6 0.8 1
M2 50 FM 0.67 5.95 0.39 16.30 0.19 22.35 0.09 21.05 0.06 20.05
RP 1.24 6.95 0.95 16.75 0.59 24.95 0.36 30.25 0.24 33.35
Mode 0.21 39.90 0.04 83.80 0.00 94.90 0.00 94.70 0.00 90.90
100 FM 1.17 5.75 0.97 23.20 0.88 40.00 0.88 46.10 0.92 48.30
RP 1.69 6.05 1.65 19.25 1.65 33.90 1.75 43.40 1.82 46.65
Mode 0.81 38.40 0.77 87.90 0.73 99.80 0.72 100.00 0.69 100.00
5 CONCLUSIONS
Companies of energy sector need statistical and ma-
chine learning tools that allow us to automate the
anomaly detection and quality control of energy ef-
ficiency in buildings (commercial centers, hospitals,
hotels, offices, stores, among others). The real case
study of a clothing shop in a mall of Panama City has
been provided, for which all the anomalies have been
identified by the maintenance staff during a period of
one year. Two approaches for anomaly detection and
quality control of energy efficiency installations in
buildings have been proposed and applied to this case
study in order to automate the process. A machine
learning methodology for anomaly detection based on
the application of LOCI method has been applied. It
allows us to define two different levels of anomaly
or alarm (pre-alarm and alarm) from the calculation
of scores that accounts for relation of each day with
respec to the presence of an anomaly. Taking into ac-
count these levels, the anomalies previously indicated
by the maintenance staff have been successfully iden-
tified. In addition, the ReliefF method has been also
applied to select which variables are more related with
the presence of anomalies. The more critical variables
for the quality of the energy efficiency system are
the temperatures corresponding to the HVAC installa-
DATA 2019 - 8th International Conference on Data Science, Technology and Applications
150

tion (chiller supply and return temperatures and water
temperature). Consequently, the anomaly detection
procedure could be applied to these variables, mak-
ing this process more simple and efficient in terms
of time and computation requirements. Alternatively,
when we are interested on controlling just one vari-
able and this is characterized by a functional nature,
a FDA methodology for control charts has been pro-
posed and applied to the HVAC energy consumption
daily curves. Confidence bands have been estimated
in the calibration stage, allowing us to monitor the
consumption curves of new days and decide if they
correspond to anomalies in the system. This statistical
approach is based on functional data depth calculation
and the application of rank control charts.
ACKNOWLEDGEMENTS
This research/work of Salvador Naya, Javier Tarr
´
ıo-
Saavedra and Rub
´
en Fern
´
andez-Casal have been sup-
ported by MINECO grants MTM2014-52876-R and
MTM2017-82724-R, and by the Xunta de Galicia
(Grupos de Referencia Competitiva ED431C-2016-
015 and Centro Singular de Investigaci
´
on de Galicia
ED431G/01 2016-19), all of them through the ERDF.
The work of Carlos Erias, Ver
´
onica Bol
´
on and Javier
Tarr
´
ıo has been also developed in the framework of
eCOAR project (PC18/03) of CITIC. The research of
Miguel Flores has been partially supported by Grant
PII-DM-002-2016 of Escuela Polit
´
ecnica Nacional of
Ecuador.
REFERENCES
Barbeito, I., Zaragoza, S., Tarr
´
ıo-Saavedra, J., and Naya,
S. (2017). Assessing thermal comfort and energy ef-
ficiency in buildings by statistical quality control for
autocorrelated data. Applied energy, 190:1–17.
Bolon-Canedo, V., Sanchez-Maro no, N., and Alonso-
Betanzos, A. (2017). Artificial Intelligence: Founda-
tions, Theory, and Algorithms Feature Selection for
High-Dimensional Data. Springer.
Bolon-Canedo, V., Sanchez-Marono, N., and Alonso-
Betanzos, A. (2011). Feature selection and classifi-
cation in multiple class datasets: An application to
kdd cup 99 dataset. Expert Systems with Applications,
38(5):5947–5957.
Febrero, M., Galeano, P., and Gonz
´
alez-Manteiga, W.
(2008). Outlier detection in functional data by depth
measures, with application to identify abnormal nox
levels. Environmetrics: The official journal of the In-
ternational Environmetrics Society, 19(4):331–345.
Febrero-Bande, M., de la Fuente, M. O., et al. (2012). Sta-
tistical computing in functional data analysis: The
r package fda. usc. Journal of statistical Software,
51(4):1–28.
Ferraty, F. and Vieu, P. (2006). Nonparametric functional
data analysis: theory and practice. Springer Science
& Business Media.
Flores, M., Tarr
´
ıo-Saavedra, J., Fern
´
andez-Casal, R., and
Naya, S. (2018). Functional extensions of mandel’s
h and k statistics for outlier detection in interlabora-
tory studies. Chemometrics and Intelligent Labora-
tory Systems, 176:134–148.
Francisco-Fern
´
andez, M., Tarr
´
ıo-Saavedra, J., Mallik, A.,
and Naya, S. (2012). A comprehensive classifica-
tion of wood from thermogravimetric curves. Chemo-
metrics and Intelligent Laboratory Systems, 118:159–
172.
Kira, K. and Rendell, L. A. (1992). A practical approach to
feature selection. In Machine Learning Proceedings
1992, pages 249–256. Elsevier.
Lee, J., Kao, H.-A., and Yang, S. (2014). Service innova-
tion and smart analytics for industry 4.0 and big data
environment. Procedia Cirp, 16:3–8.
Liu, R. Y. (1995). Control charts for multivariate pro-
cesses. Journal of the American Statistical Associa-
tion, 90(432):1380–1387.
L
´
opez-Pintado, S. and Romo, J. (2009). On the concept
of depth for functional data. Journal of the American
Statistical Association, 104(486):718–734.
Mallik, A., Tarr
´
ıo-Saavedra, J., Francisco-Fern
´
andez, M.,
and Naya, S. (2011). Classification of wood micro-
graphs by image segmentation. Chemometrics and in-
telligent laboratory systems, 107(2):351–362.
Montgomery, D. C. (2007). Introduction to statistical qual-
ity control. John Wiley & Sons.
Naya, S. (2017). Industry 4.0. an opportunity for the re-
lationship between university and shipbuilding in the
future. In Pan-American Conference of Naval Engi-
neering, pages 169–177. Springer.
Papadimitriou, S., Kitagawa, H., Gibbons, P. B., and Falout-
sos, C. (2003). Loci: Fast outlier detection using the
local correlation integral. In Proceedings 19th Inter-
national Conference on Data Engineering (Cat. No.
03CH37405), pages 315–326. IEEE.
Tukey, J. W. (1977). Exploratory data analysis.
Woodall, W. H. (2007). Current research on profile moni-
toring. Production, 17(3):420–425.
Case Study of Anomaly Detection and Quality Control of Energy Efficiency and Hygrothermal Comfort in Buildings
151
