
Strong Internal Tides in the Strait of Gibraltar:
Measurements and Modelling
E. G. Morozov
1 a
and M. G. Velarde
2
1
Shirshov Institute of Oceanology, Russian Academy of Sciences, 36 Nakhimovsky prospekt, Moscow, Russia
2
Instituto Pluridisciplinar, 1 Paseo Juan XXIII, Madrid, Spain
Keywords: Strait of Gibraltar, Internal Waves, Numerical Modeling.
Abstract: We analyze moored current measurements in the Strait of Gibraltar. Internal waves are extremely strong in
the strait. The vertical displacements of water particles with a semidiurnal frequency sometimes exceed 200
m. These displacements are associated with forced tidal internal waves over the Camarinal Sill, which
crosses the strait. The amplitudes of the waves decrease with the distance from the sill, and at a distance of
50 km from the sill, the amplitudes are three times smaller than over the sill. Numerical modelling shows
that the lower current in the strait directed from the Mediterranean Sea to the ocean has a significant
influence on internal tides. The effect of internal waves propagating in a hydraulic flow leads to the
formation of internal bore, followed by a wave packet of shorter internal waves.
a
https://orcid.org/0000-0002-0251-3454
1 INTRODUCTION
The Strait of Gibraltar (Fig. 1) has been known from
the ancient ages. It is characterized by a two-layer
system of opposite flows resulting from the
difference in water density between the Atlantic
Ocean and the Mediterranean Sea. A strong surface
current of relatively fresher water from the ocean
compensates for intensive evaporation in the
Mediterranean. A deep-water current of more saline
Mediterranean water flows into the ocean. A
barotropic tidal wave is imposed on this system with
velocities in the range 70-80 cm/s, about the same
order of magnitude as the mean velocities of the
currents between the ocean and the sea, and thus, an
unsteady flow is formed. The tide generates a strong
tidal internal wave, when the tidal currents flow over
uneven topography in the strait.
The estimate for the Mediterranean water
outflow is equal to -0.68 Sv (1 Sv = 10
6
m
3
/s), while
the flow of Atlantic waters is 0.72 Sv, which equals
to the sum of the outflow and net evaporation that is
approximately 52 cm of the sea level per year
(Bryden et al., 1994; Morozov et al., 2002, 2003).
Figure 1: Chart of the Strait of Gibraltar and locations of
moorings (black dots).
2 MOORED MEASUREMENTS
Moored measurements in the strait reveal very
strong internal waves whose double amplitude
(vertical displacements of particles) can be as high
as 200 m over a depth of 400 m. The displacement
of 13C isotherm gives the best illustration of such a
displacement. The vertical displacement ranges from
100 to 300 m (Fig. 2).
To estimate the wavelength of the semidiurnal
waves we used the antenna method developed in
354
Morozov, E. and Velarde, M.
Strong Internal Tides in the Strait of Gibraltar: Measurements and Modelling.
DOI: 10.5220/0007840603540357
In Proceedings of the 5th International Conference on Geographical Information Systems Theory, Applications and Management (GISTAM 2019), pages 354-357
ISBN: 978-989-758-371-1
Copyright
c
2019 by SCITEPRESS – Science and Technology Publications, Lda. All rights reserved
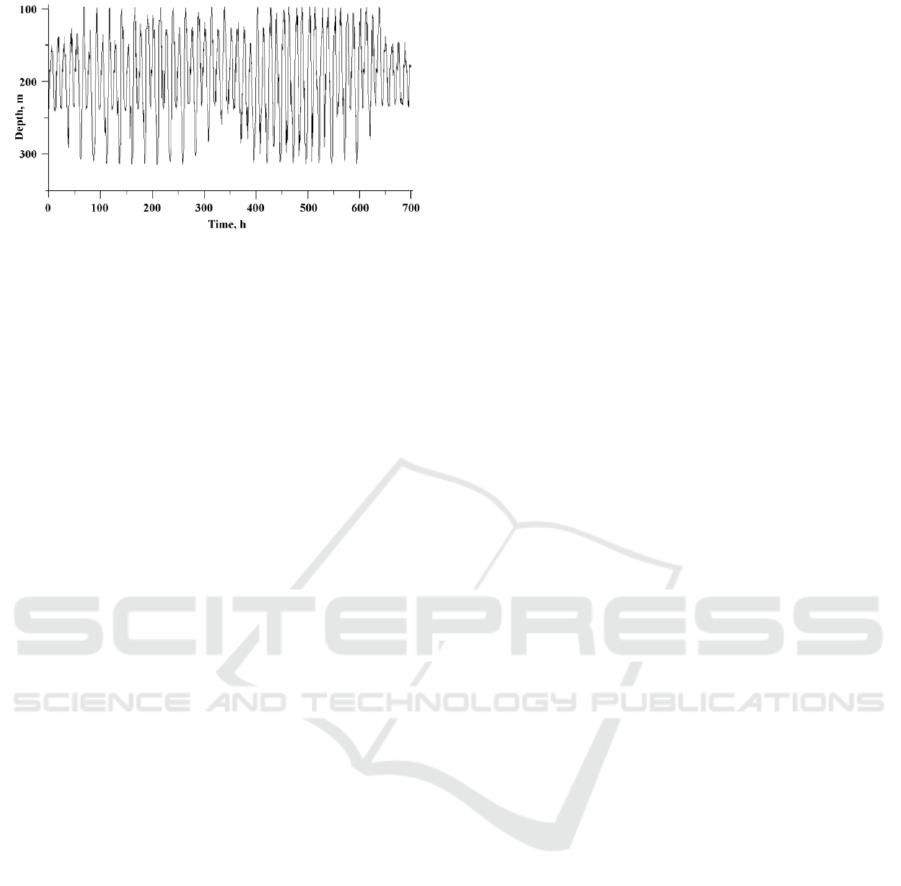
Figure 2: Depth variation of 13C isotherm from July 2 to
July 31, 1986.
seismology and applied for oceanic waves by Barber
(1963) assuming arbitrary position of the wave
sensors. The method is based on the calculation of
the cross spectra for each pair of the possible
combinations of sensors with further convolution at
the semidiurnal frequency of the waves. The
amplitude and phase cross-characteristics of the
oscillation are used to calculate the spatiotemporal
spectra at the wave frequency and estimate the
components of the horizontal wave number. The
method basically accounts for the statistical phase
difference between each pair of wave sensors.
The wave propagating to the east of the sill was
estimated on the basis of 16 different combinations
of moorings. The wave propagates to the east in the
azimuth interval between 90 and 120 degrees, while
the wavelength ranges between 90 and 140 km.
3 NUMERICAL MODELING
In order to model the wave propagation we use the
fully nonlinear non-hydrostatic model of the
baroclinic tides developed by (Vlasenko, 1992;
Morozov et al., 2002). We consider a two
dimensional (x,z) flow in a continuously stratified
rotating ocean of variable depth.
Although the model is two dimensional, we
introduce the equation for the V-component of
velocity normal to the x,z plane to account for the
effects of rotation. However, the V-component is
considered constant. For convenience, the equation
of density diffusion has been used instead of the
equations of heat and salt diffusion.
The boundary conditions at the surface located at
z = 0 are zero for the density gradient, vorticity, and
stream function; hence, no tangential stresses are
considered. We also consider zero vertical motion
and no heat and salt transport through the surface.
At the bottom, no heat, salt, and mass transports
exist. The boundary condition for vorticity at the
bottom is calculated using equation = with the
value of the stream function field
obtained at the
previous time step.
The wave perturbations of vorticity, stream
function, and density are assumed zero at the lateral
boundaries located far from the bottom irregularities
at the submarine ridge. The calculations start from a
state of rest when the fluid at the bottom is
motionless, and the isopycnals are horizontal; hence:
at t=0: =0, =0, =0. We stop the calculations,
when the wave perturbations reach the lateral
boundaries. The phase velocity of the perturbations
does not exceed 2-3 m/s, which allows us to
continue the calculations for a suitable number of
time steps.
The bottom topography was introduced in the
model from the digital databases of bottom
topography. We specify a density field unperturbed
by internal waves corresponding to the vertical
distribution of the Brunt-Väisälä frequency N(z)
from observations.
A semi-implicit numerical scheme utilizes a
rectangular grid with second order approximations
to the spatial derivatives and first order
approximation of the temporal derivatives in every
temporal semi-layer. At each time step, the implicit
system, which is a tri-diagonal matrix, is solved
using standard techniques.
We model the following physical phenomenon.
A long barotropic tidal wave propagates from the
open ocean to the continental slope or submarine
ridge. The tidal currents flow over the topographic
obstacles and obtain a vertical component.
Periodically oscillating vertical components with a
tidal period displace water particles; thus a tidal
internal wave is generated. The input parameters of
the model are stratification, bottom topography, and
stream function of the tidal current. The model
outputs the fields of density and velocity over the
domain of calculations.
We have chosen a domain 300 km long with a
horizontal step of 200 m and 20 vertical levels. The
horizontal size of the domain significantly exceeds
the size of the strait, but allows us to analyze the
processes in the middle of the domain before the
perturbations reach the lateral boundaries. The time
step was approximately equal to 7 seconds. These
parameters satisfy the Courant-Friedrichs-Levy
condition. The coefficients of the horizontal eddy
viscosity and density diffusivity were fixed to 60
m
2
/s over the ridge and 4 m
2
/s beyond the ridge over
the flat bottom in the model. Strong motion at the
Strong Internal Tides in the Strait of Gibraltar: Measurements and Modelling
355
slopes of the sill requires great values of the
coefficients. The coefficients of vertical turbulent
viscosity and density diffusion were set to 0.001
m
2
/s.
The main objective of the model investigation is
to study the influence of the currents on internal tide
propagation in the Strait. In the first version of
model calculations we make the approximation of
the model with zero mean current. We introduce
only a periodical barotropic tidal flow by periodical
increasing and decreasing the value of the stream
function at the surface, while the value of the stream
function at the bottom is specified equal to zero. The
maximum value of the stream function was chosen
to provide the maximum horizontal tidal velocities
equal to 80 cm/s. The period of reciprocating flow is
12.4 hours.
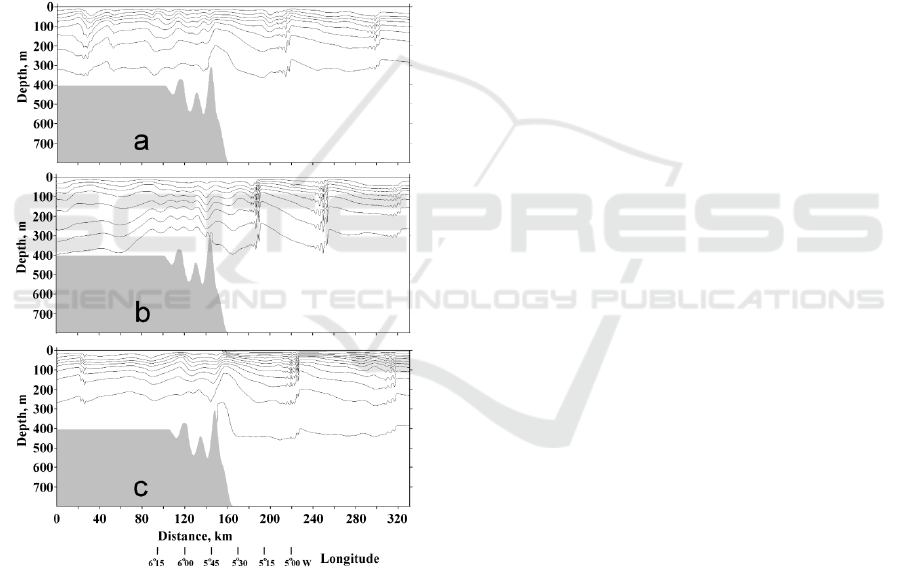
Figure 3: Perturbations of the density field induced by
propagating internal tide. The contour lines of density are
shown with an interval of 0.00025 g/cm
3
. Grey coloured
pattern shows bottom topography. The density
perturbations develop on the background of different
currents in the strait:
(a) Zero mean current
(b) Westward barotropic current
(c) Oppositely directed inflowing and outflowing currents.
The periodical changes in the horizontal flow
induce an internal wave propagating in both
directions from the sill positioned in the middle of
the computation area. The perturbations of the
density field induced by propagating internal tide are
shown in Fig. 3a. This snapshot of the density field
is depicted after four tidal periods of calculation.
The fluctuations of the density field are not
symmetrical with respect to the position of the
Camarinal Sill because the bottom topography is not
symmetrical. Camarinal Sill is strongly abrupt at the
eastern slope, while the bottom topography is more
corrugated and the mean inclination of the slope is
smaller west of the sill. A calculation, when the
bottom topography was specified only by a
symmetric sill, gave a symmetric pattern of
propagating fluctuation in both directions from the
sill.
Internal bore is formed on the trailing edge of the
wave, which is steeper than the leading edge. A
packet of shorter internal waves follows the bore.
The structure of the westerly propagating wave is
the same except for the fact that the bore and wave
train of shorter internal waves are less intensive in
the western part compared to the eastern part of the
basin.
In the second version of model calculation we
introduce a steady barotropic westward current in
the entire water column of the Strait by specifying
the permanent value of the stream function at the
surface and zero at the bottom so that the velocity of
the mean current is equal to 30 cm/s at the western
boundary. At the eastern boundary the velocity is
equal to 18 cm/s. The mean velocity over the sill is
equal to 41 cm/s. We superimpose a periodical
barotropic tidal current on the mean current as done
in the previous step. At the western boundary, the
maximum amplitude of the barotropic tidal velocity
is 80 cm/s, the same as it was without the mean
current.
The westward flow changes the internal wave
field (Fig. 3b). In the eastern part, where the internal
tide propagates opposite to the current, we observe a
well pronounced internal bore followed by a train of
short period internal waves. The mean current
opposite to the wave makes the wavelength shorter,
and hence the slopes of the internal tide are steeper,
which leads to wave breaking and formation of a
packet of shorter internal waves. For a uniform
westerly current the bore is observed in the entire
water column.
West of Camarinal Sill the internal tide
propagates in the same direction as the outflowing
current. The current increases the wavelength. The
internal bore is formed, but only a weak packet of
shorter waves appears.
ONM-CozD 2019 - Special Session on Observations and Numerical Modeling of the Coastal Ocean Zone Dynamics
356

In the third version of the model calculation we
have analyzed the internal tide developing in the
strait with two opposite currents modeling the real
situation. The eastward flow with mean velocities of
50 cm/s occupies the upper 250-300 m layer and the
lower current with a vertically average velocity of
25 cm/s occupies the rest of the water column. These
two opposite flows yield a strong shear at 200 m
depth. The two oppositely directed currents in the
stream were introduced in the model by specifying
two different vertical distributions of density in the
eastern and western parts. In this version of
calculations the computational area was increased in
the eastern and western directions. In the beginning
of the calculations the water was set to flow free
under the influence of different density distributions
in the eastern and western parts. After the
adjustment and formation of a two-layer flow in the
central part of the computational area we
superimpose the same tidal flow as in the previous
versions of calculations. The wavelength of the
easterly propagating wave is 90 km. The leading
edge of the wave is flatter than the trailing edge,
which is very steep. This leads to the formation of
internal bore. A train of shorter internal waves
follows a sharp depression of density contour lines.
The westerly propagating wave is shorter. Its
wavelength is 60 km, as the depth west of Camarinal
Sill is smaller. The structure of the wave is
approximately the same except for the fact that
internal bore is less intensive in the western part than
in the eastern part of the basin.
The introduction of two opposite currents with a
shear intensifies the internal bore in the upper layer
at depths of 100-200 m, while in the deeper water it
becomes less apparent (Fig. 3c). Intensification of
the internal bore and associated short period internal
waves in the upper layer in the eastern part obtained
in the model calculations confirms the observations
at the surface made from satellites, airplanes, and
coastal radars that surface manifestations of internal
tide are clearly seen in the eastern part of the strait.
4 CONCLUSIONS
The main results of this research are the following:
Internal tidal oscillations observed in the Strait
are mostly generated over Camarinal Sill.
The observations analyzed depict the generation
of internal tides with peak-to-peak amplitudes
exceeding 200 m. The waves propagate in both
directions from the sill loosing energy while
propagating. The major motion of internal tide is
associated with the semidiurnal M2 frequency.
ACKNOWLEDGEMENTS
This research was performed within the framework
of the state assignment of Russia (theme no. 0149-
2019-0004) and supported in part by the Russian
Foundation for Basic Research) (project no. 17-08-
00085).
REFERENCES
Barber, N.F., 1963. The directional resolving power of an
array of wave detectors. In: Ocean wave spectra, N.Y.,
Engelwood Cliffs, Prentice Hall, pp. 137-150.
Bryden, H.L., Candela, J., and Kinder, T.H., 1994,
Exchange through the Strait of Gibraltar, Prog.
Oceanogr., 33, pp. 201-248.
Morozov, E.G., Trulsen K., Velarde M.G., and Vlasenko
V.I., 2002, Internal tides in the Strait of Gibraltar, J.
Phys. Oceanogr., 32, pp. 3193-3206.
Morozov E.G., Parrilla-Barrera G., Velarde M.G.,
Scherbinin A.D., 2003, The Straits of Gibraltar and
Kara Gates: A Comparison of Internal Tides,
Oceanologica Acta, Vol. 26 (3), pp. 231-241.
Vlasenko V.I., 1992, Nonlinear model for the generation
of baroclinic tides over extensive inhomogeneities of
bottom topography. Phys. Oceanogr. (Morskoy
gidrofizicheskiy zhurnal). Vol. 3: pp. 417–424
Strong Internal Tides in the Strait of Gibraltar: Measurements and Modelling
357
