
3D Point Clouds in PostgreSQL/PostGIS for Applications in GIS and
Geodesy
Theresa Meyer
a
and Ansgar Brunn
b
University of Applied Sciences Wuerzburg-Schweinfurt, Roentgenring 8, Wuerzburg, Germany
Keywords:
3D Point Clouds, Point Cloud Tiling, Geodatabase, GIS, 3D Applications.
Abstract:
Besides the common approach of an exclusively file based management of 3D point clouds, meanwhile it is
possible to store and process this special type of massive geodata within spatial database systems. Users benefit
from the general advantages of database solutions and especially from the potentials of a combined analysis of
original 3D point clouds, 2D rasters, 3D voxel stacks and 2D and 3D vector data in order to gain valuable geo-
information. This paper describes the integration of 3D point clouds into an open source PostgreSQL/PostGIS
database using the Pointcloud extension and functions of the Point Data Abstraction Library (PDAL). The
focus is on performing three-dimensional spatial queries and the evaluation of different tiling methods for
the organization of 3D point clouds into table rows, regarding memory space, performance of spatial queries
and effects on interactions between point clouds and other GIS features within the database. A new approach
for an optimized point cloud tiling, considering the individual geometric characteristic of a 3D point cloud,
is presented. The results show that an individually selected storage structure for a point cloud is crucial for
low memory consumption and high-performance 3D queries in PostGIS applications, taking account of its
three-dimensional spatial extent and point density.
1 INTRODUCTION
3D point clouds are increasingly gaining importance
for various applications mainly in fields of geodesy,
geoinformatics, architecture and archaeology.
Even though modern measuring devices such as
laser scanners, UAS (unmanned aerial systems) and
mobile mapping systems enable a very fast genera-
tion of 3D point clouds, the handling of large amounts
of point data is a challenging task. Even though
point clouds are meanwhile indispensable input data
for many projects processed by even small engineer-
ing offices. These include e.g. as-built documen-
tations of buildings and plants (Tang et al., 2010),
change detection and deformation analysis of en-
gineering constructions (Mukupa et al., 2017) and
three-dimensional terrain modeling as a basis for
building projects (Burger et al., 2016).
The management of 3D point clouds is currently
usually file based. Common exchange formats for 3D
point cloud data are LAS (ASPRS, ), PCD (Rusu and
Cousins, 2011) and E57 (Huber, 2011). These point
a
https://orcid.org/0000-0002-3146-7645
b
https://orcid.org/0000-0002-8692-3636
cloud formats enable a lossless transport of up to bil-
lions of 3D point coordinates (X,Y,Z) and dozens of
additional point attributes such as Intensity, Return
Number, Red, Green, Blue, NIR, Classification and
Point Source ID.
As an alternative to an exclusively file based
handling, it is meanwhile possible to manage 3D
point clouds within spatial database systems (geo-
databases). General advantages of a database solu-
tion are data consistency, security, reduced storage
space and multi user access. Furthermore another
even greater benefit is that 3D point clouds can be re-
lated to all types of spatial and non-spatial data, such
as raster, vector and administrative data, within the
geodatabase.
This paper describes the integration of 3D point
clouds as GIS features next to common raster and vec-
tor data in spatial database systems on the example of
PostgreSQL/PostGIS with the Pointcloud extension
(PostgreSQL, 2019), (PostGIS, 2019), (Pointcloud,
2019). Pointcloud extends PostgreSQL/PostGIS with
two new data types and various operations to store and
analyze 3D point clouds using GIS tools.
The focus is on the evaluation of different ap-
proaches for a blockwise organization of 3D point
154
Meyer, T. and Brunn, A.
3D Point Clouds in PostgreSQL/PostGIS for Applications in GIS and Geodesy.
DOI: 10.5220/0007840901540163
In Proceedings of the 5th International Conference on Geographical Information Systems Theory, Applications and Management (GISTAM 2019), pages 154-163
ISBN: 978-989-758-371-1
Copyright
c
2019 by SCITEPRESS – Science and Technology Publications, Lda. All rights reserved

clouds in table rows. With regard to 3D applica-
tions, a new method for a three-dimensional tiling of
3D point clouds is presented. Additionally, the paper
includes a practical guide to performing multistage
operations for querying 3D point clouds with three-
dimensional vector features.
2 3D POINT CLOUDS IN GIS
Integration of original 3D point clouds is useful for
many GIS applications such as generation of 3D
building models as an important part of 3D city mod-
els (Haala and Brenner, 1997), detection of vegetation
in urban areas (Hoefle and Hollaus, 2010), for terrain
and object modeling in flood simulations (Merwade
et al., 2008) and for the extraction of roof and facade
surfaces for solar potential analyzes (Voegtle et al.,
2005), (Jochem et al., 2011).
When dealing with point clouds two fundamen-
tal cases have to be distinguished. If there is only or
mostly one Z value for each combination of X and
Y, the point cloud can be considered as a 2.5D point
cloud. Such point clouds are usually generated from
airborne data acquisition e.g. airborne laser scanning
or UAV photogrammetry. They can easily be con-
verted to a raster format in order to process and an-
alyze them with common GIS tools. On the other
hand, unstructured point clouds with a pronounced
3D character can be considered as ”true” 3D point
clouds. They are typically generated from terrestrial
or mobile laser scanning, even combining indoor and
outdoor scenarios. A raster interpolation would cause
an irreversible loss of information for such types of
3D point clouds. As a result, the need for suitable 3D
storage structures and 3D operations arises for ”true”
3D point clouds.
The Feature Geometry Model is a general stan-
dard for 3D GIS. It supports three-dimensional coor-
dinates and object classes for 3D surfaces, triangular
irregular networks (TINs), 3D bodies and 3D topol-
ogy. Part 3 of the SQL Multimedia and Application
Packages (SQL/MM Spatial) extend the Simple Fea-
ture Model with useful 3D operations.
While there are well-established and standardized
models and structures for 2D raster and vector data
in geodatabase systems, the integration of original
3D point clouds is not yet specified or standardized.
Currently, the Open Geospatial Consortium (OGC)
Point Cloud working group is dedicated to defining
requirements for interoperability and implementing
standards in the application of 3D point clouds (OGC,
2019).
3 PostgreSQL/PostGIS WITH
POINTLCOUD EXTENSION
Common geometric data types such as POINT Z and
MULTIPOINT Z are not appropriate for the huge
number of points within a typical 3D point cloud,
e.g. from a terrestrial 3D laser scan. The Pointcloud
extension enables the persistent storage of 3D point
clouds and at the same time efficiently accessing all
additional point attributes. Pointcloud extends Post-
GIS with the new data types PcPoint and PcPatch.
Several hundreds or thousands of spatially adjacent
points are organized into lossless compressed byte ar-
rays, called patches (blocks). Each patch is stored in
an individual table row and corresponds to a PcPatch
object.
Pointcloud deals with the challenge of varying
point attributes by using an XML schema document,
which describes the contents of any particular point.
Every point might contain up to dozens of additional
attributes/dimensions, and each of it can be of any
data type, e. g. with scaling and/or offsets applied.
3.1 Extended Point Cloud Tiling with
PDAL
Point clouds are tiled into patches while writing to the
Postgres database in order to manage and query them
efficiently in tables.
The point cloud tiling is implemented by default
during the database import as part of the execu-
tion of command line instructions and functions of
the Point Data Abstraction Library (PDAL) (PDAL,
2019). PDAL provides two basic functions for point
cloud tiling:
• Irregular tiling with filters.chipper()
All patches are spatially contiguous and non-
overlapping. Each patch has the capacity point
count specified. The default capacity is 5000
points per patch. Patches are filled with points
considering their proximity in X/Y plane. Z co-
ordinates are not considered while tiling with the
Chipper function. For each patch, the algorithm
controls the maximum extend only in X and Y di-
rection and rearranges in case of imbalance.
• Regular tiling with filters.splitter()
Points are organized into regular square patches
when applying the Splitter function. The user
determines a grid size (in meter). The tile origin
is either chosen randomly or is also determined
by specifying an X and Y coordinate. This regu-
lar tiling method creates patches with the same ex-
3D Point Clouds in PostgreSQL/PostGIS for Applications in GIS and Geodesy
155

tent in the X/Y plane, but with varying numbers
of points.
Regardless of the chosen tiling method, the user has
to be aware that both, applying filters.chipper() and
filters.splitter(), is not a 3D tiling but only a 2D tiling
of a 3D point cloud. The individual extend along the
Z axis is not considered for a point cloud. As a result
of a 2D tiling, points that may be far apart because of
different Z values in 3D space may still be assigned to
the same patch array. This leads to very unbalanced
patches especially for point clouds with a very pro-
nounced 3D character (cf. fig. 1).
An improved tiling method can be applied in or-
der to achieve a 3D tiling. That approach takes ad-
vantage of an additional PDAL function named fil-
ters.range(). The Range function enables the filter-
ing of a point cloud by any attribute/dimension. The
maximum Z extension for each patch can be lim-
ited when applying filters.range() on the Z dimen-
sion. This procedure corresponds to a contouring
e.g. with 1m interval. The Range function can be
used to create a ’Z’ extended three-dimensional point
cloud tiling when combining with filters.chipper() or
filters.splitter() (cf. fig. 2).
3.2 Integration of PostGIS
All functions of the Pointcloud extension refer to the
two central Pointcloud objects PcPoint and PcPatch.
Overall, PcPoints play only a minor roll. Although
it is possible to create Pointcloud tables of PcPoints
with a valid schema, these points are primarily needed
only for special queries e.g. as an intermediate step in
order to convert a small result set of point cloud points
into PostGIS points of the type POINT Z. Full-scale
3D point clouds are exclusively managed in PcPatch
tables, and Pointcloud provides a number of special
functions for this purpose.
There are functions for creating and dis-
solving, sorting and compressing/uncompressing
patches (e.g. PC MakePatch(), PC Union(),
PC Sort() and PC Compress()) and functions
for returning content information of patches
(e.g. PC Summary(), PC NumPoints() or
PC PatchMax() and PC PatchMin()). Furthermore
the Pointcloud functions PC FilterGreaterThan(),
PC FilterLessThan(), PC FilterBetween() and
PC FilterEquals() enable a filtering of points based
on attribute values such as intensity, classification
code, Z value or time-stamp.
Interactions between Pointcloud and PostGIS ob-
jects become possible only with enabling the addi-
tional extension Pointcloud PostGIS for the database.
Patches can be checked to see whether they over-
lap the geometry of a PostGIS object using the
function PC Intersects() and new patches can be
generated which represent the result set of an in-
tersection between a PcPatch and e.g. a poly-
gon using PC Intersection(). Both PC Intersects()
and PC Intersection() only accept 2D objects and
therefore do not enable spatial queries in 3D. The
PC EnvelopeGeometry() function returns the two-
dimensional boundary of a patch as a PostGIS poly-
gon and PC BoundingDiagonalGeomery() enables
the creation of a 3D index by returning the 3D bound-
ing box diagonals of a patch as LINESTRING Z.
3.3 Multistage 3D Query
The Pointcloud PostGIS extension offers the func-
tions PC Intersects() and PC Intersection() for inter-
section queries and operations involving Pointcloud
and PostGIS features. Both functions do not accept
three-dimensional query objects of the type POLY-
HEDRALSURFACE Z but only two-dimensional
PostGIS features e.g. polygons. Thus, point cloud
points can initially only be queried projected onto
the X/Y-plane. But there is a practical multistage
workaround for spatially querying a 3D point cloud
with a 2.5D volumetric object in 3D space:
1. The Pointcloud function PC BoundingDiagonal-
Geometry() returns the diagonal of the 3D
bounding boxes of all patches as 3D Lines
(LINESTRING Z).
2. In order to enable high-performance queries in
3D, a 3D index is set up for the diagonals resp.
their 3D bounding boxes.
3. By using the index operator &&&, the 3D bound-
ing boxes of all patch diagonals are selected,
which overlap the 3D bounding box of any 3D ob-
ject of the type POLYHEDRALSURFACE Z.
4. The 3D bounding boxes of the patch diagonals
are converted to solids using the PostGIS func-
tion Box3D() in order to enable an exact test for
intersection using the ST 3DIntersects() operation
(SFCGAL backend only) (cf. fig. 4).
5. The selected solids are returned to the original Pc-
Patch objects with an inner join via a key attribute
(ID).
6. The preselected point cloud patches are tailored
to the limitations of the query object in X and
Y using the Pointcloud function PC Intersection()
(cf. fig. 5).
7. In dependence of the tiling method, the patches
still contain 3D points that are above or below the
query object. For queries with 2.5D objects, the
GISTAM 2019 - 5th International Conference on Geographical Information Systems Theory, Applications and Management
156

Figure 1: 2D tiling of a 3D point cloud with 3.3 million points with filters.chipper() and 100 points capacity.
Pointcloud function PC FilterBetween() is rec-
ommended. It can be used to exactly limit the
minimum and maximum Z extents of the final re-
sult patches (cf. fig. 6).
The result of such a multistage 3D query is a selec-
tion of patches which only contain 3D points that are
within the query object or on its boundary.
A possible scenario is e.g. interactions between a
point cloud and a 3D building model. The query ob-
ject could be a model of an indoor wall and task is
the selection of all 3D points from a terrestrial laser
scan that probably represent the object. Such a point
subset can be further processed and analyzed e.g. as
part of an as-built documentation. Subsets of a point
cloud can be exported with PDAL from the database
into any point cloud format, further processed with
external functions and direct database connection or
converted as PostGIS points of type POINT Z. The
latter also enables point queries with any 3D objects
in PostGIS. But in practice works only for dispropor-
tionately small subsets of 3D points that barely corre-
spond to the essence of a 3D point cloud.
3.4 Comparison of Tiling Methods
The decision for a specific tiling method and con-
figuration is entirely up to the user. In the PDAL
documentation, the only recommendation is that the
space requirement of a single patch should not ex-
ceed the default 8 KB page size of a PostgreSQL
database, and for most LIDAR data, this should prac-
tically mean a patch size of between 400 and 600
points (PDAL, 2019). However, the default capac-
ity of filters.chipper() is at 5000 points and therefore
exceeds this recommendation by a factor of 10.
For the user, the question arises which tiling
method (regular, irregular, 2D, 3D) to choose for
which type of point cloud and concrete project def-
inition. The impact of filters.chipper() and fil-
ters.splitter() in various configurations on storage
space requirements within the database were exam-
ined. It is recommended to choose a large capacity for
Chipper tiling resp. a large grid size for Splitter tiling
in order to achieve a maximum and lossless compres-
sion of the data, independent of effects on interactions
in database operation. The more 3D points within a
patch, the fewer patches are created in total and the
more effective the standard compression method ”di-
mensional”. This compression mode stores patches as
collections of dimensional data arrays, with an “ap-
propriate” compression for each attribute/ dimension
applied (e.g. run-length encoding for dimensions with
low variability) (Boundless, 2015).
Furthermore, a comparison between 2D and 3D
tiling shows that a 3D tiling has clearly positive ef-
fects on storage space requirements of Pointcloud ta-
bles (cf. fig. 7 and 8). It can be assumed that this posi-
tive effect is also due to the compression of the points
within the patches, since points within a 3D tile are
strongly adjacent. Closely adjacent points will tend
to have more homogeneous dimensions (e.g. coorid-
inates, color, intensity, classification codes, etc.), and
as a result, can be compressed more effectively. Com-
parisons of 2D and 3D tiling, with and without com-
3D Point Clouds in PostgreSQL/PostGIS for Applications in GIS and Geodesy
157

Figure 2: 3D tiling of a 3D point cloud with 3.3 million points with filters.chipper(), 100 points capacity and 1m contour
interval.
pression have confirmed this assumption.
The tiling method also has an impact on spatial
queries concerning query duration and number of se-
lected points in single stages of a multistage opera-
tion. Generally, there is a difference between queries
on patch level and queries on point level. The first
filter stage is a preselection of patches based on an in-
dex operation and approximated geometries (stage 1).
Stage 2 represents the intersection between patches
and the original shape of a query object instead of its
3d bounding box. Finally, the last stage is a selection
on point level using Pointcloud functions (stage 3).
The chosen tiling method has no impact on the
fact that the stage of preselection always returns the
biggest number of patches resp. points. The num-
ber of candidate patches and points is continuously
reduced during the query procedure until the final
subset of points is reached. Regardless of the tiling
method, the number of resulting single points is ex-
actly the same, but there are differences in the preci-
sion of the result after filter stages 1 and 2 depending
on the individual tiling of a point cloud.
A query procedure eventually returns the same set
of points for each tile method, but there are significant
differences in the intermediate results for each filter
stage. These differences can affect the performance
of practical applications. The smaller the number of
points in a patch, the finer the tiling, and the more pre-
cise the query results, but the higher the total number
of patches and thus the overhead of operations in the
database.
The individual geometric characteristic of a 3D
point cloud (especially the ratio of Z extend to X and
Y) is decisive for the different effects of varying 2D
and 3D tiling methods. Besides, the shape of an in-
volved query object also has an impact on the results
of a multistage query.
The diagrams in figure 9 show the effects of dif-
ferent tiling methods on the result sets of point re-
quests of stages 1 and 2 for an example point cloud.
All points are requested that are inside a cuboid in 3D
space (cf. fig. 4 - 6). The example point cloud extends
over several floors inside a building and therefore has
a very strong 3D character. The results of 2D and 3D
tiling methods, each with patches of different sizes,
show that 3D tiling is generally better suited than the
standard 2D variant for the most accurate results pos-
sible from patch level queries in filter stages 1 and 2.
4 ALTERNATIVE SOLUTIONS
FOR THE INTEGRATION OF
3D POINT CLOUDS IN GIS
The processing of original 3D point clouds is not a
classic GIS task, but is largely implemented in spe-
cial software for point clouds, laser scanning, digital
photogrammetry and/or 3D modeling. For example,
CloudCompare (CloudCompare, 2019) is a very ver-
satile open source point cloud software but it does not
provide a programming or database interface.
GISTAM 2019 - 5th International Conference on Geographical Information Systems Theory, Applications and Management
158

Figure 3: Result of PC Intersection().
There exist some open source libraries for pro-
cessing and analyzing 3D point clouds independent
of any proprietary software solutions. Such libraries
can be used to extend the functionality of open point
cloud management systems. In the context of Post-
GIS/Pointclound, the PDAL library is one of the
most important. PDAL functions realize the practical
database import of point clouds by processing instruc-
tions (so-called PDAL pipelines), which are written
in JSON syntax and executed via the command line.
So-called filter functions can additionally be applied
within the execution of a PDAL pipeline, e.g. neigh-
borhood calculations such as normal vectors, eigen-
values or voxel centroids. Other functions can be used
to colorize a point cloud from an aerial photograph of
an area, to create meshes or to apply arbitrary rotation
and translation transformations. There is also a bridge
between PDAL and the Point Cloud Library (PCL),
whose focus is even more on the development of
new algorithms for processing 3D point clouds (PCL,
2019). Furthermore, PDAL supports the Python pro-
gramming language in the way that Python code can
be embedded into PDAL pipelines. The other way
around, there is a PDAL extension for Python, which
makes it possible to execute PDAL functions within
Python applications.
Another library for 3D data and point clouds is
Open3D (Zhou et al., 2018). It provides general pro-
cessing algorithms for 3D point clouds and function-
ality for point cloud rendering. Open3D is also exe-
cutable via a python extension and therefore suitable
for interactions with point clouds within the PostGIS
database.
The LAStools (only partially free) (Rapidlasso,
2019) and LibLAS library (LibLAS, 2019) are spe-
cially designed for handling LiDAR point clouds in
the LAS format.
Program libraries can expand point cloud data
with additional attributes, and thus increase the infor-
mation content within a database.
There are also proprietary software solutions for
the integration of original 3D point clouds in GIS ap-
plications. ESRI’s LAS-datasets enable an efficient
management of 3D point clouds within the ArcGIS
software-suite (ESRI, 2019). Such data sets store ref-
erences to LAS point clouds in any file directory. This
provides central access to point clouds that are dis-
tributed in individual files. Combined with tools for
point cloud generation from aerial image data (the so-
called Ortho Mapping Tools), ArcGIS, as a single sys-
tem, already covers large parts of the overall workflow
for generating, processing and GIS based analysis of
e.g. UAV products. Rapidlasso’s LAStools software
suite includes a wide variety of point cloud command
line tools, which also refer to individual LAS files
(Rapidlasso, 2019). These tools can also extend the
functionality of ArcGIS, QGIS, and Erdas Imagine as
a plugin.
A similar software product for point cloud pro-
cessing is OPALS (Orientation and Processing of
Airborne Laser Scanning Data), developed from the
Technical University Vienna (OPALS, 2019). OPALS
is specially designed for the handling of LiDAR point
clouds even though its functionality is not restricted
to this type of point data. With its various modules
and functions, the software largely covers the entire
processing chain for georeferencing, quality control,
classification, filtering and terrain modeling. Even
massive point clouds can be processed with the in-
tegrated database manager. For a direct connection
to GIS software, OPALS can be used via Python
and there exists a special OPALS extension for QGIS
(QPALS, 2019).
Finally, the commercial geodatabase Oracle Spa-
tial also supports the storage and processing of n-
dimensional point clouds with the SDO PC PKG
package. As with Pointcloud for PostGIS, point
clouds are tiled into blocks of adjacent points with
a given point capacity. In contrast to the PostGIS
database, the PC Clip() function enables the selec-
3D Point Clouds in PostgreSQL/PostGIS for Applications in GIS and Geodesy
159
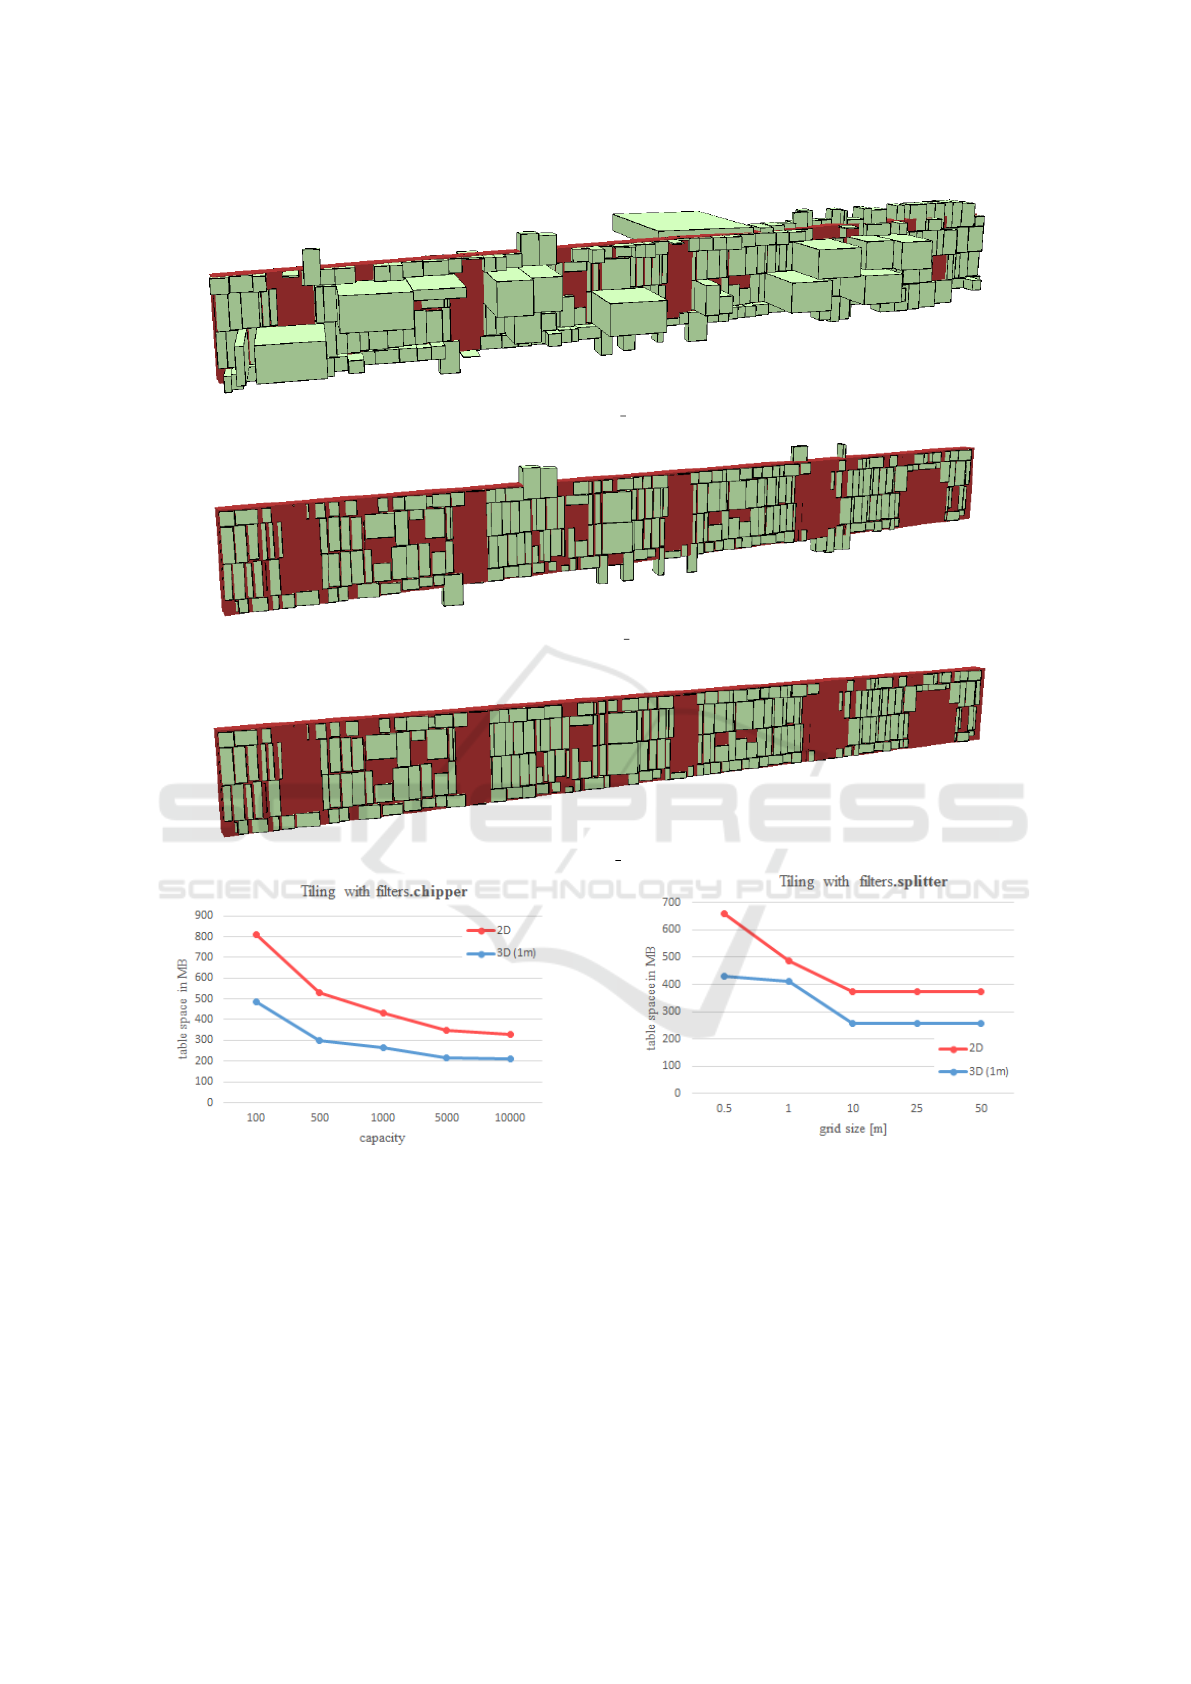
Figure 4: Result of ST 3DIntersects().
Figure 5: Result of PC Intersection().
Figure 6: Result of PC FilterBetween().
Figure 7: Comparison of the storage space of a point cloud
tiled with filters.chipper() in 2D and 3D.
tion of subsets from a point cloud using both 2D
(polygons) and 3D (parallelepiped) geometries (Or-
acle, 2019).
5 CONCLUSIONS
The integration of massive 3D point clouds as features
in geodatabases is quite possible and there are many
Figure 8: Comparison of the storage space of a point cloud
tiled with filters.splitter() in 2D and 3D.
examples for the benefit of point clouds in GIS appli-
cations. Valuable information can be exchanged be-
tween point clouds and common GIS features based
on their proximity in 2D and 3D. Even general engi-
neering projects, which are not necessarily associated
with classical GIS applications, can be optimized by
managing point clouds in spatial databases. Work-
flows benefit from a combined storage and analysis of
large 3D point clouds with other project data (whether
spatial oder non-spatial/administrative) as well as the
GISTAM 2019 - 5th International Conference on Geographical Information Systems Theory, Applications and Management
160
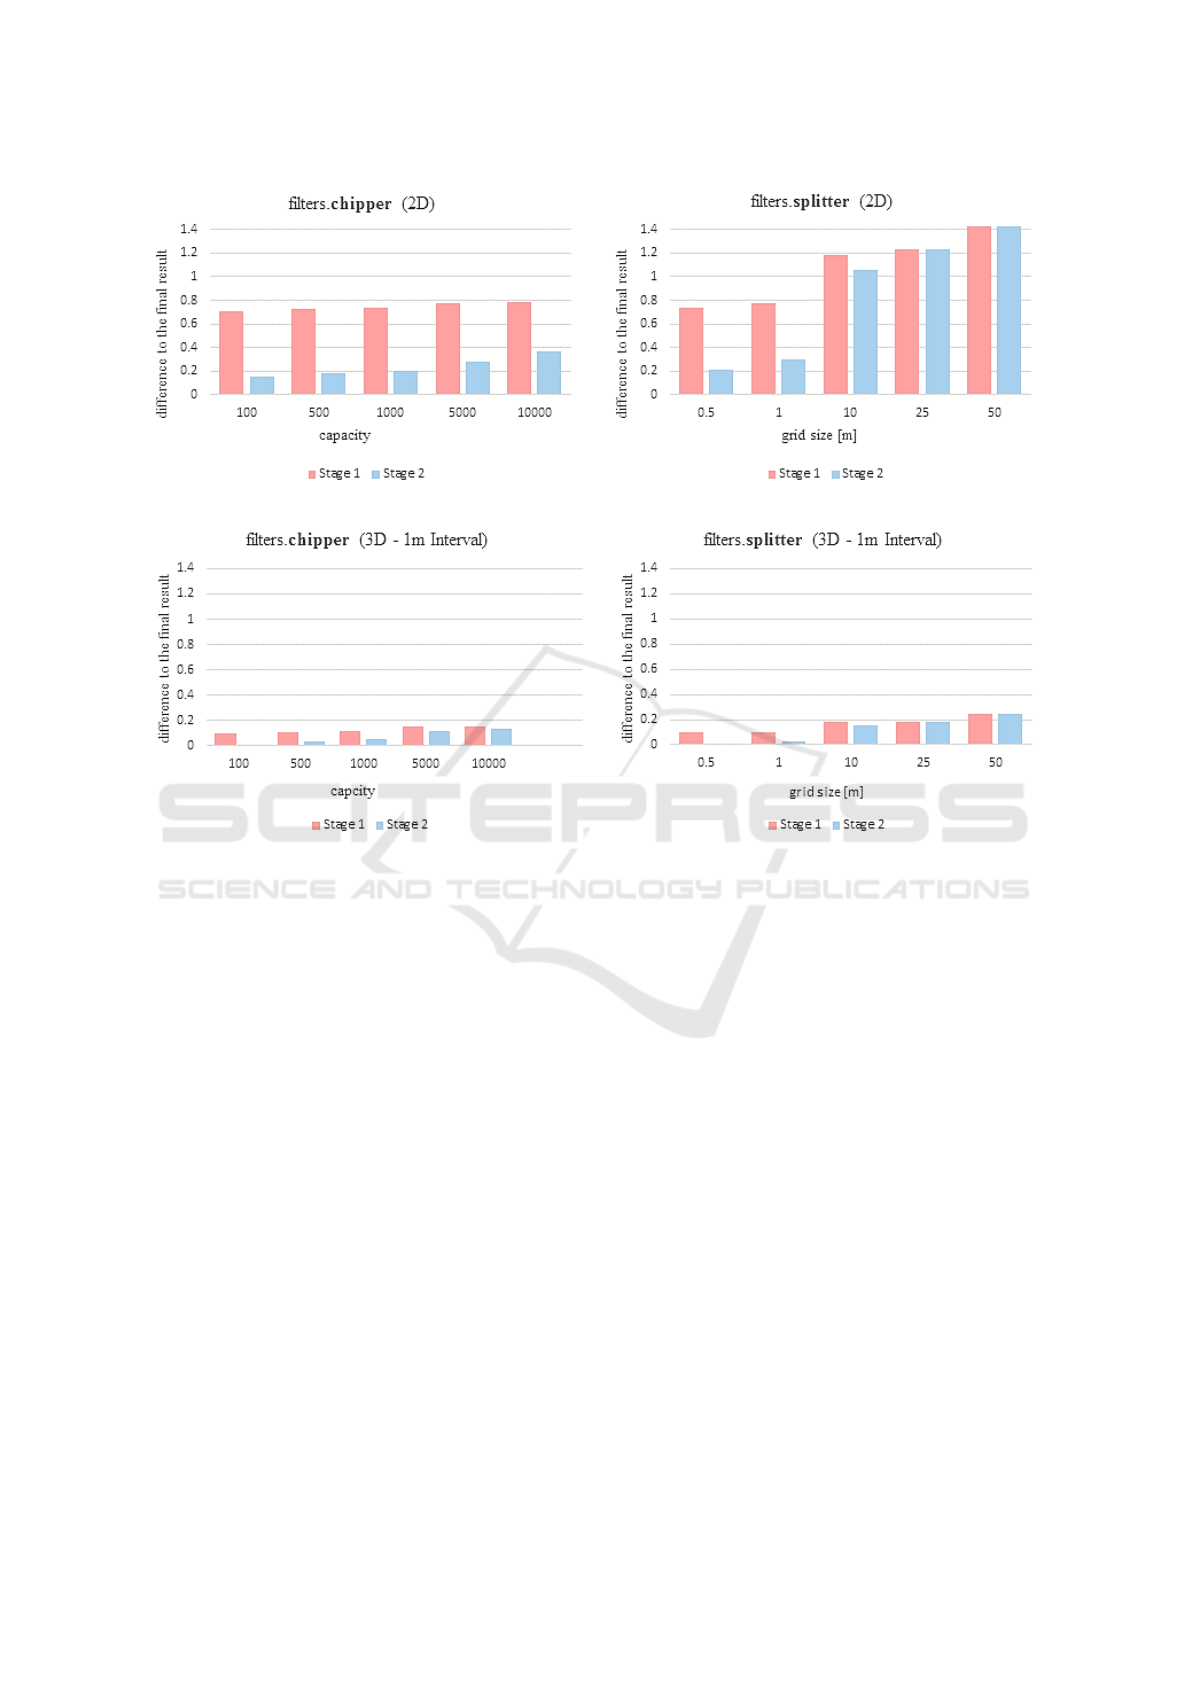
Figure 9: Effects of different tiling methods in 2D and 3D on the result sets of point requests of stages 1 and 2 for an example
point cloud with approx. 3 million points.
benefits of centralized data management and multi-
user operation.
PostGIS with Pointcloud extension enables a
blockwise storage of 3D point clouds in tables. Un-
fortunately, PostGIS is generally restricted to two-
dimensional operations with point clouds. In addi-
tion, the question of suitable point cloud tiling is still
an open topic with missing solutions and standards.
Although there are some default values, these are
not necessarily the best choices for any type of point
cloud. The Pointcloud extension was originally devel-
oped for LiDAR point clouds from airborne laserscan-
ning, which have rather a 2.5D than 3D character. A
rough 2D tiling is sufficient for such point clouds and
small-scale projects but it is clearly not for 3D point
clouds with a large Z extend and high point density in
large-scale scenes.
In this paper, a new extended and optimized point
cloud tiling has been developed and realized taking
into account the point cloud extend along the Z axis
by using and combining functions of the open source
PDAL library. The results show, that such a 3D tiling
has positive effects on the storage space requirements
of point cloud tables in PostGIS. Furthermore, this
optimized kind of point cloud organization provides
much more precise point sets in early filter stages on
patch level for 3D applications.
An example for a practical application of a well-
suited tiling of a 3D point cloud is given in figure 10.
Classified 3D point cloud tiles are supposed to repre-
sent trees within a forest GIS project. For the purpose
of forest management, these 3D tiles/patches can be
used e.g. for a simulation of the incidence of light
through the treetops on the forest floor.
In context of topics such as ”Indoor GIS” and the
integration of Building Information Modeling (BIM)
and GIS, the topic ”3D” in GIS is of particular rel-
evance. Current research is devoted to approaches
for indoor routing in building GIS (Wilkening et al.,
2019) and the semi-automatic extraction of indoor
data models based on point clouds (Tessema et al.,
2019). 3D point clouds are captured for different pur-
poses. They have very individual properties and char-
acteristics. These circumstances need to be taken into
account when choosing a suitable point cloud tiling.
There are already extensive comparisons of
3D Point Clouds in PostgreSQL/PostGIS for Applications in GIS and Geodesy
161

Figure 10: 3D tiled point cloud for forest management ap-
plications within a ”true” 3D GIS project.
database solutions in which the management of dif-
ferent sized LiDAR point clouds in different systems
(PostGIS, Oracle Spatial and MonetDB) have been
tested and compared (Van Oosterom et al., 2015).
Further investigations of tiling and querying different
types of point clouds within spatial databases is part
of future work. In any case, the focus will be on point
clouds with a pronounced 3D character in large-scale
applications which benefit from ”3D” capabilities e.g.
3D point clouds within a ”Campus GIS” (Wilkening
et al., 2018).
REFERENCES
ASPRS. LAS Specification Version 1.4 – R13. The Amer-
ican Society for Photogrammetry and Remote Sens-
ing. https://www.asprs.org/wp-content/uploads/2010/
12/LAS 1 4 r13.pdf.
Boundless (2015). Open Geo Suite 4.6 - home-
page. https://connect.boundlessgeo.com/docs/suite/4.
6/index.html (Accessed 28 Feb 2019).
Burger, S., Elflein, A., and Voelter, U. (2016). Photo-based-
scanning als Erweiterung des ingenieurgeodaetischen
Leistungsspektrums. In Schriftenreihe des DVW, vol-
ume 82, pages 175–189.
CloudCompare (2019). CloudCompare - project home-
page. https://www.danielgm.net/cc/ (Accessed 28 Feb
2019).
ESRI (2019). ESRI - ArcGIS documentation. http://
desktop.arcgis.com (Accessed 28 Feb 2019).
Haala, N. and Brenner, C. (1997). Interpretation of Ur-
ban Surface Models Using 2D Building Information.
In Computer Vision and Image Understanding, vol-
ume 72, pages 204–214.
Hoefle, B. and Hollaus, M. (2010). Urban Vegetation De-
tection using high Density Full-Waveform Airborne
LIDAR Data – Combination of Object-based Image
and Point Cloud Analysis. In International Archives
of Photogrammetry, Remote Sensing and Spatial In-
formation Sciences, volume 38, pages 281–286.
Huber, D. (2011). The ASTM E57 File Format for 3D Imag-
ing Data Exchange. In Proceedings of the SPIE Vol.
7864A, Electronics Imaging Science and Technology
Conference (IS&T), 3D Imaging Metrology.
Jochem, A., Hoefle, B., and Rutzinger, M. (2011). Ex-
traction of Vertical Walls from Mobile Laser Scanning
Data for Solar Potential Assessment. In Remote Sens-
ing, volume 3, pages 650–667.
LibLAS (2019). LibLAS - project homepage. https://liblas.
org/ (Accessed 28 Feb 2019).
Merwade, V., Cook, A., and Coonrod, J. (2008). GIS tech-
niques for creating river terrain models for hydrody-
namic modeling and flood inundation mapping. In
Environmental Modelling and Software, volume 23,
pages 1300–1311.
Mukupa, W., Roberts, G. W., Hancock, C. M., and Al-
Manasir, K. (2017). A review of the use of terres-
trial laser scanning application for change detection
and deformation monitoring of structures. Survey Re-
view, 49(353):99–116.
OGC (2019). Point Cloud Domain Working Group - project
homepage. http://www.opengeospatial.org/projects/
groups/pointclouddwg (Accessed 28 Feb 2019).
OPALS (2019). OPALS - project homepage. https://geo.
tuwien.ac.at/opals/html/index.html (Accessed 28 Feb
2019).
Oracle (2019). Oracle - documentation. https://www.oracle.
com/technetwork/database-options/spatialandgraph/
documentation/spatial-doc-idx-161760.html (Ac-
cessed 28 Feb 2019).
PCL (2019). Point Cloud Library - project homepage. http:
//pointclouds.org/ (Accessed 28 Feb 2019).
PDAL (2019). Point Data Abstraction Library - project
homepage. https://pdal.io/ (Accessed 28 Feb 2019).
Pointcloud (2019). Pointcloud - project homepage. https:
//github.com/pgpointcloud/pointcloud (Accessed 28
Feb 2019).
PostGIS (2019). PostGIS - project homepage. https:
//postgis.net/ (Accessed 28 Feb 2019).
PostgreSQL (2019). PostgreSQL - project homepage. https:
//www.postgresql.org/ (Accessed 28 Feb 2019).
GISTAM 2019 - 5th International Conference on Geographical Information Systems Theory, Applications and Management
162

QPALS (2019). QPALS - project homepage. https://geo.
tuwien.ac.at/opals/html/usr qpals.html (Accessed 28
Feb 2019).
Rapidlasso (2019). Rapidlasso - homepage. https://
rapidlasso.com/lastools/ (Accessed 28 Feb 2019).
Rusu, R. and Cousins, S. (2011). 3D is here: Point Cloud
Library (PCL). In IEEE International Conference on
Robotics and Automation (ICRA, Shanghai),9-13 May
2011, DOI: 10.1109/ICRA.2011.5980567.
Tang, P., Huber, D., Akinci, B., Kipman, R., and Lytle, A.
(2010). Automatic reconstruction of as-built building
information models from laser-scanned point clouds:
A review of related techniques. In Automation in Con-
struction, volume 19, pages 829–843.
Tessema, L., Jaeger, R., and Stilla, U. (2019). Extraction
of IndoorGML Model from an Occupancy Grid
Map Constructed Using 2D LiDAR. In German
Society for Photogrammetry, Remote Sensing and
Geoinformation, 39st Conference. Thomas P. Kersten.
https://www.dgpf.de/src/tagung/jt2019/proceedings/
proceedings/papers/21 3LT2019 Tessema et al.pdf.
Van Oosterom, P., Martinez-Rubi, O., Ivanova, M.,
Horhammer, M., Geringer, D., Ravada, S., Tussen, T.,
Kodde, M., and Goncalves, R. (2015). Massive point
cloud data management: Design, implementation and
execution of a point cloud benchmark. volume 49,
pages 92–125. Computers and Graphics.
Voegtle, T., Steinle, E., and Tovari, D. (2005). Airborne
Laserscanning Data for Determination of suitable ar-
eas for Photovoltaics. In ISPRS Workshop Laser scan-
ning 2005, volume 23, pages 12–14.
Wilkening, J., Kapaj, A., and Cron, J. (2019). Creating
a 3D Campus Routing Information System with
ArcGIS Indoors. In German Society for Photogram-
metry, Remote Sensing and Geoinformation, 39st
Conference. Thomas P. Kersten. https://www.dgpf.de/
src/tagung/jt2019/proceedings/proceedings/papers/
11 3LT2019 Wilkening et al.pdf.
Wilkening, J., Schaeffner, R., and Staub, T. (2018). Interac-
tive 3D route planner for the Campus Roentgenring in
Wuerzburg. volume 4, pages 35–41. AGIT Journal.
Zhou, Q., Park, J., and Koltun, V. (2018). Open3D: A Mod-
ern Library for 3D Data Processing. CoRR.
3D Point Clouds in PostgreSQL/PostGIS for Applications in GIS and Geodesy
163
