
A Framework for Evaluating Business Process Performance
Wiem Khlif, Mariem Kchaou and Faiez Gargouri
Mir@cl Laboratory, University of Sfax, Sfax, Tunisia
Keywords: BPMN Model, Performance, Framework, Classification, Business Context, Social Context, Perspectives,
Temporal Measures, Cost Measures.
Abstract: Measuring the performance of business processes is an essential task that enables an organization to achieve
effective and efficient results. It is by measuring processes that data on their performance is provided, thus
showing the evolution of the organization in terms of its strategic objectives. To be efficient in such task,
organizations need a set of measures, thereby enabling them to support planning, inducing control and making
it possible to diagnose the current situation. Indeed, several researchers have defined specific measures for
assessing the business process (BP) performance. Our approach proposes new temporal and cost measures to
assess the performance of business process models. The aim of this paper is to classify the performance
measures proposed so far within a framework defined in terms of characteristics, design and temporal
perspectives, and to evaluate the performance of business process models. This framework uses business and
social contexts to improve particular measures. It helps the designer to select a subset of measures
corresponding to each perspective and to calculate and interpret their values in order to improve the
performance of their model.
1 INTRODUCTION
Performance is one of the major topics for
organizations seeking continuous improvements.
Evidently, evaluating the performance of business
process model is a necessary step to reduce time, cost
and to indicate whether the company goals are
successfully achieved or not. Obviously, the business
process performance is highly influenced by
decisions taken during the modelling phase. This
justifies the motivation of several researchers to
invest in finding solutions to define, manage and
evaluate the performance of a business process
model. The recent literature on the BP performance
measurement shows three trends of approaches: those
based on time, those centered on cost and those
combining the two aspects.
The first type of appraoches is based on indicators
and time patterns. Works that collect and analyze
performance related to Key Performance Indicators
(KPIs) are crucial to ensure consistent and continuous
process optimization (Del-Río-Ortega et al., 2016),
(Mendes and Santos, 2016), (Van der Aa et al.,
2017), (El Hadj Amor and Ghannouchi, 2017),
(Hompes et al., 2018). KPIs can be defined as
quantifiable measures that an organisation uses to
measure the performance in terms of meeting its
strategic and operational objectives.
In addition, several works are based on temporal
patterns (Kluza et al., 2016), (Lanz et al., 2016) to
evaluate the BP performance. It is by measuring
temporal aspect of processes that data on their
performance is provided (D'Ambrogio et al., 2016).
The second type of approaches use the cost factor,
(Wynn et al., 2013), (Kaplan and Cooper, 1988).
Certainly, all aspects of the business process that have
a monetary component are made part of the overall
cost structure. The allocation of costs with different
products or services lead the manager to a decision
based on false information (Wynn et al., 2013).
The third type integrate the cost and time aspects
to evaluate the performance of business process
(Araújo et al., 2016), (Kis et al., 2017). In this
approach type, time and cost are fully inter-related.
Naturally, the amount of time required to perform
activities will be directly related to the amount of
resources allocated to the business process (cost).
However, the so-far proposed approaches neglect
the organizational aspects of a business process
model, expressed by social relationships,
collaborative behaviors among actors and their
Khlif, W., Kchaou, M. and Gargouri, F.
A Framework for Evaluating Business Process Performance.
DOI: 10.5220/0007841403710383
In Proceedings of the 14th International Conference on Software Technologies (ICSOFT 2019), pages 371-383
ISBN: 978-989-758-379-7
Copyright
c
2019 by SCITEPRESS – Science and Technology Publications, Lda. All rights reserved
371

features such as availability and suitability which
affect the overall process performance.
We recall that an actor can be represented as a
performers or business role who realizes a business
activity.
In addition, they neglect temporal and cost aspects
related to BPMN elements such as gateway, sequence
flow, lane, Pool). The lack of these information may
reduce the scope of possible analyses that can be
made.
Our objective in this paper, is to show how to
apply the correlated temporal (i.e., time lag between
two activities, etc.), cost and organizational aspects
(ie. Performance, availability, suitability of an actor,
relation type with other actors, etc.), to evaluate the
business process performance models specified in the
Business Process Model and Notation (BPMN).
To end this purpose, we propose new performance
measures representing cost and temporal aspects.
Since the diversity of measures, we propose a
framework for classifying them. Our measure
classification is based on business process model
perspectives (e.g., informational, functional,
organizational, behavioral and temporal), and the
elements (activity, event …) involved in computing
the measures.
One advantage of our classification is that it
provides for a better usage of the perfomance
measures: 1) Depending on his/her perspective, a
designer would be examining only a subset of
performance measures pertinent to his/her point of
view. In addition, the measures are defined in terms
of BPMN elements and social context (ie., actor) that
he/she is interested in. 2) Based on the obtained
measures values, the desiginer decision is made. He
knows the impact of his decision on other measures
dealing with other perspectives; the business process
model elements involved in the examined measure
provides for traceability among the various
perspectives.
A second advantge of our classfication, is the
genericity of the framework since it is expressed in
the BPMN standard notation.
The rest of this paper is organized as follows:
Section 2 presents an overview of the business
process performance measurement. Section 3,
proposes temporal and cost measures to evaluate the
performance of a business process model. These
measures are related to the social aspect (actors) and
the BPMN elements. Section 4 presents our
classification framework and illustrate it through an
example annotated by semantic and temporal
information that can provided by an expert or a
business designer. Finally, we conclude this paper
with a summary of the presented work and an outline
of its extensions.
2 RELATED WORK
In this section, we overview works on the
measurement of the BP performance. These works
are divided into three categories: Time based-
performance measurement, cost based-performance
measurement and works combining time and cost.
2.1 Time Based-performance
Measurement
The first category is classified in two work types:
Indicators based-performance measurement and
Patterns based-performance measurement.
2.1.1 Indicators Based-performance
Measurement
(Del-Río-Ortega et al., 2016) propose the Process
Performance Indicators meta-model (PPINOT) to
allow the modelling of the Process Performance
Indicators (PPIs). PPINOT support two different
types of resource-aware PPIs and shows the main
elements and the types of measure (Base, Derived and
Aggregated) that can be used to define a PPI. Table 2,
in Section 4.2.2, illustrates the performance
measures.
In (Van der Aa et al., 2017), the authors translate
the natural language PPI descriptions into Process
Performance Indicators (PPIs) according to a
structured notation.
(Mendes and Santos, 2016) identified the model
used for evaluating the performance of BP which best
fits the evaluation of the business processes, with a
view to a greater alignment between the indicators of
the process and the strategic objectives.
(Hompes et al., 2018) introduced a generic
approach to process performance analysis from event
data. Using event data, the authors compute the basic
performance measures defined on the states and
transitions of the artifact lifecycle models.
D'Ambrogio et al., (D'Ambrogio et al., 2016)
expressed how the model-driven techniques can be
applied to manage the performance properties. They
introduce the Performability-oriented BPMN
(PyBPMN), which can be used to annotate the BPMN
models with: i) the performance requirements, ii) the
results provided by the BP simulation-based analysis,
and iii) the measures taken at execution time, so as to
ICSOFT 2019 - 14th International Conference on Software Technologies
372

include in a single BPMN model all the data
associated to the performance properties.
To measure the performance of a business
process, (El Hadj Amor and Ghannouchi, 2017) used
an ontology based on a real business process to create
the semantic relationships between all key
Performance indicators (KPI), represented as
qualitative and quantitative indicators. After that,
they were based on data mining technique to extract
information from data measurement. In addition,
(Peral et al., 2017), analyzed the candidate KPIs
through data mining techniques to ensure that they
reflect the relationships identified during the business
strategy modeling.
In summary, all performance indicators defined in
(Del-Río-Ortega et al., 2016), (Hompes et al., 2018)
(El Hadj Amor and Ghannouchi, 2017) rely on the
remaining aspects related to the BPMN elements.
These works investigate the performance of the
business process based on techniques, template and
linguistic patterns. However, they don’t illustrate the
BP performance by using measures.
2.1.2 Time Patterns Based-performance
Measurement
Time Patterns are crucial for any enterprise to know
the temporal properties of its business processes.
These properties strongly affects the performance of
the business process execution. For example, Lanz et
al., (Lanz et al., 2016), identified 10 different time
patterns to support the selection of the appropriate
process-aware information systems (PAISs). They
are classified on 4 distinct categories: 1) Durations
and Time Lags, 2) Restricting Execution Times, 3)
Variability and 4) Recurrent Process Elements.
The first pattern category and time lags contains
three time patterns expressing the durations for
different kinds of process granularities: TP1: Time
lags between two activities, TP2: Duration and TP3:
Time lags between two arbitrary events.
The second category “Restricting Execution
Times” is composed of the following four patterns
that consist in restricting the execution times of an
activity or process (e.g., earliest start or latest
completion time): TP4: Fixed Date Element to
properly time the execution of activities and process
instances, TP5: Schedule Restricted Element to bind
the execution of an activity or process to an external
schedule, TP6: Time-based Restrictions to limit the
number of executions of an activity (process) within
a particular time frame and TP7: Validity Period to
restrict the lifetime of an activity or process.
The third pattern Variability is based on TP8:
Time-dependent Variability pattern which provides
the different control flow, depending on time aspects.
The fourth pattern Category Recurrent Process
Elements comprises TP9: Cyclicity elements pattern
and TP10: Periodicity.
Kluza et al., (Kluza et al., 2016), provide a short
overview of the selected temporal logics that specify
the time patterns in business process models.
Based on time patterns, we extract a set of
measures presented in Table 2. These measures focus
mainly on the temporal constraints related to the
following BPMN elements: activity and event.
However, they neglect gateway that is considered
important decision-making element, sequence flow
and lane/pool elements which have an impact on
assessing the business process performance.
2.2 Cost Based-performance
Measurement
(Wynn et al., 2013) propose a framework to support
management accounting decisions on cost control by
automatically incorporating cost information, from
annotation of event logs for monitoring, predicting
and reporting process-related costs. The cost
information is related to the employee and activity
element.
(Sampathkumaran and Wirsing, 2013) propose a
methodology for cost calculation by dividing a
business process into patterns. A cost and reliability
factor for each of these patterns is calculated based on
the cost of the BPMN elements.
(Kaplan and Cooper, 1988) proposed an activity-
based-costing (ABC) which emphasises on the per
(activity) unit cost of all possible activities. However,
the ABC technique requires a substantial effort to
implement and to be kept up-to-date.
(Gupta and Galloway, 2003) defined a conceptual
proposal for the use of ABC and its variation ABM
(Activity-Based Management), in order to improve
the decision-making operations. ABM is the way in
which an entity can drive, measure and control the
aim to improve their performance.
Nevertheless, there is no work that combines the
cost of all BPMN elements with the actors.
2.3 Cost and Time Aspects
Based-performance Measurement
Cost represents the expenses of a business process
required for its execution. For example, (Korherr
2007) presented a metamodel with its extension to
integrate the business process goals and the
A Framework for Evaluating Business Process Performance
373

performance measures into BPMN modelling
language. The extension offers the goals a business
process must achieve, as well as an incorporation of
the performance measures time cost, and quality.
(Araújo et al., 2016) calculate the cost of idleness
and implementation of the TDABC (Time-Driven
Activity-Based Costing) to support the development
of a costing system for public universities.
Kis et al., (Kis et al., 2017) provided a framework
on how the four dimensions of the devil's quadrangle
(time, cost, quality and flexibility) can be measured
by using log data generated by a process engine.
The presented works ignore the organizational
aspects of a business process model expressed by
social relationships, collaborative behaviors among
actors and their features determined in terms of
availability, suitability, etc. Our proposed method
combines both aspects to cover all BPMN concepts,
the organizational and the social aspects in order to
improve the performance of a business process
model.
3 MEASURES FOR BUSINESS
PROCESS PERFORMANCE
In this section, we propose performance measures
related to actors and to BPMN elements (gateway,
activity, sequence flows and lane/Pool). We note that
an actor represents the performers or organizational
units. These measures are classified into temporal and
cost measures.
3.1 Measures for Actor
We propose the following measures related to the
actor element. They express the cost and the temporal
aspects.
Shift Time of an Actor to Perform an Activity
(ShT
Act
(A)): a period where an actor is scheduled
(planified) to perform an Activity.
Actor’s BReaks When he Performs an Activity
(BR
Act
(A)): unproductive time where the actor is
scheduled not to work. A scheduled time when
workers stop working for a brief period.
Stop Time of an Actor When he Performs an
Activity (ST
Act
(A)): the time where the actor was
intended to work but was not due to unplanned
stops (breakdowns) or planned stops
(changeovers).
Ideal Cycle Time of an Actor to Perform an
Activity (ICT
Act
(A)): Theoretical minimum time
to perform an activity by an actor.
Total Number of Good Activities Performed by an
Actor per Day (TGADay
Act
): expresses the
number of performed activities by an actor that
terminate correctly in a day.
m
act
i=1
TGADay =
i
GA
(1)
Where m is the number of good activities (GA
i
)
produced by an actor.
A high number of good activities performed by an
actor expresses a high suitability and availability,
which depends on its capacity because an actor is
available if he is able to provide the needed capacity
at the required unit of time.
Total Number of Defected Activities Performed by
an Actor per Day (TDADay
Act
): determines the
number of activities performed by an actor (Act)
in a day and that represent the failures due to
internal errors or wrong user input in a specific
period of time, detected faults, etc.
n
Act
j=1
TDADay =
i
DA
(2)
Where n is the number of defected activities (DA
j
)
produced by an actor.
The more defected activities registered for a
specific period of time, the worse the process
performed in terms of technical quality. This
increases the fault tolerance and decreases the
performance of an actor, his availability, and
suitability.
Total Number of Activities Processed by an Actor
per Day (TADay
Act
): includes the well performed
activities and the defected ones.
TDADay
+
TGADay
=
TADay
ActActAct
(3)
Ratio of Defected Activities by an Actor per day
(RDA
Act
): is calculated by the Total Number of
Defected Activities performed by an actor divided
by the Total number of Activities performed by
the same actor.
ayTAD
TDADay
=
RDA
Act
Act
Act
(4)
Ratio of Good Activities Performed by an Actor
(RGA
Act
): is calculated by the Total Number of
Good Activities realized by an actor in a day
divided by the Total number of Activities
performed by the same actor in one day.
ayTAD
TGADay
=
RGA
Act
Act
Act
(5)
A high ratio value of good activities performed by an
actor expresses a high actor’s suitability and
availability. This reduces the cost and reflects a good
ICSOFT 2019 - 14th International Conference on Software Technologies
374

reliability of the activity.
Planned Production Time of an Actor to Perform
an Activity (PPT
Act
(A)): the total time that an actor
is expected to produce. It is calculated by
subtracting the schedule loss from all time. So
first, exclude any Shift Time where there is no
intention of running production (typically
Breaks).
( ) ( ) ( )
ABR_AShT=APPT
ActActAct
(6)
Working Time Spent by an Actor to Perform an
Activity (WT
Act
(A)): It corresponds to the run time
which is simply calculated by the difference
between the Planned Production Time and Stop
Time.
( ) ( ) ( )
AST_APPT=AWT
ActActAct
(7)
Total Working Time Spent by an Actor in a Lane
per Day (TWTDay
Act
(L)): the sum of working
time spent, in a day, by an actor in the
corresponding lane.
Act
1
( ) = ( )
f
Act p
p
L WT A
TWTDay
(8)
Where f is the number of activities in a lane performed
by an actor.
Total Working Time Spent by an Actor in the
whole Process per Day (TWTDay
Act
(P)) : the sum
of working time spent by an actor in all lanes in
the process.
Act
1
( ) =
q
Act k
k
P TWTDay L
TWTDay
(9)
Where k is the number of lanes in the process.
Percentage of an Actor Time Contribution in a
Lane per Day (PTC
Act
(L)): it represents the
proportion of the working time spent per day by
an actor in a lane (L) and the total working time
of the same actor in all the process P.
Act
PTC L = *100
Act
Act
TWTDay L
TWTDay P
(10)
A high percentage value of an actor time contribution
represents that the actor is suitable and available to
accomplish his work. This increases his performance.
Availability of an Actor in a Day (AVDay
Act
):
represents the capability of the actor to be able to
perform the activity in the required unit of time. It
is calculated as the ratio of Working Time spent
by an actor on a day to Planned Production Time.
PPTDay
WTDayT
=
AVDay
Act
Act
Act
(11)
A high value of AVDay indicates that the production
of an actor is important and he is able to provide the
needed capacity at the required time. This increases
his suitability and the performance per day.
Performance of an Actor per Day (PerDay
Act
): It
expresses how fast the actor’s work? In addition,
it represents all elements that causes the process
to operate at less than the maximum possible
speed, when running. It compares the working
Time spent by an actor per day to the Ideal Cycle
Time.
Act
Act
Act
Day
=
Day
Day
TWT
Per
ICT
(12)
The best value of the performance is equal to 1. It
indicates that the actor has a high speed of production,
that is always available and that he is suitable to
perform the assigned tasks.
Cost of an Actor in a Lane per Day
(CosDay
act
(L)): is calculated by the product of the
total working time spent by an Actor in a Lane per
Day (TbWTDay
Act
(L)) and its actual Labour
Costs per Hour (LCH
Act
).
LCH
*)L(
TWTDay
=)L(
CosDay
Act
ActAct
(13)
Percentage of the actor’s Cost in a Lane per day
(PCos
Act
(L)): represents the proportion of the
actor cost in a Lane per Day and the lane cost per
Day.
Act
Act
()
Day
( ) = *100
Day( )
L
Cos
L
PCos
Cos L
(14)
A high cost percentage of the actor expresses that he
is very expensive for the organization. This can be
due to the fact that the actor is not suitable to
accomplish tasks.
As the same, Formula 13 and 14 can be applied to
the pool.
3.2 Measures for the Activity Element
We propose to complete the temporal measures
related to the activity presented in the literature (Lanz
et al., 2016) (e.g., Activity Duration (AD)) by those
focusing on the cost and the activity reliability.
Cost of an Activity realized by an actor (CA
Act
): is
calculated by the product of the actor’s actual
Labour Costs per Hour and the working time spent
by an Actor to perform an Activity.
)A(
WT
*
LCH
=
CA
ActActAct
(15)
It is important to note that an increase of the activity
cost has an impact on the lane cost and the entire
organization.
Ideal Cost of an Activity realized by an actor
(ICA
Act
): is calculated by the product of the
A Framework for Evaluating Business Process Performance
375

actor’s actual Labour Costs per Hour and Ideal
Cycle Time of an Actor to perform an Activity.
)A(
ICT
*
LCH
=
ICA
ActActAct
(16)
Difference between Cost of an Activity realized
by an actor and Ideal Cost of an Activity realized
by an actor (DCIC
Act
).
Act Act Act
=
DCIC CA ICA
(17)
The high difference expresses that the actor cost is
expensive and the required time to accomplish the
activity is high. In fact, the actor is not the most
appropriate one to perform the activity.
Number of Detected Faults in an activity
performed by an actor in a period of time
(NDFA
Act
).
A high number of detected faults has a negative
impact on the reliability of the activity. Besides, it
reflects that the actor has not the skills to perform this
activity.
Number of Error Event (NEE) that can appear in
an activity in a period of time.
We note that, the low number of errors minimizes the
necessary time to accomplish an activity and
consequently, reduces the cost of an activity.
3.3 Performance Measures for
Gateway/Sequence Flow Elements
Table 1: Performance measures related to the gateway and
sequence flow elements.
Temporal measures
Pattern
category
Time patterns
Measures
Duration and time lags
TP2 : Duration
Sequence Flow
SeqFD: Sequence Flow Duration
represents the transfer time between
BPMN elements (activity, gateway
and event).
SeqFD=
ST(BPMN element
i+1
)–
ET(BPMN element
i
) where
ST: Start Time
ET End Time
SeqFSD : Sequence Flow Set
Duration
1
w
u
u
SeqFSD SeqFD
where w: the total number of
sequence flows and SeqFD
u
is the
duration of a sequence flow u
Gateway
GD: Gateway Duration
GD=ETG-STG Where:
ETG: End Time of a Gateway
STG: Start Time of a Gateway
GSD : Gateways Set Duration
1
y
i
i
GSD GD
where y: the total number of
gateways and GD
i
is the duration of a
gateway i
TP : Time lags
Time lags between
two gateways
DSTG : Difference between Start
Time of different Gateways
DSTG = STG(G1)-STG(G2)
DETG : Difference between End
Time of different Gateways
DETG= ETG(G1)-ETG(G2)
Time lags
between
a gateway and an
activity
DSTASTG : Difference between
Start Time of an Activity (STA) and
Start Time of a Gateway
DSTGSTA = STA-STG
DETAETG : Difference between End
Time of an Activity (ETA) and End
Time of a Gateway
DETGETA = ETA-ETG
Time lags between a
gateway and an event
DETGETE : Difference between End
Time of a Gateway and End Time of
an Event (ETE)
DETGETE = ETG-ETE
DSTGSTE : Difference between Start
Time of a Gateway and Start Time of
an Event
DSTGSTE = STG-STE
Restricting Execution Times
for a gateway
TP4: Fixed
Date
Elements
FDG : Fixed Date of a Gateway
TP6 : Time
based
restriction
NGTP : Number of Gateways
executed per Time Period
TP7 :
Validity
period
MinTVG : Minimal Time Validity of
a Gateway
MaxTVG : Maximal Time Validity
of a Gateway
VPG : Validity Period of a Gateway
VPG = MaxTVG – MinTVG
Cost measures
Gateway
Cost of a Gateway (CosGat
Act
): the
product of the gateway duration and
the actor’s actual Labour Costs per
Hour (LCH
Act
).
Act Act
=*GD
CosGat LCH
Sequence flow
Cost of a sequence flow: (CosSeqF
Act
): the product of the Sequence
Flow Duration (SeqFD) and the
actor’s actual Labour Costs per Hour
(LCH
Act
).
Act
Act
=*
CosSeqF SeqFD
LCH
Table 1 presents the proposed measures for gateway
and sequence flow elements that concern the temporal
and the cost aspects. Temporal measures related to the
gateway and sequence flows are classified, based on
the time patterns presented in Lanz et al., (Lanz et al.,
2016). We note that splitting gateways usually do no
take time because represents a decision. On the other
hand, merging gateways may took time for example
when we are dealing with parallel join gateway since
previous activities must end to the process continues.
Sequence flow duration represents also the time lags
(difference) between the start of an element i+1 and
the end of an element i. Cost measures reflects the
cost needed to perform the gateway and sequence
flow elements.
A high value of the time lags between a gateway
and a BPMN element (activity, event, and gateway)
increases the transfer time. This has a negative impact
on the duration of the whole process.
Besides, a high duration of a gateway or sequence
flow makes its cost more expensive and increases the
cost of the process.
ICSOFT 2019 - 14th International Conference on Software Technologies
376

3.4 Performance Measures for
Lane/Pool Element
This section presents the measures for Lane/Pool
elements. They aim to evaluate the time and the cost
of the whole process.
Lane Duration (LD): the sum of the needed time
to carry out all BPMN elements in a lane.
1 1 1
=
b g p e
a h o d
LD AD SeqFD GD ED
(18)
Where b is the number of activities, g is the
number of sequence flows, p is the number of
gateways and e is the number of events in a
lane.
Pool Duration (PD): It is calculated by the sum of
lanes duration in the process.
1
=
v
l
l
PD LD
(19)
Where l is the number of lanes in a process.
A high duration has a negative impact on the time
behavior and leads to an expensive cost of the whole
process.
Cost of a Lane per Day (CosDay(L)): determines
the cost of all BPMN elements in a Lane per Day.
It includes the cost of transfer time between them.
1 1 1 1
( ) =
y t c r
Act Act
w x e i
CosDay L CA CosSeqF CosGat CosEv
(20)
Where y is the number of activities, t is the number of
sequence flows, c is the number of gateways and r is
the number of events in a lane.
The shorter is the BPMN elements duration, the
more the cost of a lane is reduced. Formula 20 can be
also applied to the pool.
4 A PERFORMANCE
FRAMEWORK FOR BPMN
MODEL
In our previous work, we annotated a BPMN model
by using the context concept (Khlif et al., 2017) as a
means to encapsulate the semantic information
pertinent to the business logic and the organizational
aspect. (Khlif et al., 2017) defined the context by
assimilating a business process P to an undirected
graph G
P
= (V, E) where V is the non-empty set of
nodes representing elements of P such as pools, lanes,
activities, gateways and events, etc. E ⊆ V × V is the
set of edges linking the nodes V. Let F
V
be the set of
features describing each node individually. A context
P
C
is defined as the set of all instances derived from
the set F
v
. From this generic definition, the authors
derive two instances of context: social context and
business context. The social context CS
P
of a process
P instantiates the C
P
context where V is the set of
actors and F
v
expresses their characteristics. The
business context of a business process places the
social context in the organizational aspect and
completes it with semantic information related to
organizational, functional and informational
perspectives (Khlif et al., 2017).
To define our framework and since the presented
definition neglect the temporal constraints, the
temporal perspective and the cost that are useful to
annotate our BPMN model, we propose in this paper
to enrich as follows the context definitions of a
business process:
4.1 Enriched Context Definitions of a
Business Process
We extend the social context by additional properties
related to actor that can improve the performance of
a business process such as his availability (AV
act
), his
SuiTability (ST
act
), his performance to realize
activities, etc. Furthermore, we extend the business
context using semantic information related to the
behavioral and temporal perspectives. The temporal
perspective includes the temporal constraints related
to the social aspect (Actors), and associated to
different BPMN elements (activities, lanes, pools,
gateway, etc.). More precisely, the business context
of a business process P covers the following semantic
information:
4.1.1 Semantics of Organizational and
Temporal Perspectives
The organizational perspective which places the
social context within the enterprise represents
"Where" and by "whom" the business process
activities are performed. The main BPMN concepts
that reflect the organizational perspective are "Pool"
and "Lane". In particular, the context is associated to
the lane and pool elements. It describes the following
information: Lane ID and label, pool ID and label, the
list of actors affiliated with the lane, permission and
role assignments, and the hierarchical roles among
the actors (Khlif et al., 2017). Recall that a
hierarchical roles indicate partial ordering on roles.
Roles are partially ordered to reflect the
organizational hierarchy. Therefore, for two roles r
and r', r
r′ implies that permissions that exist within
r′ are subsumed by those in r (Khlif et al., 2017).
We extend the business context in the
organizational perspective by the following
A Framework for Evaluating Business Process Performance
377

information that integrate also the temporal
perspective:
Cooperation Roles: expresses that the actors have
the same position (the same roles and
permissions).
Actor’s Availability: is the capability of the actor
to perform an activity in the required unit of time.
Actor’s Suitability: represents the capability of the
actor to perform the activity well.
Shift Time of an Actor: a period of time where an
actor is scheduled to perform a task.
Actor’s Break: a scheduled time when the actor
stop working for a brief period.
Stop Time of an Actor: a passage of time where
the actor stops temporarily since unplanned stops
(breakdowns) or planned stops (changeovers).
Ideal Cycle Time of an Actor: the minimum period
when an actor performs the activity.
Planned Production Time of an Actor: a period of
time that an actor is expected to perform an
activity.
Working Time Spent by an Actor: represents the
duration that an actor performs an activity.
Performance of an Actor: represents the
percentage of all elements that permit the process
to operate at less than the maximum possible
speed, when the actor performs the activity.
Contribution of an Actor in a Lane: indicates how
the working time spent by an actor in a lane affects
total working time of the same actor in all the
process.
Actor Cost: Cost of an actor when he perform an
activity.
4.1.2 Semantics based on Functional and
Temporal Perspectives
Activity node is the main concept in the functional
perspective. It is documented with the following
context information: the unique activity identifier
(ID), its lane, the ID of the actor responsible of
performing it, the IDs of the activities on which it
directly depends (before and after), the dependency
type (authorization, coordination, or resource
dependency), and his required objects which can be
either shared or private (Khlif et al., 2017).
We extend this annotation by the following
temporal and semantic information:
Performance Duration: is a pair (Start Time, End
Time) that denotes respectively the starting and
finishing time of an activity.
Time Lags between Activities: it expresses the
transfer time between activities.
Validity Period of an Activity: Allows to
restrict the lifetime of an activity or a process.
Activity Cost: Cost needed to accomplish an
activity
IsDefected: verifies if the activity is defected
IsGood: verifies is the activity that is well
performed.
4.1.3 Semantics based on Informational and
Temporal Perspectives
Since the informational perspective is represented in
terms of data and events, the resources needed by an
activity express the semantic information that related
to this perspective (Khlif et al., 2017). We extend the
business context in the informational perspective, by
those expressing temporal and cost information:
Time Date of an Event: specifies a fixed date when
trigger will be fired.
Time Duration of an Event: specifies how long the
timer should run before it is fired.
Time Lags between Two Events: specifies the time
lags between two arbitrary events.
Event Cost: the cost of sending/receiving an event.
4.1.4 Semantics based on Behavioural and
Temporal Perspectives
We define the business context associated to the
gateway and sequence flow elements. We suppose
that the gateway and sequence flow nodes in a
business process model are documented with the
following context information: Unique identifier of
the gateway (ID
G
)/sequence flow (ID
SeqF)
, their labels,
their duration and costs. Note that the gateway can be
also expressed by the time lags between it and other
BPMN element (gateway, activity and event)
expressing the transfer time between them.
4.2 Classification Framework
Due to the fact that no consensual classification exists
for the multiple measures proposed, this complicates
their exploitation. Thus, in this section, we propose a
classification framework for performance measures
to facilitate their use in the evaluation of the business
process performance. It should be noted that the
existing measures in the literature and those we have
proposed adhere to this classification.
4.2.1 Framework Architecture
The measure classification framework is given in
Figure 1. A "BPMN model" is represented as a
"Graph" which is composed of "Nodes" and "Arcs".
ICSOFT 2019 - 14th International Conference on Software Technologies
378

The "Graph" has an "Abstract Context". Both
"Business Context" and "Social Context" are viewed
as an instantiation of the context concept. "Business
Context" is related to the "Flow Element" and "Social
Context" concerns the "Actor" node.
Our classification framework is organized in three
levels. The first level expresses that a measure can be
temporal or representing the cost. They concerns the
following nodes: flow element(s) and actor.
In order to determine the scope of each temporal
(respectively cost) measure, we introduced the
"FlowElement" class whose instances are the BPMN
concepts (i.e., gateway, event, lane, activity and
sequence flow). The association "concerns"
establishes a link between the "Temporal Measures
related to BPMN elements" (respectively "Cost
measures related to BPMN elements") and
"FlowElement". The latter provides an indication of
the BPMN elements involved in the measurement.
For example, the measure AD (Activity Duration)
and CA
Act
(Cost of an Activity realized by an Actor)
have as scope the basic element "Activity".
In addition, we introduce the "Actor" class. The
links "Associated to" and "Concerns" relate the latter
to respectively "Temporal Measures related to Actor"
and "Cost Measures related to Actor" classes. These
links provide indications about the temporal and cost
features involved in the measurement. We note that
"Actor" and "FlowElement" classes have temporal
constraints. The association between these classes,
and the "Temporal Constraint" class indicates
temporal dependencies.
The second level associates for each category a set
of measures that are classified into perspectives:
functional, organizational, behavioral, informational,
and temporal.
The association between the "Measures" class and
the "Perspective" class, presented in Figure 1,
establishes a link between each measure and the
perspective(s) in which it can be calculated. From a
perspective, a set of the related measures represents a
quantitative view of this perspective. Using this
classification, our framework helps the designer to
select an appropriate subset of measures associated to
the corresponding perspective.
We classify at the last level the temporal and cost
measures on base, derived and aggregated. A measure
is characterized by its name, calculation formula and
a "type" attribute that indicates whether the measure
is base, derived and aggregated. A base measure
provides a direct idea on the temporal or cost aspects
of one BPMN element or an actor, and on the
interpretation of the measure value, while a derived
measure is defined as a mathematical function over
one or more measure. An aggregated measure
aggregates one single measure using an aggregation
function (i.e., sum or average).
Each characteristic is composed of a set of sub
characteristics. Based on our classification, the
association "informs about" links the class "Measure”
to the class "Characteristic". It states that each
Measure is associated to one or more (sub) quality
characteristics (Bocciarelli et al., 2014), (D'Ambrogio
et al., 2016) on reliability, performance efficiency and
cost characteristics.
In (Heinrich and Paech, 2010), the first
characteristic performance efficiency is defined by
the capability of the BPMN element to provide an
appropriate performance, relative to the amount of
resources and the time used, under stated conditions.
It is shown by the sub characteristics time behavior
and resource utilization.
Time behavior is defined as the appropriate
transport time between different BPMN elements and
processing times when executed. For instance, we
associate Time Lags between two start activities
(STASTA: Start Time of the first Activity and Start
Time of the second Activity) (Lanz et al., 2016) to
this sub characteristic.
Resource utilization represents the capability of
the BPMN element to use appropriate amounts and
the types of resources when executed under stated
conditions. For instance, we associate the measure
"the list of actors that perform an activity" (Del-Rio-
Ortega et al., 2016) to this sub-characteristic.
The second characteristic reliability is determined
by the capability of the activity to maintain a specified
level of performance when used under specified
conditions (Heinrich and Paech, 2010). It is revealed
by the sub characteristics Maturity and fault
tolerance. Maturity is the capability of the activity to
avoid failure as a result of faults in the activity. For
instance, we associate to this sub characteristic, the
Number of Detected Faults in an activity performed
by an actor per day (NDFA
Act
).
Fault tolerance is the capability of the activity to
maintain a specified level of performance in cases of
faults. We quote for example the measure Number of
Error Event (NEE) in an activity per day.
The third characteristic cost is expressed as a price
or monetary value associated to BPMN element or
actor in a period of time. The association
"notifiesAbout" links the classes "Flow Element" and
"Actor" to the "Cost" class. For instance, we associate
Cost of an actor in a Lane per Day (CosDayact(L)) to
this sub characteristic.
A Framework for Evaluating Business Process Performance
379
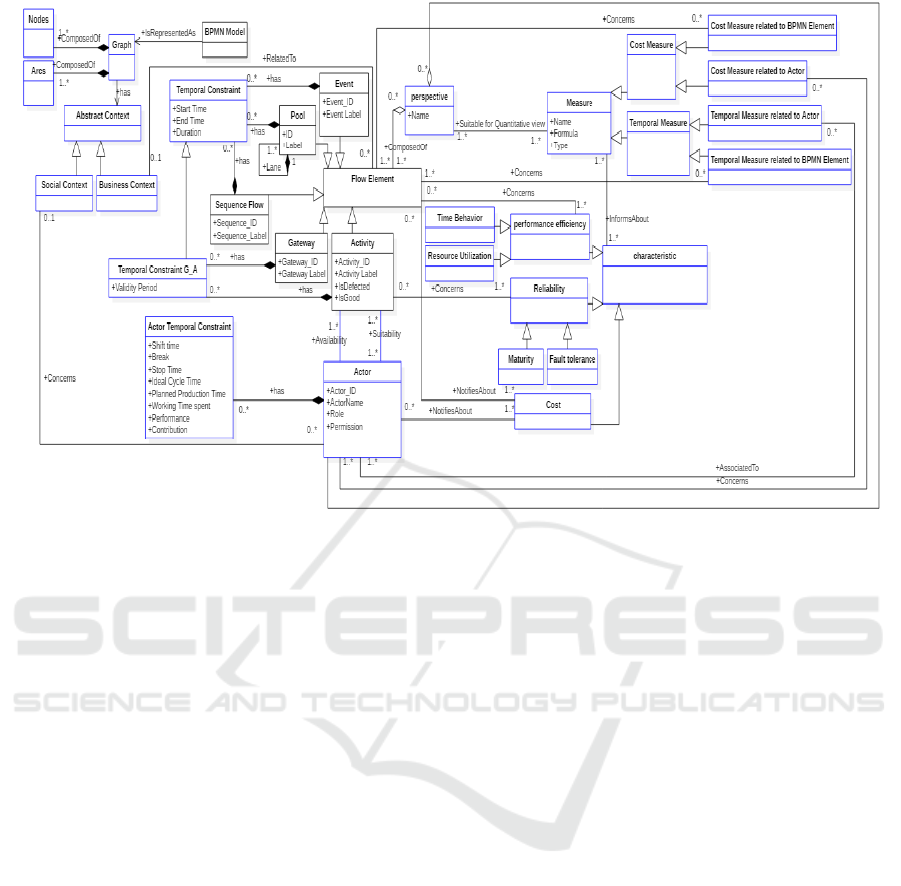
Figure 1: Classification framework.
The availability and suitability are considered as
characteristics which capture attributes and measures
related to the actor performance. Note that the actor
characteristics differ from the BPMN element
characteristics. Thus, we do not treat actor as an
activity. Availability is the capability of the actor to
be able to perform the activity in the required unit of
time. In fact, we propose the availability measure of
an actor (AVDay
act
).
Suitability focuses on actor skills that cover his
qualification, expertise, social competence, skills,
motivation and performance ability. This aspect
focuses on the extent to which all of the elements of
an actor performance are intentionally and
specifically addressed and appropriately configured
to accomplish the desired organizational outcomes.
4.2.2 Applicative Example
In order to illustrate the classified measures, we use
the "Travel agency Process" example modelled with
BPMN in Figure 2. The model is annotated by
temporal constraints and semantic information (cost
and organizational aspects) that help analysis to
evaluate the BP performance.
For instance, we suppose that three actors ("Ali",
"Salah" and "Sami") are affiliated to "Management of
Car/bus" lane, while two actors having the same
position ("Omar" and "Olfa") work in the
"Reservation Management" lane.
In the "Management of Car/bus" lane, "Ali" is the
leader of "Sami" and "Salah". So, the permission
attributed to "Sami" and "Salah" is also attributed to
"Ali". "Sami" starts performing the task "Rent cars to
customer" on Monday at 11:12 and he completes it at
11:42. Its duration is equal to 30 minutes. Since "Ali"
is available on Monday at 10:40, and he can start the
"Rent cars to customer" task before "Sami", the
designer could affect it to "Ali". In addition, the latter
can perform this task in a reduced laps of time
(WT=20 mn) since he is the leader and he has more
skills (suitability of Ali=1) than "Sami".
Consequently, he is more suitable to perform the
"Rent cars to customer" task. In this case, "Ali"
reduces the behavior time and the cost characteristics.
In the "Reservation Management" lane, "Omar"
performs on Monday six tasks "create reservation",
"determine date of rented and returned car", "check
car availability", "cancel reservation", "validate
reservation" and "establish payment". All the tasks
are well performed except for the "check car
availability" which is a defected one. In fact, the ratio
of good (respectively defected) tasks performed by
Omar is equal to RGA
Omar
=83.3% (respectively
RDA
Omar
=16.7%). Certainly, a high ratio value of
good tasks performed by Omar expresses his
suitability. It reduces the task cost and reflects a good
reliability of this task.
ICSOFT 2019 - 14th International Conference on Software Technologies
380
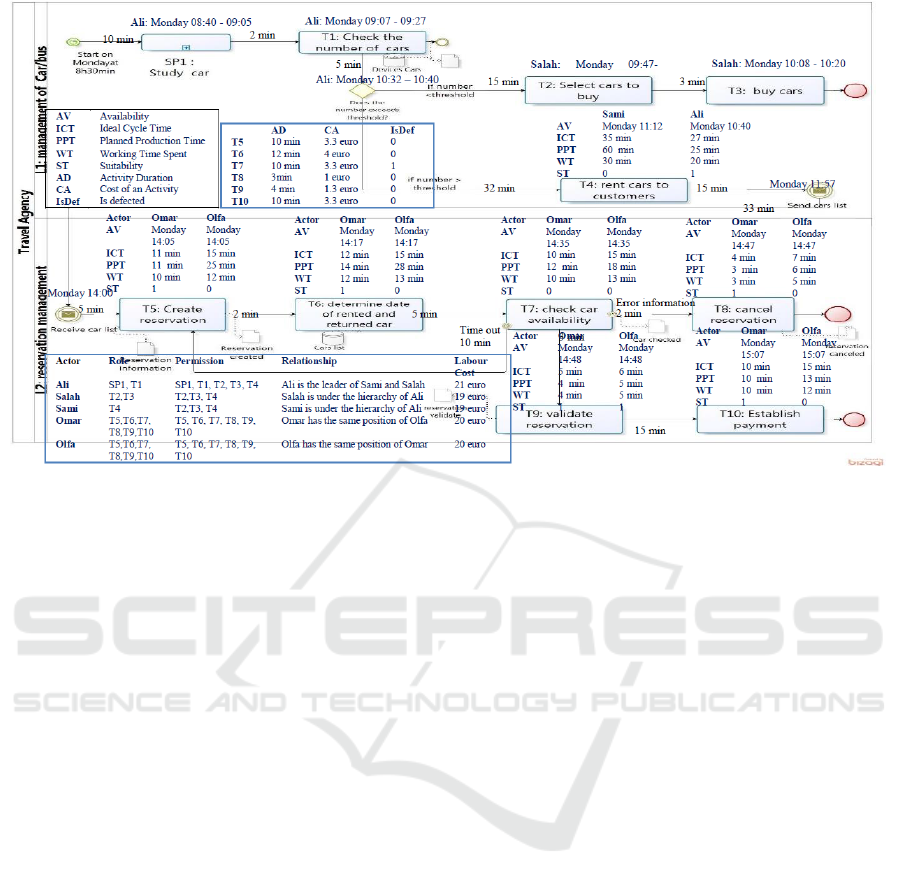
Figure 2: Travel Agency process example.
Furthermore, we note that "Omar" should work 6
hours per day (TWTDay
Omar
=6 hours). He required
one hour to perform one instance of all tasks in lane
2. In fact, his total working time is 6 hours per day
((WT
T5
+ WT
T6
+ WT
T7
+ WT
T8
+ WT
T9
+ WT
T10
)*6)
while his planned production time is 6 hours 30
minutes ((PPT
T5
+ PPT
T6
+ PPT
T7
+ PPT
T8
+ PPT
T9
+
PPT
T10
)*6). This expresses that the availability of
Omar is TWTDay
Omar
/ PPTDay
Omar
= 92.3% and he is
capable to perform his job in the required unit of time.
Based on Figure 2, the ideal cycle time per day of
"Omar" to perform the tasks is equal to 6 hours 18
minutes ((ICT
T5
+ ICT
T6
+ ICT
T7
+ ICT
T8
+ ICT
T9
+
ICT
T10
)*6). Comparing the working time to the ideal
one, allow to calculate his performance which is equal
to 95%. The obtained value indicates that "Omar" has
a high production speed. Furthermore, although
"Omar" and "Olfa" have the same position, the former
can perform the "Create reservation" task on 10
minutes, while "Olfa" requires 12 minutes. We
explain this by the fact that "Omar" has more skills
(Suitability ST
Omar
=1) than "Olfa" (ST
Olfa
=0).
Certainly, reducing the activity duration improves the
time behavior and the cost by decreasing the
execution time of the whole process. Its cost is
calculated by the product of the actor’s actual Labour
Costs per Hour (LCH
Omar
=20 euro/hour) and the
working time spent by "Omar" to perform the "Create
reservation" (CA
Omar=
(20 euro/60)*10=3.3 euro). To
determine the cost of "Reservation Management"
lane, we calculate the sum of all BPMN elements cost
in this lane (14+16.3= 30.3 euro).
It is important to note, that the presented model
can be evaluated based on the obtained measures
values. In this case, several measures should be
minimized and others should be maximized to
improve the BP performance. The interpretation of
the performance measures gives an evaluation of the
business process performance. For instance, the
performance and availability measures of the actor
"Omar" in a day should be maximized to improve the
performance of the business process model. They
represent respectively high values (95% and 92.3%).
In addition, the ratio of defected activities performed
by "Omar" should be minimized to improve the
performance of the business process model. It
represents a low value (RDA
Omar
=16.7%). In our
case, based on the majority measure values, the
"Travel agency Process" model has a good
performance.
However, for a better evaluation, it is mandatory
to establish thresholds that reflect the optimal value
of each measure.
Table 2 shows the classification of the
performance measures in terms of all perspectives
and presents the values for our running example. The
symbol (*) indicates that the measure is derived and
the symbol (**) indicates that the measure is
aggregated. In this table, the sign - (minus) indicates
that the measure should be minimized to improve the
BP performance, while the plus sign + indicates that
the measure should be maximized.
A Framework for Evaluating Business Process Performance
381

Table 2: Classification of the performance measures.
Perspectives
Performance measures
Source
Characteristics related to
BPMN elements
Characteristics
related to actor
Value
Temporal Measures
Cost Measures
Performance
efficiency
Reliability
Cost
Actor
performance
Temporal
measures for
BPMN
elements
Temporal
measures
related to
actor
Cost
measures
for BPMN
elements
Cost measures
related to actor
Time
Behavior
Resource
Utilization
Maturity
Fault
tolerance
Availability
Suitability
Functional and
temporal
AD
*
: Activity
Duration
Lanz et
al., 2016
-
-
-
-
AD (T4:Rent car to
customers) = 11:42 –
11:12 = 30 minutes
CA
Act
*
:Cost
of an
Activity
-
-
-
-
-
-
CA
Omar
(Create
reservation) = 10
minutes * 20 euro/Hours
= 3,33 euro
NDFA
Act
**
:
Number of
Detected Faults
in an activity
per day
-
-
-
-
-
-
NDFA(Create
reservation)
Omar
=3
Informational
and temporal
NEE
**
: Number
of Error Event
per day
-
-
-
-
-
NEE(Check car
availability)
Omar
=2
Organizational and temporal
Business
Temporal
context
CosDay(L)
*
:Cost
of Lane per Day
-
-
-
-
-
CosDay(Reservation
Management)= 30.3
euro
Social Temporal context
LAADay
**
:
List of Actors
that perform
an Activity
per day
Del-Río-
Ortega et
al., 2016
-
-
-
LAADay (Validate
reservation)= 2 (Olfa
and Omar)
RGA
Act
*
:
Ratio of Good
Activities
performed by
an Actor
+
+
+
+
+
RGA
Omar
=5/6=83.3%
AVDay
act
*
:
Availability
of an actor
+
+
+
+
+
AVDay
Omar
= 6 hours / 6
hours and 30 minutes =
92.3%
PerDay
Act
*
:
Performance
of an actor
+
+
+
+
+
PerDay
omar
= 6 hours/ 6
hours 18 minutes =95%
CosDay
act
(L)
*
:
Cost of an actor
in a Lane per Day
-
-
-
-
CosDay
Omar
(Reservation
Management)= 6 hours
* 20 euro = 120 euro
Behavioural and
temporal
GD
*
: Gateway
Duration
-
-
GD (Number of cars?) =
10:40-10:32 = 8
minutes
CosGat
Act
*
:
Cost of a
Gateway
-
-
CosGat
Ali
= 5 minutes *
21 euro/hour = 2.8 euro
5 CONCLUSION
In this paper, we focused on improving the
performance of BPMN models. To end this purpose,
we first enriched the existing measures by proposing
a set of cost and temporal ones related to BPMN
elements and actors. These measures are based on
business and social contexts.
Since there is no consensual classification for the
multiple measures, we defined a framework for
classifying them. It facilitates their use in the
evaluation of the business process performance.
This classification framework is organized in
three levels. At the first level, the proposed measures
represent the cost and the temporal aspects. They
concern the BPMN element(s) and the Actor. At the
second level, for each category, we classified a set of
measures into perspectives. Thanks to this second
level, our framework helps the designer to select the
suitable subset of performance metrics dealing with
his/her perspective. At the third level, we classify
ICSOFT 2019 - 14th International Conference on Software Technologies
382

performance measures into base, derived and
aggregated. To illustrate our proposed framework, an
example as well as its validation on a real case study
in the "Travel Agency Process" is presented. It allows
to calculate and interpret the measures values in order
to improve the performance of the business process
model.
Our future work focuses on three main axes: 1)
integrate our classification within a toolset for
BPMN, 2) checking the proposed measures through
empirical studies and identify thresholds, and 3)
exploit the temporal and cost information to provide
for assistance during the refactoring/improvement of
a business process model in order to alert the designer
of potential impacts of their decisions upon the
various perspectives.
REFERENCES
Araújo, M., Filho, B. A. R, Gonçalves, R. F., 2016.
Business process management notation for a costing
model conception. In ICIEOM’9, International
Conference on Industrial Engineering and Industrial
Management, Aveiro, Portugal, pp. 244-251.
Bocciarelli, P., D'Ambrogio, A., Giglio, A., Paglia, E.,
2014. Simulation-based performance and reliability
analysis of business processes. In WSC’14,
International Winter Simulation Conference,
Savannah, GA, USA, pp. 3012-3023.
Del-Río-Ortega, A., Resinas, M., Durán, A., Ruiz Cortés, A.,
2016. Using templates and linguistic patterns to define
process performance indicators. In Enterprise IS’16,
International Journal of Enterprise Information Systems,
Volume 10, Num. 2, pp. 159-192.
D'Ambrogio, A., Paglia, E., Bocciarelli, P., Giglio,A.,
2016. Towards performance-oriented perfective
evolution of BPMN models. In SpringSim'16, 49th
International Conference on Spring Simulation Multi-
Conference, Pasadena, CA, USA, Volume 48, pp. 15.
El Hadj Amor, A. E., Ghannouchi, A. S., 2017. Towards
Managing Key Performance Indicators for Measuring
Business Process Performance. In EMCIS’17, 14th
Conference European, Mediterranean, and Middle
Eastern on Information System, Portugal, pp .579-591.
Gupta, M., Galloway, K., 2003. Activity-based
costing/management and its implications for operations
management. In International Journal of Technological
Innovation, Entrepreneurship and Technology
Management, Volume 23, pp. 131-138.
Heinrich, R., Paech, B., 2010. Defining the Quality of
Business Processes. In Modellierung’10, 4th
International Conference of Modellierung, Klagenfurt,
Austria, pp.133-148.
Hompes, Bart F. A., Van der Aalst, W. M. P., 2018.
Lifecycle-Based Process Performance Analysis. In
CoopIS, C&TC, and ODBASE’18, 17
th
International
Conference on Cooperative Information Systems,
Valletta, Malta, pp. 336-353.
Kaplan, R. S., Cooper, R., 1998. Cost and effect: using
integrated cost systems to drive profitability and
performance. Cambridge, MA, 1
st
edition Harvard
Business School Press.
Khlif, W., Ben-Abdallah, H., Elleuch Ben Ayed, N., 2017.
A methodology for the semantic and structural
restructuring of BPMN models. In International
Journal on Business Process Management, Volume 23,
pp. 16-46.
Kis, I., Bachhofner, S., Di Ciccio, C., Mendling, J., 2017.
Towards a Data-Driven Framework for Measuring
Process Performance. In BPMDS’17, 18
th
International
Conference on Enterprise, Business-Process and
Information Systems Modeling, Germany, pp. 3-18.
Kluza, K., Jobczyk, K., Wisniewski, P., Ligeza, A., 2016.
Overview of Time Issues with Temporal Logics for
Business Process Models. In FedCSIS’16, Federated
Conference on Computer Science and Information
Systems, Gdańsk, Poland, pp. 1115-1123.
Korherr, B., List, B., 2007. Extending the EPC and the
BPMN with Business Process Goals and Performance
Measures. In ICEIS’9, International Conference on
Enterprise Information Systems, Funchal, Madeira,
Portugal, pp. 287-294.
Lanz, A., Reichert, M., Weber, B., 2016. Process time
patterns: A formal foundation. In Inter. Journal of the
Information Systems, Volume 57, pp. 38-68.
Mendes, T., Santos, S., 2016. A Procedural Approach for
Evaluating the Performance of Business Processes
Based on a Model of Quantitative and Qualitative
Measurements. In ICEIS’16, 18
th
Inter. Conf. on
Enterprise Information Systems, Rome, pp. 515-534.
Peral, J., Maté, A., Marco, M., 2017. Application of Data
Mining techniques to identify relevant Key
Performance Indicators. In Inter. Journal of Computer
Standards & Interfaces, Volume 50, pp. 55-64.
Sampathkumaran, P. B., Wirsing, M., 2013. Financial
Evaluation and Optimization of Business. In Inter.
Journal of Information System Modeling and Design,
Volume 4, Number 2, pp. 91-120
Van der Aa, H., Leopold, H., Del-Río-Ortega, A., Resinas,
M., Reijers, H. A., 2017. Transforming unstructured
natural language descriptions into measurable process
performance indicators using Hidden Markov Models.
In International Journal of the Information Systems,
Volume 71, pp. 27-3.
Wynn, M. T., Low, W. Z., Nauta, W., 2013. A Framework
for Cost-Aware Process Management: Generation of
Accurate and Timely Management Accounting Cost
Reports. In APCCM’9, Asia-Pacific Conference on
Conceptual Modelling, Adelaide, Australia, pp. 79-88.
A Framework for Evaluating Business Process Performance
383
