
Predicting Students’ Performance in a Virtual Experience for Project
Management Learning
Ana Gonz
´
alez-Marcos
1
, Rub
´
en Olarte-Valent
´
ın
1
, Joaqu
´
ın Ordieres-Mer
´
e
2
and Fernando Alba-El
´
ıas
1
1
Department of Mechanical Engineering, Universidad de La Rioja,
c/ San Jos
´
e de Calasanz 31, 26004 Logro
˜
no, La Rioja, Spain
2
PMQ Research Group, ETSII, Universidad Polit
´
ecnica de Madrid, Jos
´
e Guti
´
errrez Abascal 2, 28006 Madrid, Spain
Keywords:
Educational Data Mining, Students’ Performance, Project Management, Higher Education.
Abstract:
This work presents a predictive analysis of the academic performance of students enrolled in project man-
agement courses in two different engineering degree programs. Data were gathered from a virtual learning
environment that was designed to support the specific needs of the proposed learning experience. The analyzed
data included individual attributes related to communication, time, resources, information and documentation
activity, as well as behavioral assessment. Also, students’ marks on two exams that took place during the first
half of the course were considered as input variables of the predictive models. Results obtained using several
regression and classification algorithms –support vector machines, random forests, and gradient boosted trees–
confirm the usefulness of Educational Data Mining to predict students’ performance. These models can be
used for early identification of weak students who will be at risk in order to take early actions to prevent these
students from failure.
1 INTRODUCTION
One way to meet the demands and recom-
mendations of the European Higher Education
Area (EHEA) regarding quality learning (Eu-
ropean Commission, 2013; European Commis-
sion/EACEA/Eurydice, 2014, 2015) is by predicting
students’ academic performance at early stages of the
course in order to identify weak students and thereby
taking early actions to prevent these weak students
from failure. Furthermore, this information would be
useful to promote the achievement of better results
and to better manage resources in higher education
institutions (Migu
´
eis et al., 2018).
Nowadays, many available educational environ-
ments, such as learning management systems (LMS),
massive open on-line courses (MOOC), social net-
works, forums, educational game environments or
virtual learning environments (VLE), provide a huge
amount of educational data that can be analyzed with
data mining techniques to extract meaningful knowl-
edge. When the data mining process uses the data
that come from an educational setting it is referred
to as Educational Data Mining (EDM) (Romero and
Ventura, 2013).
Some authors suggest several EDM subjects as be-
ing relevant (Castro et al., 2007):
• applications that assess students’ learning perfor-
mance,
• applications that provide course adaptation and
learning recommendations based on the student’s
learning behavior,
• approaches that evaluate learning material and ed-
ucational web-based courses,
• applications that provide feedback to teachers and
students in e-learning courses, and
• developments for the detection of atypical student
learning behaviors.
Most of the pioneer and older research (from 1993
to 1999) deals with predicting students’ performance.
In fact, there is a large body of studies on this topic
in educational journals and conferences. Although
seminal works date back several decades, new de-
velopments are highly relevant (Romero and Ventura,
2010). Current research is mainly concentrated on
the use of techniques such as classification, cluster-
ing, association rules, statistics and visualization to
predict, group, model, and monitor various learning
activities (Aldowah et al., 2019). Thus, it is possible
to find works concerned with identifying factors as-
sociated with students’ success, failure, and dropout
González-Marcos, A., Olarte-Valentín, R., Ordieres-Meré, J. and Alba-Elías, F.
Predicting Students’ Performance in a Virtual Experience for Project Management Learning.
DOI: 10.5220/0007843506650673
In Proceedings of the 11th International Conference on Computer Supported Education (CSEDU 2019), pages 665-673
ISBN: 978-989-758-367-4
Copyright
c
2019 by SCITEPRESS – Science and Technology Publications, Lda. All rights reserved
665

intention (Burgos et al., 2017; Marbouti et al., 2016;
M
´
arquez-Vera et al., 2016; Migu
´
eis et al., 2018),
supporting instructors in student modeling (Gaudioso
et al., 2009; Graf et al., 2007; Li et al., 2011), evalu-
ating learning material and curriculum improvements
(Campagni et al., 2015; Jiang et al., 2016), or under-
standing of the learning process by identifying, ex-
tracting and evaluating variables related to the stu-
dents’ characteristics or behaviors (Baradwaj and Pal,
2011).
A literature review shows that studies about pre-
dicting students’ performance address the problem
from different angles or perspectives: (1) success in
a specific course (Costa et al., 2017; Macfadyen and
Dawson, 2010; Romero et al., 2010; Strecht et al.,
2015), (2) academic performance at the end of a
semester (Mishra et al., 2014) or an academic year
(Hoffait and Schyns, 2017), and (3) academic perfor-
mance at the degree level (Aluko et al., 2016; Lauger-
man et al., 2015; Migu
´
eis et al., 2018).
In this particular application of EDM, we are in-
terested in gaining insight from data collected in the
VLE specifically developed to support project man-
agement teaching and learning (Gonz
´
alez-Marcos
et al., 2017). That is, the main goal of this work is to
predict students’ performance for early identification
of students at risk at course level. More specifically,
this work considers the problem of predicting the stu-
dents’ scores on the final exam (regression task) as
well as the problem of predicting if a student will pass
of fail the final exam (classification task). If such pre-
diction is possible, the information can be used to help
students to increase their competence level.
The organization of the remainder paper is as fol-
lows: Section 2 is dedicated to describe the experi-
mental set-up and methodology. Section 3 presents
the results for both regression and classification mod-
els. Finally, Section 4 discusses some general conclu-
sions and presents future work.
2 METHOD
Participants and Research Context
The data used in this study were collected during four
academic years at the University of La Rioja (UR),
Spain. More specifically, this work is focused on
project management courses that are taught in the
fourth-year of the Mechanical Engineering B.Sc. cur-
riculum and the first semester of the Industrial En-
gineering M.Sc. curriculum. Thus, the participants
in this study were 177 engineering students who were
enrolled in project management courses scheduled for
Table 1: Number of students by academic year and degree
program.
Academic
Year
Degree Program
TOTAL
B.Sc. M.Sc.
14/15 29 22 51
15/16 24 16 40
16/17 26 15 41
17/18 21 24 45
TOTAL 100 77 177
the fall semester (Table 1). Both courses are manda-
tory and were taught by the same faculty members.
All students in the same degree program followed
a common syllabus. The content for M.Sc. stu-
dents was aligned with project management, while the
B.Sc. curriculum was focused on project engineering.
Regarding the practical activities, M.Sc. and B.Sc.
students were mixed and organized in two teams
to develop the same real-world engineering project.
That is, students were situated in a project develop-
ment process as described in Gonz
´
alez-Marcos et al.
(2016, 2019). In summary, the goal of each project
team was to provide the client (the instructors team)
with a functional and complete project that satisfied
the needs and specifications requested. In accordance
with the PRINCE2
R
(PRojects IN a Controlled En-
vironment) methodology (AXELOS, 2017), which is
a professional project management methodology, stu-
dents carried out several activities such as scope defi-
nition, planning, etc. Furthermore, as in professional
projects, students adopted different roles with differ-
ent functions and responsibilities (AXELOS, 2017):
• EX: Executive. This role has the authority to di-
rect the project and is ultimately responsible for
it.
Each project is managed by a team of two EXs.
These students are from those enrolled in the
M.Sc. program.
• PM: Project Manager. On behalf of the EX, this
role has management responsibilities and the au-
thority to run the project on a day-to-day basis.
Depending on the academic year, each project is
managed by a team of five to ten PMs. These are
also M.Sc. students.
• TMg: Team Manager. This role is responsible to
ensure the production and delivery of those prod-
ucts defined by the PM team.
When necessary, some PM –usually, two or three–
are temporarily assigned to TMg.
• TM: Team Member. This role is responsible to
A2E 2019 - Special Session on Analytics in Educational Environments
666

develop the products required under the orders of
the TMg.
Each project is composed of 10 to 15 TMs. These
are the B.Sc. students.
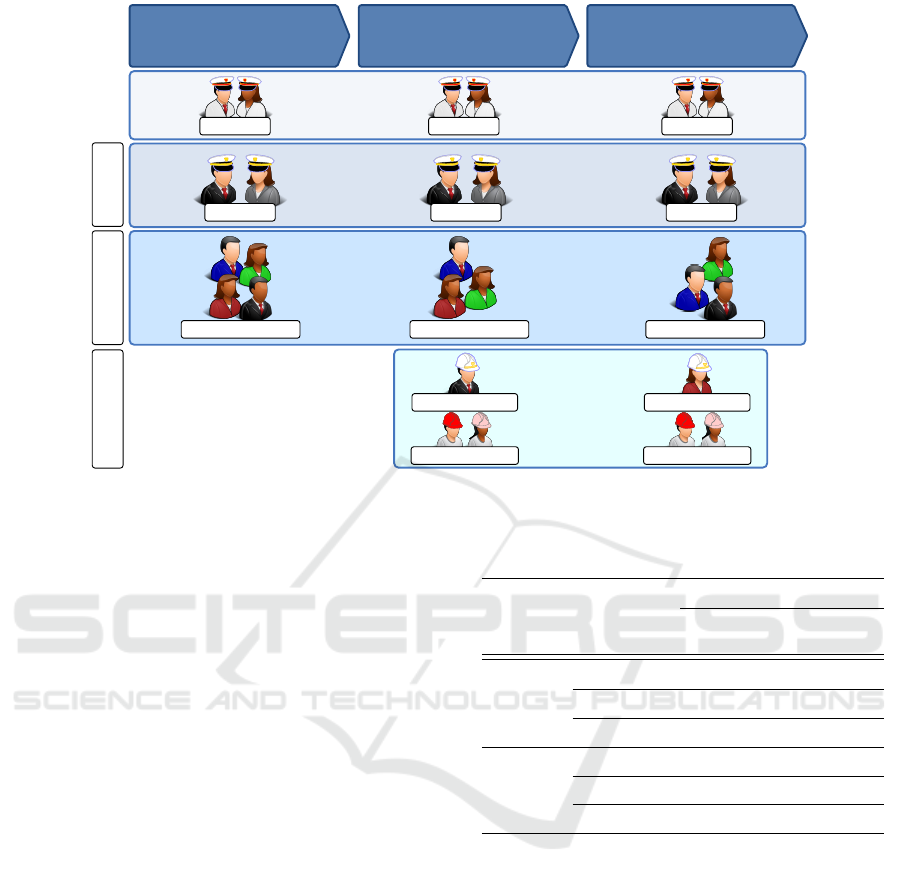
The PRINCE2
R
methodology breaks projects into
non-overlapping stages (phases) (Figure 1) in order
to plan, monitor and control the project on a stage-
by-stage basis. In our particular case, due to time
constraints –projects should be completed in three
months–, the project life cycle was broken down into
the following stages (AXELOS, 2017):
• IS00: Initiation Stage. The main purpose of this
stage is to determine the work that needs to be
done to deliver the requested products and estab-
lish the foundations of the project.
Teachers adopt the role of a client (Corporate) and
deliver a project mandate to the EX team. This is
the trigger for the project. As part of their respon-
sibilities, the EXs authorize the start of the Initi-
ation Stage and approve all major plans provided
by the PM team. Once the foundations for the
project have been established and the next stage
has been planned in detail, the EX authorize the
start of the next stage.
This stage, where only M.Sc. students participate
in the project, is usually two weeks long.
• DS01: Subsequent Delivey Stage(s). This is the
first stage where requested products are to be cre-
ated.
Several PMs temporarily assume the TMg role in
order to assign the work to be done by the TMs,
who are organized in smaller teams or work pack-
ages. Each TMg –one per work package– must
also report progress to the PMs. At the same time,
PMs are responsible to monitor the progress of the
assigned work, report progress to the EXs, deal
with issues and take corrective actions to ensure
that the project produces the required products. At
the end of the stage, the EXs must assess the fea-
sibility of the project and make a decision to au-
thorize the next stage.
In this case, both M.Sc. and B.Sc. students con-
tribute to the project. This stage is approximately
four weeks long.
• FS02: Final Delivery Stage. During this stage, the
last project products are produced and the activi-
ties to decommission the project take place.
The last project products are produced, delivered
and approved as in the previous stage. Then, the
PMs carry out all the necessary activities to de-
commission the project and to obtain authoriza-
tion to close the project. Subsequently, the EX
notify client that the project has been closed.
Similarly to previous stage, students from both
degree programs participate in this stage. Also,
it is usually four weeks long.
It is worth mentioning that the first module of the
course, that is three weeks long, is dedicated to ex-
plain the methodology and tools that will be used dur-
ing the semester. Also, it is dedicated to clarify goals
and success criteria. After this, a practical exam takes
place to assess the students’ skills on the use of the
project management tools that will be used during the
semester. Regarding the students’ knowledge acqui-
sition, a midterm exam at week eight and a final exam
at week 16 are administered.
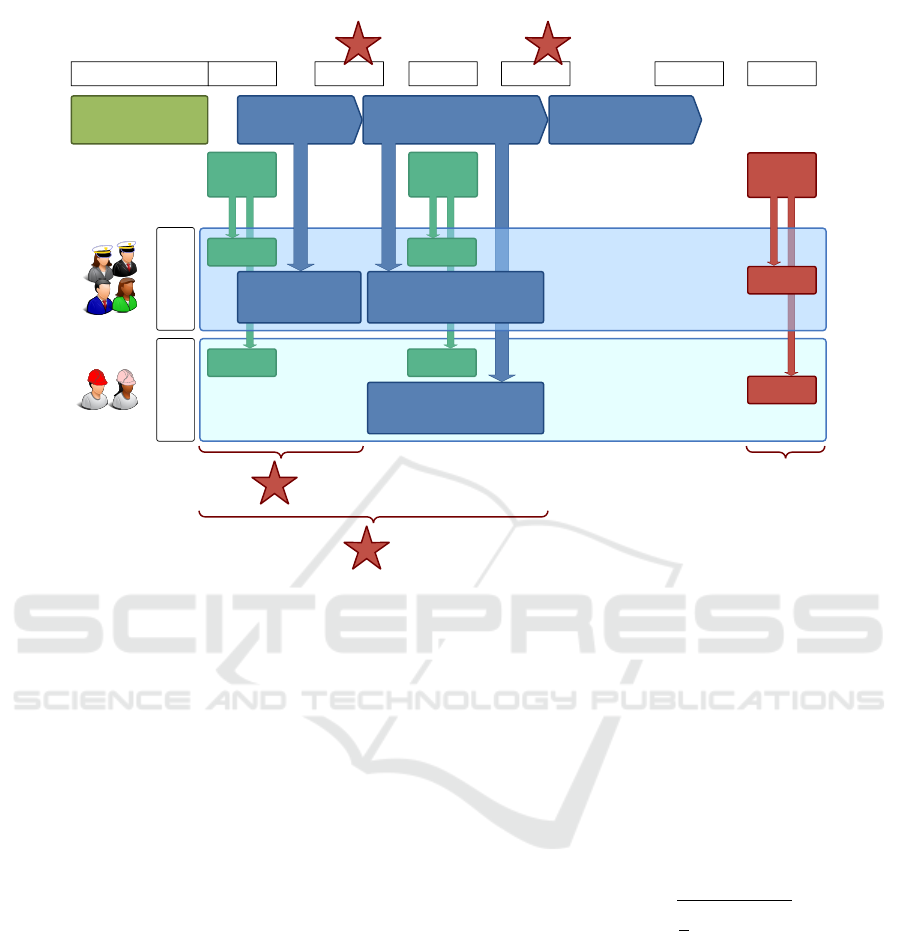
Data
The data used in this work encompasses student in-
formation that can be mainly gathered from the VLE
during the project execution. As illustrated in Figure
2, data was collected from different sources. It is or-
ganized in the following categories:
• Communication Activity (Student Activity Data).
These features are based on the statistical infor-
mation of student activities within the communi-
cation tools. For example, they include the total
number of messages sent by the student over a
period of time or the total number of messages
viewed by the student over a period of time. This
information is gathered on a stage basis.
• Time and Resources Activity (Student Activity
Data).
In this case, the collected information is based
on students’ planning activities, effort allocation,
claimed effort, etc. It is also collected on a stage
basis.
• Information and Documentation Activity (Student
Activity Data).
Relevant information about project deliverables
defined, documents uploaded, meeting minutes
generated, etc., is gathered for each student on a
stage basis.
• Behavioral Assessment.
Since assessment of behavioral competences is
carried out throughout the entire process, it is pos-
sible to use this information to improve the predic-
tive model. It is worth mentioning that each stu-
dent is assessed by all the other participants of the
project interacting with the student in question.
The authors have chosen the following compe-
tences from the IPMA-ICB framework (IPMA,
2006): leadership, engagement & motivation, re-
sults orientation, and teamwork.
Predicting Students’ Performance in a Virtual Experience for Project Management Learning
667
Directing
Managing
Delivering
Initiation Stage
(IS00)
Subsequent Delivery
Stage(s) (DS01)
Final Stage
(FS02)
Team Members Team Members
Corporate Corporate Corporate
Executive Executive Executive
Project Managers
Team Manager
Project Managers Project Managers
Team Manager
Figure 1: PRINCE2
R
stages and roles participating in each of them.
This assessment was enabled by means of differ-
ent surveys that were specifically designed to col-
lect evidence-based opinions about the mentioned
behavioral competences.
• Exams.
Students’ scores on both the practical exam (week
four) and the midterm (week eight) are considered
as inputs in the predictive models.
In total, 21 variables were selected to train the stu-
dents’ performance model. In this work, two predic-
tion models were trained (see Figure 2): one with the
data available at the end of the IS00 stage (week six)
and a second model with the data available at the end
of the DS01 stage (week 10).
The students’ performance data from the first
three academic years (14/15, 15/16, and 16/17) were
randomly divided into two datasets: 70% for train-
ing and 30% for tuning the models. Data from the
most recent academic year (17/18) was used for final
testing of the models. Since only M.SC. students par-
ticipated in the first project stage (IS00), information
regarding B.Sc. students activity was unavailable at
the end of this stage. Thus, these students were not
considered in the IS00 models (see Table 2).
Prediction Methods
In this work, two different data mining tasks were car-
ried out. First, regression was performed to predict
the performance level that each student will achieve
at the end of the course (marks range from 0 to 10).
Table 2: Number of available patterns (students) for each
predictive model.
Dataset
Degree
program
Prediction stage
IS00
(week 6)
DS01
(week 10)
Train
B.Sc. 0 79
M.Sc. 53 53
Total 53 132
Test
B.Sc. 0 21
M.Sc. 24 24
Total 24 45
Next, classifiers were trained to identify at-risk stu-
dents (pass and fail levels were defined). In both
cases, three different supervised techniques were cho-
sen to train the regression and classification models:
• Support Vector Machines (SVM).
A Support Vector Machine (Vapnik, 2000) is a
machine learning technique that constructs a hy-
perplane or a set of hyperplanes in a high dimen-
sional space that separates the patterns into non-
overlapping classes. To do that, the input space
(the original attributes of the patterns) is trans-
formed into a higher dimensional space, named
feature space. This way, SVM are able to obtain
non-linear boundaries to better discriminate pat-
terns.
The SVM parameters (kernel size and soft-margin
width) were tuned to minimize the prediction er-
A2E 2019 - Special Session on Analytics in Educational Environments
668
Week 1 … Week 3 Week 4 Week 6 Week 8 Week 10 Week 14 Week 16
Initiation Stage
(IS00)
Subsequent Delivery
Stage(s) (DS01)
Final Stage
(FS02)
Final
exam
Practical
exam
Mid-
term
M.Sc.
Students
Methodology and
tools introduction
Scores
Student activity +
behavioral assessment
Scores
B.Sc.
Students
Scores
1 2
Scores
Student activity +
behavioral
assessment
Scores
Scores
1
2
…
Student activity +
behavioral assessment
… … … …
Input data for the
IS00 model
Input data for the
DS01 model
IS00 model DS01 model
OUTPUT
• Regression:
range 0 – 10
• Classification:
pass/fail
Figure 2: Visualization of course structure and data gathered for each predictive model.
ror.
• Random Forests.
Random forests (Breiman, 2001) are an ensemble
learning method that operate by constructing and
combining multiple decision trees. Each decision
tree is learned on a random sample and with a ran-
dom set of features. The combination of this set
of diverse decision trees generally results in a bet-
ter model than a single decision tree.
Again, the parameters of the random forests
(number of trees to grow, number of variables ran-
domly sampled as candidates at each split, maxi-
mum depth of a tree, or minimum size of terminal
nodes) were tuned to minimize the prediction er-
ror.
• Gradient Boosted Trees.
Gradient boosting (Friedman, 2001) is another
machine learning technique that belongs to the
group of ensemble methods. That is, it builds a
prediction model in the form of an ensemble of
weak prediction models. More specifically, we
used an implementation of gradient boosted de-
cision trees designed for speed and performance,
i.e., the eXtreme Gradient Boosting (XGBoost)
algorithm (Chen and Guestrin, 2016).
Once more, different parameters such as maxi-
mum depth of a tree, minimum loss reduction re-
quired to make a further patition on a leaf node of
the tree, or step size shrinkage used in update to
prevents overfitting, were tuned to minimize the
prediction error.
Evaluation Criteria
The performance of the regression models was mea-
sured by the root mean squared error (RMSE, Eq. 1)
in the test dataset.
RMSE =
s
1
n
n
∑
i=1
( ˆy
i
− y
i
)
2
(1)
where ˆy
i
and y
i
are the predicted and target values of
the final exam for the i-the student, and n represents
the total number of students in the test dataset.
In order to evaluate the classification performance,
we used the following three scores:
• Precision. It measures the proportion of the exam-
ples which truly belong to class x among all those
which were classified as class x.
• Recall. It is the proportion of examples which
were classified as class x, among all examples
which truly belong to class x, i.e. how much part
of the class was captured.
Predicting Students’ Performance in a Virtual Experience for Project Management Learning
669

Table 3: RMSE on the test dataset for the best trained mod-
els according to the stage where prediction takes place.
Machine
learning
technique
Prediction stage
IS00
(week 6)
DS01
(week 10)
SVM 1.043 0.831
Random Forest 0.987 0.759
XGBoost 1.044 0.917
• F-measure. This is a single measure that char-
acterizes true positive rate (recall) and precision
(Eq. 2).
F-measure =
2 · recall · precision
recall + precision
(2)
3 RESULTS AND DISCUSSION
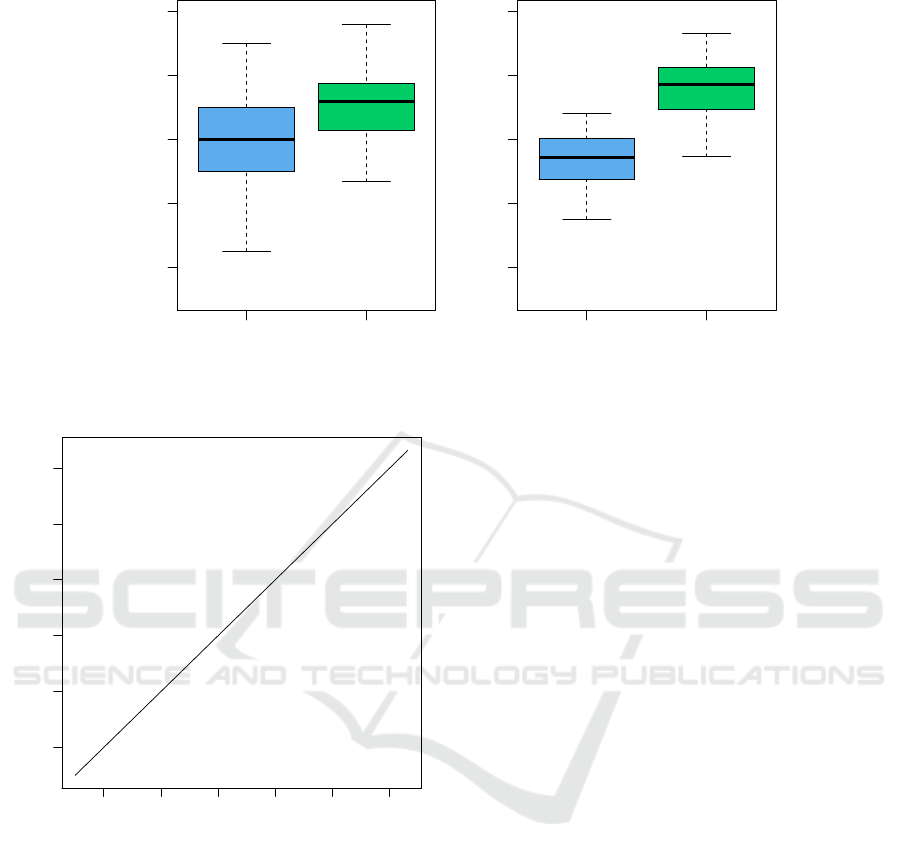
Regression Models
First, students’ academic performance (Figure 3) was
analyzed using regression analysis. Since it would be
desirable to be able to identify weak students as soon
as possible, two prediction models were built with the
regression techniques indicated in section 2. One pre-
diction model was based on all the available data at
the end of the first stage of the project (IS00), i.e.,
at the end of week six of the course, while the other
model was trained with all the data gathered at the end
of the second stage of the project (DS01), i.e., at the
end of week 10 of the course. The goal of both mod-
els was to predict the students’ mark of the final exam
at week 16. The final grade was a numerical value
between 0 and 10.
Table 3 quantifies the prediction errors of the best
models for each machine learning used in this work.
As expected, the more information available for each
student the better estimations were possible. Further-
more, it must be noted that B.Sc. students did not
participate in the project during the IS00 stage. Thus,
the available information for these students was even
lower than that available for M.Sc. students. Indeed,
B.Sc. students were not considered in the IS00 mod-
els. Among all the trained models, random forests
showed the lowest test errors.
Inspection of Figure 4, which shows the results
obtained with the random forest algorithm and the
DS01 dataset, reveals that it is possible to identify
those students at risk of failing at the end of the
course. Also, it is possible to observe that the model
Table 4: Number of students who passed and failed the
course.
Dataset
Degree Program
TOTAL
B.Sc. M.Sc.
Train
Pass 61 49 110
Fail 18 4 22
Total 79 53 132
Test
Pass 15 24 39
Fail 6 0 6
Total 21 24 45
tends to underestimate the marks of the final exam of
the high performance students.
Several studies (Macfadyen and Dawson, 2010;
Strecht et al., 2015) have analyzed the possibility of
predicting the final grade of students at course level.
Although these works have presented interesting re-
sults in predicting a student’s pass/fail status (clas-
sification task), the accuracy of the students’ final
grade prediction models (regression task) is limited
and needs to be improved. Although the regression
models presented in this work perform students’ fi-
nal grade predictions with relevant accuracy, these re-
sults must be taken with caution due to the size of the
dataset.
Classification Models
As in many real-world classification problems, this
work also deals with an imbalanced dataset. That
is, the number of patterns (students) available for the
classes considered in this work –pass and fail– is dif-
ferent (see Table 4). However, since it is not a severely
imbalanced dataset (the minority class –fail– is above
10%), we did not apply any approach to address it.
We also trained two classifiers to study the pos-
sibility of early identifying at risk students. Table 5
shows the test results obtained with the best classifier
trained with each machine learning technique consid-
ered in this work.
Despite the outstanding results obtained with the
data available at the end of the IS00 stage, it must be
taken into account that:
1. data from B.Sc. students was not available at this
stage, and thus they could not be assigned to any
class (pass or fail),
2. none of the M.Sc. students in the test dataset
failed (i.e., the classifiers that assigned all students
to the pass class obtained the best performance).
Therefore, results obtained with the classifiers
trained according to the data available at the end of
A2E 2019 - Special Session on Analytics in Educational Environments
670
●
●
B.Sc. M.Sc.
2 4 6 8 10
Train dataset
Degree Program
Final exam mark (10−point scale)
B.Sc. M.Sc.
2 4 6 8 10
Test dataset
Degree Program
Final exam mark (10−point scale)
Figure 3: Summary of students’ academic performance of each dataset.
●
●
●
●
●
●
●
●
●
●
●
●
●
●
●
●
●
●
●
●
●
●
●
●
●
●
●
●
●
●
●
●
●
●
●
●
●
●
●
●
●
●
●
●
●
4 5 6 7 8 9
4 5 6 7 8 9
Actual performance
Predicted performance
Figure 4: Test results for the best trained model (random
forest with data available at the end of DS01 stage).
the DS01 stage (week 10) were more realistic. Al-
though all the classifiers had a strong generalization
ability, that trained with the XGBoost algorithm was
the best in this case.
Most of the works found in the literature (Costa
et al., 2017; Macfadyen and Dawson, 2010; Romero
et al., 2010; Strecht et al., 2015) addressed the prob-
lem of predicting students’ performance in a given
course from a classification point of view. Such stud-
ies have presented promising ways to identify whether
a student will pass or fail in a course. However, the ac-
curacy of predicting failure is limited in some of them.
Although the results presented in this work must be
taken with caution due to the size of the dataset, they
show the possibility to accurately predict the students’
final marks starting from their VLE usage data and
their behavior during the learning experience.
4 CONCLUSIONS
This paper has presented an application of EDM to the
prediction of students’ performance in a project man-
agement course according to their use of the VLE de-
signed to support the learning process, their behavior
during the experience, and their results in two exams
performed during the first half of the course. There-
fore, the analyzed data included individual attributes
related to communication, time, resources, informa-
tion and documentation activity, as well as behavioral
assessment, and skills and knowledge demonstrated
by the first half of the course.
Based on the results that were obtained using
several regression and classification algorithms –
support vector machines, random forests, and gradi-
ent boosted trees–, it is possible to confirm the use-
fulness of EDM to predict students’ performance. For
instance, these models can be used for early identifi-
cation of weak students who will be at risk in order to
take early actions to prevent them from failure.
Authors planned to conduct further research with
a greater number of both students and features (e.g.,
personality, learning approaches, motivation, work
experience, etc.). Moreover, authors will evaluate the
possibility of estimating students’ performance be-
fore week 10 with the view of identifying weak stu-
dents and helping them as soon as possible. Also, it
Predicting Students’ Performance in a Virtual Experience for Project Management Learning
671

Table 5: The results of classifying students using different supervised algorithms and different available data.
Classification
Algorithm
Evaluation
Criteria
Prediction stage
IS00
(week 6)
DS01
(week 10)
SVM
Precision 1.000 0.882
Recall 1.000 0.889
F-Measure 1.000 0.885
Random
Forest
Precision 1.000 0.903
Recall 0.917 0.911
F-Measure 0.761 0.903
XGBoost
Precision 1.000 0.929
Recall 0.958 0.911
F-Measure 0.979 0.916
will be investigated the effect of handling imbalanced
data with techniques such as SMOTE (Chawla et al.,
2002), as well as the effect of feature selection on
the prediction models. Finally, we consider it neces-
sary to carry out a deep analysis of the collected data
to better identify factors influencing students’ perfor-
mance in order to acquire further knowledge for con-
tinuous improvement in higher education.
ACKNOWLEDGEMENTS
The authors wish to recognise the financial support
of the “Vicerrectorado de Profesorado, Planificaci
´
on
e Innovaci
´
on Docente” of the University of La Ri-
oja, through the “Direcci
´
on Acad
´
emica de Formaci
´
on
e Innovaci
´
on Docente”.
REFERENCES
Aldowah, H., Al-Samarraie, H., and Fauzy, W. M. (2019).
Educational data mining and learning analytics for
21st century higher education: A review and synthe-
sis. Telematics and Informatics, 37:13–49.
Aluko, R. O., Adenuga, O. A., Kukoyi, P. O., Soy-
ingbe, A. A., and Oyedeji, J. O. (2016). Predict-
ing the academic success of architecture students by
pre-enrolment requirement: using machine-learning
techniques. Construction Economics and Building,
16(4):86–98.
AXELOS (2017). Managing Successful Projects with
PRINCE2
TM
. The Stationary Office, TSO, Norwich,
UK, 2017 edition.
Baradwaj, B. K. and Pal, S. (2011). Mining Educational
Data to Predict Students’ Academic Performance. In-
ternational Journal of Advanced Computer Science
and Applications, 2(6):63—-69.
Breiman, L. (2001). Random forests. Machine Learning,
45:5–32.
Burgos, C., Campanario, M. L., de la Pe
˜
na, D., Lara, J. A.,
Lizcano, D., and Mart
´
ınez, M. A. (2017). Data min-
ing for modeling students’ performance: A tutoring
action plan to prevent academic dropout. Computers
and Electrical Engineering, 0:1–16.
Campagni, R., Merlini, D., and Verri, M. C. (2015). An
analysis of courses evaluation through clustering. In
Zvacek, S., Restivo, M. T., Uhomoibhi, J., and Helfert,
M., editors, Computer Supported Education, pages
211–224, Cham. Springer International Publishing.
Castro, F., Vellido, A., Nebot, A., and Mugica, F. (2007).
Evolution of Teaching and Learning Paradigms in In-
telligent Environment (Studies in Computational In-
telligence), volume 62, chapter Applying data mining
techniques to e-learning problems, pages 183–221.
Springer-Verlag, New York.
Chawla, N. V., Bowyer, K. W., Hall, L. O., and Kegelmeyer,
W. P. (2002). SMOTE: Synthetic Minority Over-
sampling Technique. Journal of Artificial Intelligence
Researh, 16:321–357.
Chen, T. and Guestrin, C. (2016). XGBoost: A scalable
tree boosting system. In Proceedings of the 22nd
ACM SIGKDD International Conference on Knowl-
edge Discovery and Data Mining, KDD ’16, pages
785–794, New York, NY, USA. ACM.
Costa, E. B., Fonseca, B., Santana, M. A., de Ara
´
ujo, F. F.,
and Rego, J. (2017). Evaluating the effectiveness of
educational data mining techniques for early predic-
tion of students’ academic failure in introductory pro-
gramming courses. Computers in Human Behavior,
73:247–256.
European Commission (2013). Report to the European
Commission on improving the quality of teaching
and learning in Europe’s higher education institutions.
Technical report, Publications Office of the European
Union, Luxembourg.
European Commission/EACEA/Eurydice (2014). Moderni-
sation of Higher Education in Europe: Access, Reten-
tion and Employability 2014. Technical report, Publi-
cations Office of the European Union, Luxembourg.
A2E 2019 - Special Session on Analytics in Educational Environments
672

European Commission/EACEA/Eurydice (2015). The Eu-
ropean Higher Education Area in 2015: Bologna Pro-
cess Implementation Report. Technical report, Publi-
cations Office of the European Union, Luxembourg.
Friedman, J. H. (2001). Greedy function approximation: A
gradient boosting machine. The Annals of Statistics,
29(5):1189–1232.
Gaudioso, E., Montero, M., Talavera, L., and Hernandez-
del Olmo, F. (2009). Supporting teachers in collab-
orative student modeling: A framework and an im-
plementation. Expert Systems with Applications, 36(2
PART 1):2260–2265.
Gonz
´
alez-Marcos, A., Alba-El
´
ıas, F., Navaridas-Nalda, F.,
and Ordieres-Mer
´
e, J. (2016). Student evaluation of
a virtual experience for project management learning:
An empirical study for learning improvement. Com-
puters & Education, 102:172–187.
Gonz
´
alez-Marcos, A., Navaridas-Nalda, F., Ordieres-Mer
´
e,
J., and Alba-El
´
ıas, F. (2019). Handbook of Research
on E-Assessment in Higher Education, chapter A
Model for Competence E-Assessment and Feedback
in Higher Education, pages 295–311. IGI Global, Her-
shey PA, USA.
Gonz
´
alez-Marcos, A., Olarte-Valent
´
ın, R., Sainz-Garc
´
ıa,
E., and M
´
ugica-Vidal, R. (2017). A Virtual Learning
Environment to Support Project Management Teach-
ing. In Proceedings of the International Joint Confer-
ence SOCO’17-ICEUTE’17, pages 751–759.
Graf, S., Viola, S. R., and Kinshuk (2007). Automatic
student modelling for detecting learning style prefer-
ences in learning management systems. In Proceed-
ings of the IADIS international conference on cogni-
tion and exploratory learning in digital age (CELDA
2007), pages 172–179.
Hoffait, A. S. and Schyns, M. (2017). Early detection of
university students with potential difficulties. Deci-
sion Support Systems, 101:1–11.
IPMA (2006). ICB: IPMA Competence Baseline, version 3.
International Project Management Association.
Jiang, Y. H., Javaad, S. S., and Golab, L. (2016). Data min-
ing of undergraduate course evaluations. Informatics
in Education, 15(1):85–102.
Laugerman, M., Rover, D. T., Shelley, M. C., and Mick-
elson, S. K. (2015). Determining Graduation Rates
in Engineering for Community College Transfer Stu-
dents Using Data Mining. International Journal of
Engineering Education, 31(6(A)):1448–1457.
Li, N., Matsuda, N., Cohen, W., and Koedinger, K. (2011).
A Machine Learning Approach for Automatic Stu-
dent Model Discovery. In Proceedings of 4th Interna-
tional Conference on Educational Data Mining (EDM
2011), pages 31–40.
Macfadyen, L. P. and Dawson, S. (2010). Mining LMS
data to develop an ”early warning system” for educa-
tors: A proof of concept. Computers and Education,
54(2):588–599.
Marbouti, F., Diefes-Dux, H. A., and Madhavan, K. (2016).
Models for early prediction of at-risk students in a
course using standards-based grading. Computers and
Education, 103:1–15.
M
´
arquez-Vera, C., Cano, A., Romero, C., Noaman, A.
Y. M., Mousa Fardoun, H., and Ventura, S. (2016).
Early dropout prediction using data mining: A case
study with high school students. Expert Systems,
33(1):107–124.
Migu
´
eis, V. L., Freitas, A., Garcia, P. J., and Silva, A.
(2018). Early segmentation of students according to
their academic performance: A predictive modelling
approach. Decision Support Systems, 115:36–51.
Mishra, T., Kumar, D., and Gupta, S. (2014). Mining stu-
dents’ data for prediction performance. International
Conference on Advanced Computing and Commu-
nication Technologies, ACCT, (February 2014):255–
262.
Romero, C., Espejo, P. G., Zafra, A., Romero, J. R., and
Ventura, S. (2010). Web usage mining for predict-
ing final marks of students that use Moodle courses.
Computer Applications in Engineering Education,
21(1):135–146.
Romero, C. and Ventura, S. (2010). Educational data min-
ing: a review of the state of the art. IEEE Transactions
on Systems, Man, and Cybernetics, Part C: Applica-
tions and Reviews, 40(6):601–618.
Romero, C. and Ventura, S. (2013). Data mining in edu-
cation. Wiley Interdisciplinary Reviews: Data Mining
and Knowledge Discovery, 3(1):12–27.
Strecht, P., Cruz, L., Soares, C., Mendes-Moreira, J., and
Abreu, R. (2015). A Comparative Study of Classifi-
cation and Regression Algorithms for Modelling Stu-
dents’ Academic Performance. Proceedings of the 8th
International Conference on Educational Data Min-
ing, pages 392–395.
Vapnik, V. (2000). The Nature of Statistical Learning The-
ory. Springer-Verlag, New York, 2nd edition.
Predicting Students’ Performance in a Virtual Experience for Project Management Learning
673
