
An Attempt to Create Speech Synthesis Model That Retains Lombard
Effect Characteristics
Gražina Korvel
1 a
, Olga Kurasova
1 b
and Bożena Kostek
2 c
1
Institute of Data Science and Digital Technologies, Vilnius University, Akademijos str. 4, LT-04812, Vilnius, Lithuania
2
Audio Acoustics Laboratory, Faculty of Electronics, Telecommunications and Informatics, Gdańsk University of
Technology, G. Narutowicza 11/12, 80-233 Gdansk, Poland
Keywords: Speech Analysis and Synthesis, Lombard Effect, SISO (Single-Input and Single-Output) System, Sinusoidal
Model.
Abstract: The speech with the Lombard effect has been extensively studied in the context of speech recognition or
speech enhancement. However, few studies have investigated the Lombard effect in the context of speech
synthesis. The aim of this paper is to create a mathematical model that allows for retaining the Lombard effect.
These models could be used as a basis of a formant speech synthesizer. The proposed models are based on
dividing the speech signal into harmonics and modeling them as the output of a SISO system whose transfer
function poles are multiple, and inputs vary in time. An analysis of the Lombard effect of the synthesized
signal is performed on the noise residual. The synthesized signal residual is described by vectors of acoustic
parameters related to the Lombard effect. For testing the performance of the created models in various noise
conditions two classifiers are employed, namely kNN and Naive Bayes. For comparison of results, we created
models of sinusoids based on frequency tracks. The results show that a model based on the residual sinewave
sum demonstrates the possibility of retaining the Lombard effect. Finally, future work directions are outlined
in conclusions.
1 INTRODUCTION
Even though researchers and engineers try to
automate speech recognition and synthesis at least for
half of a century, the progress in this field is below
expectations. This especially concerns speech
synthesis and speech in noise production and
perception. Both research areas require a thorough
analysis of individual spoken elements, carried out
individually for languages. Analysis of speech in a
noisy environment is an important aspect to deepen
knowledge which is still missing. In the presence of
noise, production of speech is modified. One of the
most prominent effects of noise on speech production
is called the Lombard effect, named after the French
oto-rhino-laryngologist (Zollinger and Brumm,
2011), who discovered “the symptom of the raised
voice”, i.e., vocal effort expended due to noise.
Lombard determined that in order to improve the
a
https://orcid.org/0000-0002-1931-6852
b
https://orcid.org/0000-0002-0570-1741
c
https://orcid.org/0000-0001-6288-2908
audibility, the speakers increased the level of their
voice when they were in intense, adverse noise
conditions, for example in noisy environments, in
restaurants, etc. He also stated that the speakers were
not aware of this effect. The effect was decided to be
used to diagnose the degree of deafness, as well as to
reveal people who simulate hearing problems.
By definition, the Lombard effect (LE) is defined
as the unintended tendency of the interlocutor to
increase the level of speech in noise conditions in
order to improve audibility and intelligibility (Kim,
Davis, 2014). It was shown that LE manifests itself in
many other speech variables than intensity only. LE
causes changes in frequencies of the fundamental and
formants, duration of vowels, signal spectrum slope
flattening (Brum and Zollinger, 2018), etc. (Folk and
Schiel, 2011; Godoy et al., 2014; Garnier et al., 2006).
The Lombard effect was and is extensively
researched (Boril and Pollák, 2005; Boril and Hansen,
280
Korvel, G., Kurasova, O. and Kostek, B.
An Attempt to Create Speech Synthesis Model That Retains Lombard Effect Characteristics.
DOI: 10.5220/0007854302800289
In Proceedings of the 16th International Joint Conference on e-Business and Telecommunications (ICETE 2019), pages 280-289
ISBN: 978-989-758-378-0
Copyright
c
2019 by SCITEPRESS – Science and Technology Publications, Lda. All rights reserved

2010; Kim J. and Davis, 2014; Garnier and Henrich,
2013; Kleczkowski et al., 2017; Krishnamurthy and
Hansen, 2009; Van Summers et al., 1988; Vlaj and
Kačič, 2011), contrarily synthesis of LE is visible in
the literature to less extent.
The speech with the Lombard effect has been
studied extensively in the context of speech
recognition (Vlaj and Kačič, 2011; Marxer et al.,
2018). However, less attention has been paid to
speech with Lombard effect synthesis. One of the
reasons for this is that recording a large database of
units that would be used in unit selection or
concatenative synthesis is an extremely complex task.
The authors of papers (Huang et al., 2010; López et
al., 2017) propose a speech transformation approach
to mimic this Lombard effect for improving the
intelligibility of speech in noisy environments. These
research has tended to focus on speaking style
conversion from normal to Lombard speech, rather
than creating speech models with Lombard effect. To
our knowledge, only a few studies (Raitio et al., 2011;
Suni et al., 2013) describe the speech synthesis with
the Lombard effect. These studies are, however,
based on hidden Markov models (HMMs). It is well
known that the naturalness of synthetic speech given
through HMM-based synthesis system is not as good
as that of the unit-selection or formant speech
synthesizers.
The goal of this research is to create the models
of speech which retain the Lombard effect. Such a
model may help to synthesize these speech variables
that may facilitate communication and perception in
noisy adverse environments. These models could be
used as a basis of formant synthesizer, which has
advantages against other synthesizers. It produces
sufficiently intelligible speech even at high speed,
and most importantly, it can control prosody aspects
of the synthesized speech.
The main focus of most of the scientific papers
which cover speech synthesis is on quality of the
synthesized language. In this work, we look at the
synthesis of speech from another perspective.
Therefore, we propose a speech model which
reconstructs the Lombard effect in the synthesized
speech.
The objective of this research is focused on vowel
and semivowel speech phonemes analysis with the
Lombard effect. Since the character of vowel and
semivowel sounds is periodic, according to Fourier
theory, these sounds can be expanded into the sum of
harmonics. It is a well-known fact that information,
especially that, which is not located in the harmonic
peaks is not reproduced in the synthesized signal.
Therefore, for harmonic modeling, a harmonic
generator based on SISO (Single-Input and Single-
Output) system proposed by Korvel et al. (Korvel et
al., 2016) is used in this paper. In order to distinguish
whether the synthesized signal covers information
concerning Lombard effect, an analysis of noise
residual of regular speech and that with Lombard
effect is performed. For a comparison of results, we
created models of sinusoids based on frequency
tracks (Serra, 1997).
The paper is organized as follows: first, the basis
of the harmonic model is recalled. In the next Section,
the main assumptions regarding sinewave modeling
based on frequency trackers are given. Then, noise
residual analysis technique is described based on
parametric description and examination of the
extracted speech parameters. The experimental part
consists in speech recordings, extraction of the vowel
and consonant phonemes data from the recordings of
utterances in the noise conditions, and the analysis of
natural and synthesized speech uttered in the
absence/presence of noise. Individual parameters for
which the analyses were conducted are specified.
Additionally, speech classification results are
presented employing two well-known classifiers, i.e.,
kNN (k-Nearest Neighbors) and Naive Bayes.
Finally, conclusions are derived on the basis of the
results obtained. Also, future development for
synthesizing Lombard effect in speech is outlined.
2 HARMONIC MODELING
BASED ON SISO SYSTEM
Speech signals of vowels and semivowels are
periodic. Mathematically, a periodic signal can be
approximated by the sum of harmonics:
(1)
where is the phoneme signal,
is the
fundamental frequency of the signal,
refers to the
amplitude of
th
harmonic and
refers to the phase
of the
th
harmonic.
Due to the fact that very high frequencies do not
affect the sound of the speech signal, the infinity
symbol in Eq. (1) can be changed to a finite number
of sinewaves (denoted by ). Also, it should be
noted, that the periods are not completely identical.
Therefore, in order to get a natural sounding, it is
assumed that the harmonic amplitudes and the
fundamental frequency are functions of time.
Therefore Eq. (1) should be rewritten to contain
An Attempt to Create Speech Synthesis Model That Retains Lombard Effect Characteristics
281

respectively:
and
. For a harmonic
generation, we used the model proposed by Korvel et
al. (Korvel et al., 2016). The harmonic is given as the
output of a SISO system whose transfer function
poles are multiple and inputs vary in time. The
impulse response of such a system is the 4
th
order
quasipolynomial:
(2)
where is the discrete time, – refers to the
sampling period, ( – the number of
harmonics),
is the damping factor,
,
,
,
are amplitudes and
,
,
,
– denote
phases.
The edges of
th
harmonic filter are calculated by
the formula:
(3)
(4)
where
is the fundamental frequency of the
analyzed phoneme.
The parameters of quasipolynomial are obtained
using Levenberg method and component-wise
optimization with deconvolution (Slivinskas and
Simonyte, 2009).
A harmonic changing over time is obtained by
using the system inputs with time-varying amplitudes
and slightly varying periods.
Let be a vector consisting of the phoneme
periods:
(5)
where is the number of periods of the phoneme.
The number of periods of the
th
phoneme is close to
the number . Therefore the vector consisting of
the
th
harmonic periods can be expressed by the
following formula:
(6)
where
is the
th
period of the
th
harmonic.
Instead of the unit impulses we use impulses of
different amplitudes as inputs of the system:
=[
,
].
(7)
where
is the th input of the
th
harmonic. The
input value
is calculated as the maximum
amplitudes of the th period of the
th
harmonic. The
detail procedure of determining inputs is presented in
the paper by Pyž et al. (2014).
Such inputs and periods changing gives
naturalness to the synthesized sound.
3 SINEWAVE MODELING BASED
ON FREQUENCY TRACKERS
Our goal is to extract information from the speech
signal phoneme for sinewave modeling. For this
purpose, the tracking technique is used. According to
this technique, the magnitude spectrum
of the
phoneme signal is calculated and the detection
of local peaks in the spectra is performed. The list of
estimated frequencies and amplitudes of the detected
sinusoidal peaks is fed into to the tracking algorithm.
In this paper, we use a classical algorithm proposed
by McAulay and Quatieri (1986). According to this
algorithm, the process of matching each spectrum
peak in frame to the peaks in frame +1, is given in
the three following steps:
Step 1. For each frequency
in frame the
frequency
in frame +1 is sought, which is
closest to such a frequency and whose absolute
distance is less than the threshold . This condition
can be expressed by the following formula:
(8)
where
(
– the total number of peaks
in frame ,
,
– the total
number of peaks in frame , and
.
If the condition (8) is satisfied, then
is
declared to be a candidate to
. Otherwise, if the
absolute distance between all frequencies
and
frequency
is greater or equal than the threshold ,
i.e.:
(9)
SIGMAP 2019 - 16th International Conference on Signal Processing and Multimedia Applications
282

then the frequency
is matched to itself in a frame
+1, but with zero amplitude, and is eliminated from
further consideration.
Step 2. In this step, it is checked, if
has no
better match to unmatched frequencies of frame .
This condition can be defined as follows:
(10)
where .
If condition (10) is satisfied, then
is matched to
. Contrarily, the adjacent remaining lower
frequency
(if such exists) is tested. If the
absolute distance between this frequency and the
frequency
is less than the threshold , the match
of these frequencies is made. Otherwise, the
frequency
is matched to itself with zero
amplitude.
Step 3. For the remaining frequencies in frame
+1, for which no matches have been made
frequencies are created in frame with zero
magnitude and the match is made.
Based on the obtained analysis, resynthesis is then
performed. For reconstruction a sound from a track,
we use a sinewave oscillator bank developed by Ellis
(Ellis, 2004).
4 EVALUATION OF LOMBARD
EFFECT IN MODELS
The speech signal is characterized by many features
such as phonemic variation, temporal structure,
prosody, voice timbre and quality (Ellis, 2008). It also
contains different components of the speaker’s profile
like emotions or sentiments. All these features are
connected into a one-dimensional signal. Therefore,
observation and detection of speech changes in the
context of Lombard speech are complex. Due to the
occurrence of LE, the average intensity of the signal
increases, frequencies of the fundamental and
formants are shifted, duration of the individual words
and that of vowels is changed, pause between words
may be shortened, spectral energy from the low-
frequency band may shift towards the medium and
high-frequency bands (Folk and Schiel, 2011; Godoy
et al., 2014; Garnier et al., 2006).
Based on these indications given above, we
investigate a set of parameters including time and
frequency domain features. It is because some of the
changes in speech may be better visible in the signal
descriptors rather than basic signal analysis. The time
domain parameters are based on the analysis of the
distribution of sound sample values in relation to zero
and Root Mean Square (RMS) energy of the signal.
Parameters contained in this group are as follows: the
number of samples exceeding levels RMS, RMS,
RMS; the number of the signal crossings in
relation to levels RMS, RMS, RMS (Kostek
et al., 2011).
The frequency domain parameters are calculated
from the Discrete Fourier transform spectrum. The
following spectral shape parameters are extracted
based on MPEG 7 standard: Audio Spectral Centroid,
Audio Spectral Spread, Audio Spectral Skewness,
Audio Spectral Kurtosis, Spectral Entropy, Spectral
RollOff, Spectral Brightness, Audio Spectrum
Envelope, Spectral Flatness Measure. The spectrum
shape parameters let us observe the change of
spectrum shape in the context of noise. Due to the fact
that Mel-Frequency Cepstral Coefficients (MFCCs)
play major role in most applications considering
speech in noise analysis (Al-Ali et al., 2017; Leu and
Lin, 2017), they are also included in our parameter
set. We calculated 20 MFCC coefficients. The scale
of the first 13 filters is linear; for the rest of filters, the
scale becomes logarithmic. The width of the linear
filter is 66.67 Hz. The first four formants (F1-F4) are
also included in our parameter set. The detailed
description of selected parameters is given in several
authors’ publications (Korvel et al., 2019; Kostek et
al., 2011; Rosner et al., 2014; Rosner and Kostek,
2018).
Our goal is to determine if the synthesized signal
retains information concerning the Lombard effect.
For this purpose, an analysis of noise residual is
performed. The analysis of the speech signal noise
residual based on parametric description and
examination of the extracted parameters is used. The
procedure consists of three steps:
Step 1: The analysis of data samples recorded in
various noise environments.
Step 2: Most discriminating parameter selection.
Step 3: Parametrization of noise residual signal.
Step 4: Classification of speech samples.
In Step 1, the analysis of data samples recorded in
various noise environments is performed. For this
purpose, the parameters described above are
calculated. Before the parameter calculation process,
the speech signal is divided into short-time segments.
The length of the segment is an integer power of 2,
and the overlap between adjacent segments is equal
to 50%. A vector of acoustic parameters is extracted
for each segment. Then, the mean value is computed
based on these parameters obtained from all short-
term segments.
An Attempt to Create Speech Synthesis Model That Retains Lombard Effect Characteristics
283
In the second step, the acoustic parameters which
show differences between signals recorded with
different types of noise and without them are
determined. The analysis was performed for each
phoneme separately.
Then, the parameterization of noise residual of all
considered phonemes is performed. The parameters
determined in the previous step are extracted.
The last point of the analyses (Step 4) is the
classification of speech samples. For this purpose, the
extracted parameters are normalized. It was decided to
normalize the values to the range between 0 and 1. The
classification is performed based on the parameters
extracted from noise residual. In the experiment, two
classical machine learning algorithms to compare
classification rates are used. The first of them is k-
Nearest Neighbors (kNN) based on the calculation of
distances between parameters. The value was set to
7. Also, a Naive Bayes classification method based on
Bayes theory (Kotsiantis, 2007) is employed for
comparison purposes.
5 SPEECH RECORDINGS AND
DATA EXTRACTION
The recordings of sound samples were carried out in a
room with an acoustically treated interior which
suppresses reverberation. The recordings were made in
two conditions: in the room without additional noise as
well as with interference. The interference was given
as pink noise generated using the noise generator, and
the natural language samples of babble speech played
back. As a result, four types of speech recordings were
obtained. They are shown in Table 1.
Table 1: Types of Speech Recordings.
The experiment consists of extraction of the
vowel and consonant phonemes from the recordings
of utterances of three females and three males. The
recording scenario included sentences and single
words read in Polish. Information about audio data is
given in Table 2.
The recordings have been segmented at the
phoneme level. The annotation was manually
conducted using PRAAT program.
Table 2: Parameters of Audio Data.
Format
wav
Sampling frequency
48 kHz
Quantification
16 bits
Number of channels
1
6 EXPERIMENT RESULTS
The results of the modeling of the speech signal with
the Lombard effect are given in this Section. The expe-
riments were performed in the MATLAB environment
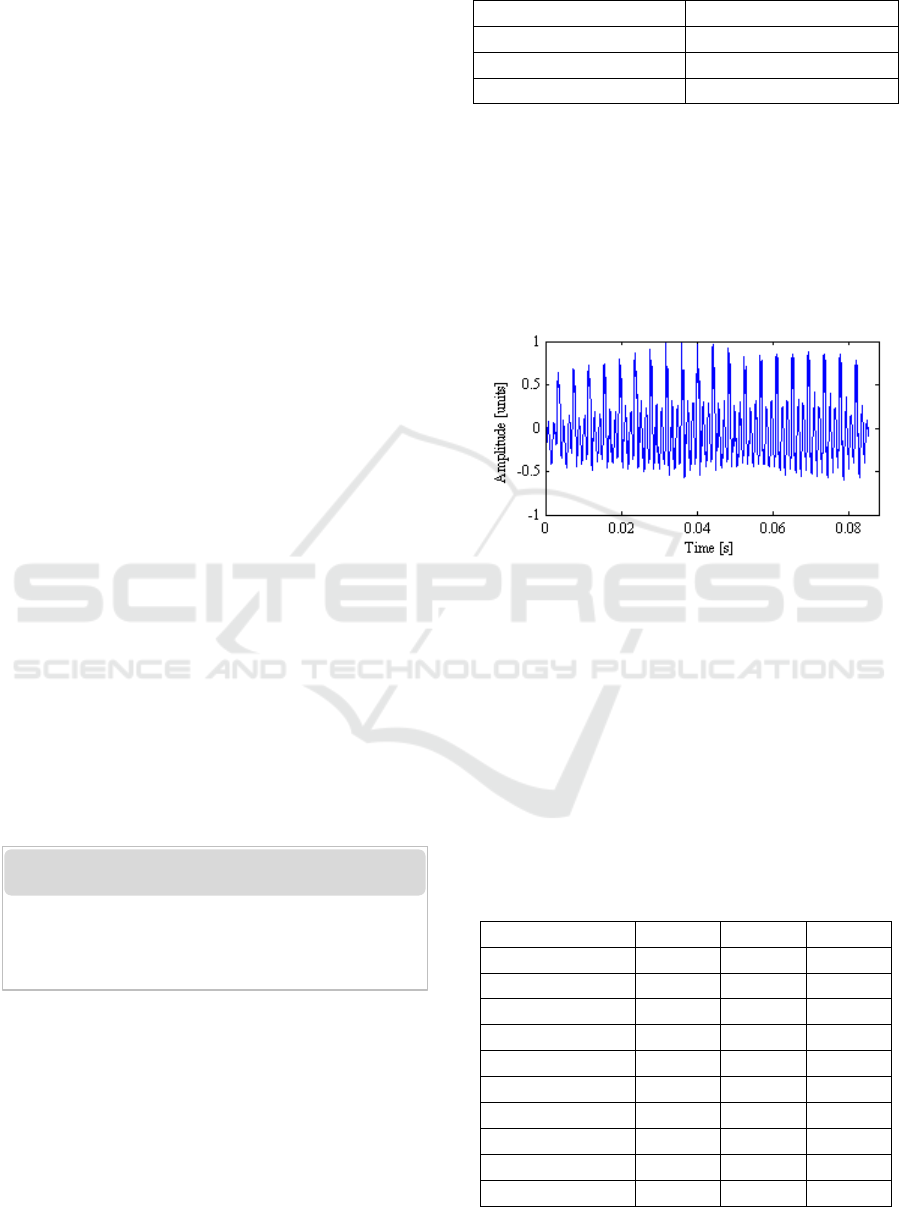
using tools created by authors. An example of the
analyzed phoneme signals is shown in Figure 1.
Figure 1: The Waveform of the Analyzed Speech Signal
(Phoneme /a/).
An experiment begins with expanding speech
signals into harmonics using rectangular filters (Eq.
(3)-(4)) that are implemented by the inverse Fourier
transform. Then each harmonic is modeled as the
input of the SISO system. For this purpose, the
parameters of the impulse response (see Eq. (2)), as
well as system inputs and periods, are determined.
Parameters of the 1
st
– 3rd component impulse
responses are shown in Table 3.
Table 3: Parameters of the 1
st
– 3
rd
Component Impulse
Responses of the Phoneme /a/.
Component number
1
2
3
241
482
723
-600
-600
-600
0
0
0
2.02307
1.14826
3.15181
0.01133
0.01267
0.04995
0.00016
0.00012
0.00035
0
0
0
2.91723
-2.06651
-1.16040
-0.70553
0.87301
1.59821
3.07801
-1.56559
-0.51482
The study room with acoustic barriers
• recordings without noise
• recordings with pink noise of approximately 73 dB
• recordings with pink noise of approximately 84 dB
• recordings with babble speech of approximately 80dB
SIGMAP 2019 - 16th International Conference on Signal Processing and Multimedia Applications
284
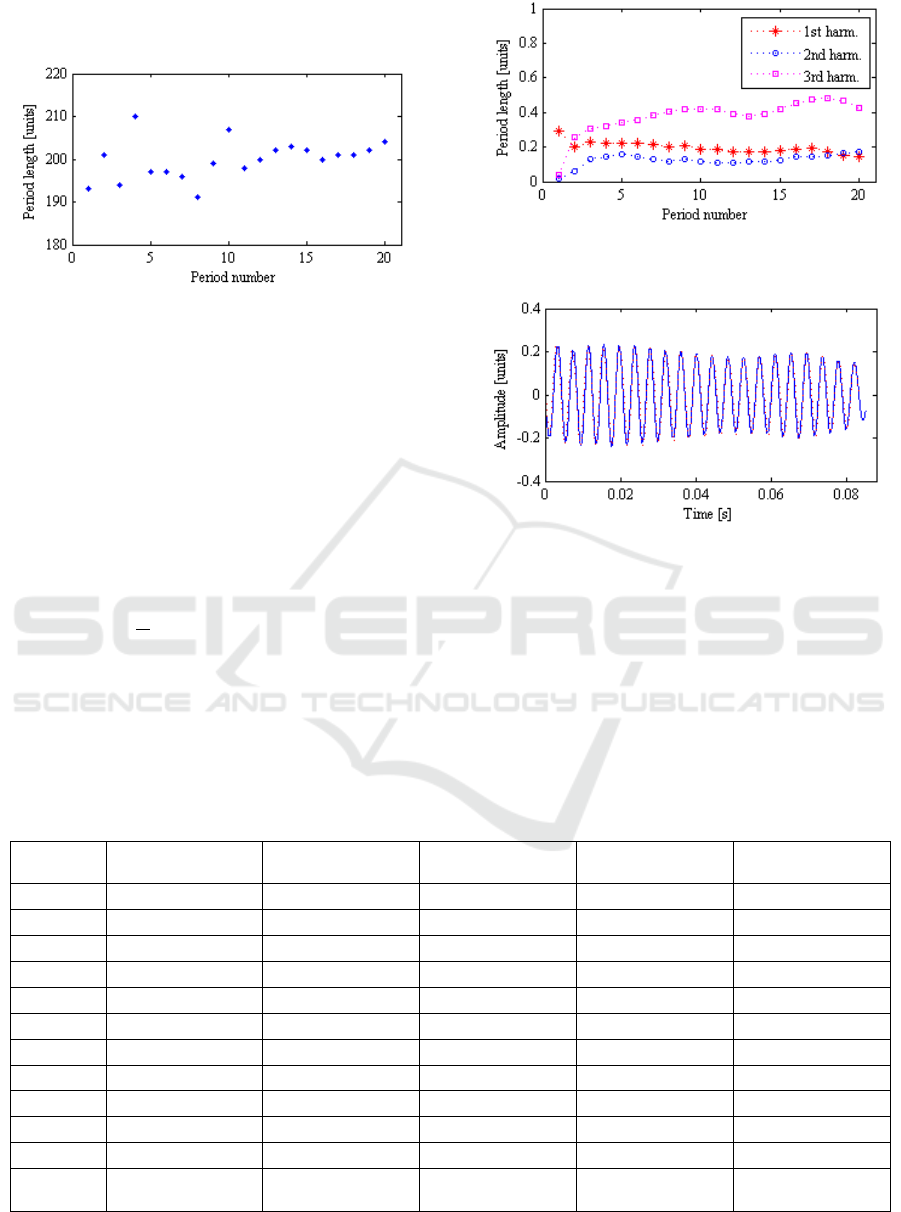
The periods of the SISO system are presented in
Figure 2.
Figure 2: The Periods of the SISO System (Phoneme /a/).
In each period of the selected harmonic, we find the
maximum of the amplitude. The amplitude maxima for
the first three components are shown in Figure 3.
The 1
st
speech signal harmonic and the 1
st
harmonic of the SISO system are shown in Figure 4.
In order to evaluate the accuracy of modeling, the
spectrum of the real data and modeled harmonics sum
have been compared. The mean absolute error (MAE)
is utilized in the model evaluation (Chai and Draxler,
2014):
(11)
where
is the
th
value of the spectrum of the real
phoneme, and
is the
th
value of the spectrum of the
modeled phoneme ( refers to the spectrum length).
Figure 3: The Amplitude Maxima for the First Three
Harmonics (Phoneme /a/).
Figure 4: The 1
st
Speech Signal Harmonic and its Model ('+'
– the Real Data, the Solid Line – the Output of the SISO
System).
For the phoneme /a/, shown as an example in
Figure 4, is 3.62%.
We carried out the experiment using utterances of
three females and three males for vowels and
semivowel phonemes modeling. The MAE values of
the estimated signal spectrum depending on noise level
are given in Table 4.
Table 4: The MAE for the Estimated Vowel and Semivowel Phoneme Signal Spectrum.
Phoneme number
Without noise
Pink noise
73 dB
Pink noise
84 dB
Babble speech
80 dB
/a/
61
5.19%
5.67%
6.62%
6.22%
/i/
65
3.13%
3.69%
4.36%
4.94%
/e/
90
4.44%
5.35%
5.70%
5.37%
/o/
96
3.38%
4.19%
4.62%
4.40%
/u/
68
2.32%
2.77%
3.36%
3.16%
/l/
27
2.50%
4.13%
3.55%
2.88%
/m/
22
2.12%
3.03%
3.56%
3.10%
/n/
75
2.42%
2.90%
3.26%
2.75%
/j/
29
3.09%
4.51%
4.61%
4.26%
/r/
37
3.95%
4.30%
4.54%
4.06%
/w/
11
3.20%
2.53%
3.64%
3.39%
All
phonemes
581
3.25%
3.92%
4.35%
4.05%
An Attempt to Create Speech Synthesis Model That Retains Lombard Effect Characteristics
285
The data given in Table 4 also show how many
recordings were used in the experiment for each
phoneme.
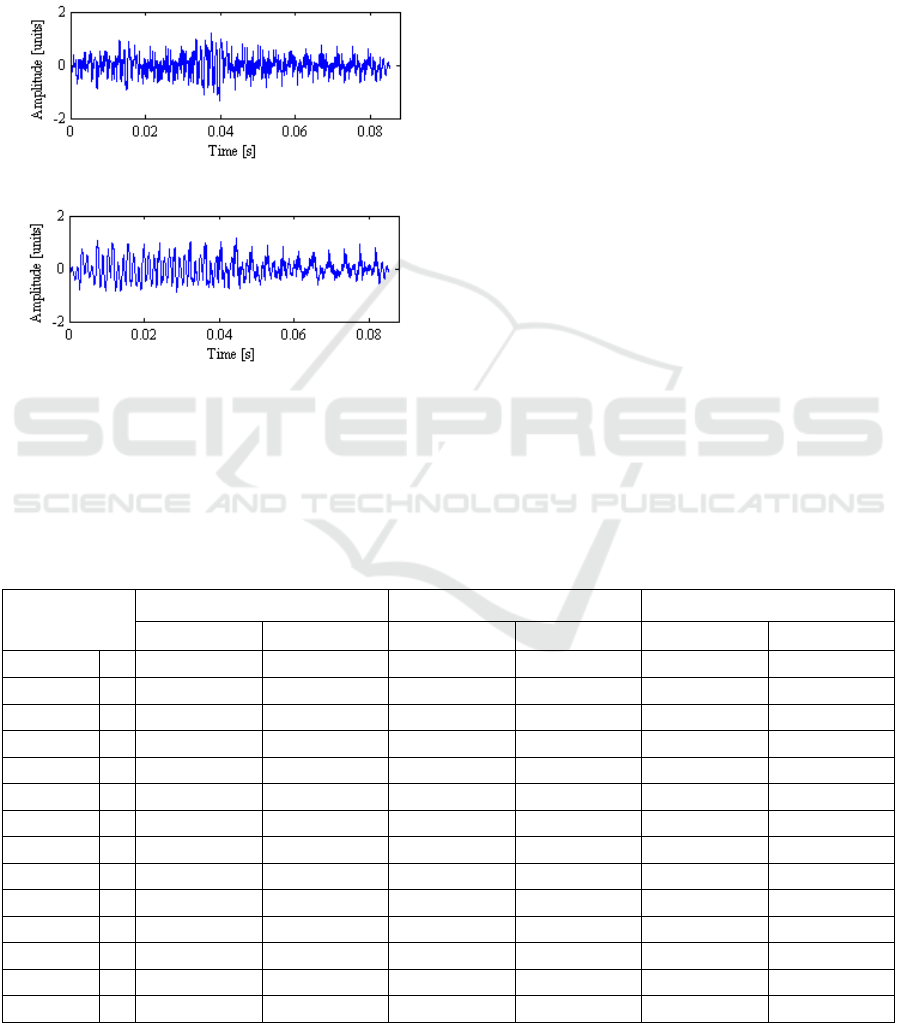
In the second part of the experiment, a parametric
analysis of the synthesized signal residual is
performed. In order to evaluate the obtained results, the
signal residual given from sinewave sum is used. An
example of residual signals is shown in Figure 4.
a)
b)
Figure 5: The Signal Residual of a) the Harmonic Sum
Generated as the Input of the SISO Model, b) Sinewaves.
An analysis was performed for each phoneme
separately. Evaluation of the method suitability is
based on the calculation of the acoustic parameters
for the residual signal. We extracted residual
parameters for all the phonemes. Classification based
on parameters described in Section 4 was performed.
The parameter set of each phoneme is divided into
two parts: training dataset and testing dataset. For the
class determination, kNN and Naive Bayes classifiers
are used. The overall accuracy of the residual
classification is given in Table 5, where the following
denotations are used:
A – recordings without noise and with pink noise
of 73 dB;
B – recordings without noise and with pink noise
of 84 dB;
C – recordings without noise and with babble
speech of 80 dB.
In order to evaluate the classifier performance, the
average accuracy was calculated. A comparison of
the performance of two selected classification
methods averaged for all phonemes is given in
Table 6.
The lowest residual classification accuracies have
been achieved in the case of the harmonic sum (Table
6). In order to determine whether the differences
between the means of the residual classification for
sinewave and harmonic sum are statistically
significant, the t-test for two independent means was
used (Lee, 2014).
Table 5: The Results of the Residual Classification.
Real speech phoneme
Residual of a sinewave sum
Residual of a harmonic sum
kNN
Naive Bayes
kNN
Naive Bayes
kNN
Naive Bayes
/a/
A
76.3%
65.8%
65.8%
65.8%
76.3%
57.9%
B
92.1%
84.2%
81.6%
84.2%
81.6%
79.0%
C
94.7%
94.7%
92.1%
94.7%
79.0%
76.3%
/i/
A
70.0%
70.0%
62.5%
72.5%
65.0%
45.0%
B
75.0%
77.5%
72.5%
80.0%
70.0%
75.0%
C
72.5%
70.0%
72.5%
72.5%
57.5%
57.5%
/e/
A
94.6%
94.6%
85.7%
89.3%
80.4%
82.1%
B
94.6%
94.6%
89.3%
91.1%
82.1%
85.7%
C
100.0%
96.4%
98.2%
96.4%
91.1%
76.8%
/o/
A
60.3%
53.5%
56.9%
58.6%
43.1%
50.0%
B
84.5%
84.5%
81.0%
82.8%
72.4%
79.3%
C
67.2%
65.5%
67.2%
65.5%
41.4%
62.1%
/u/
A
66.7%
66.7%
57.1%
61.9%
61.9%
59.5%
B
69.1%
76.2%
69.1%
69.1%
64.3%
69.1%
SIGMAP 2019 - 16th International Conference on Signal Processing and Multimedia Applications
286

Table 5: The Results of the Residual Classification. (Cont.).
C
54.8%
54.8%
52.4%
45.2%
45.2%
50.0%
/l/
A
77.8%
72.2%
72.2%
66.7%
50.0%
61.1%
B
83.3%
77.8%
72.2%
77.8%
77.8%
66.7%
C
77.8%
77.8%
72.2%
61.1%
44.4%
50.0%
/m/
A
78.6%
71.4%
71.4%
78.6%
71.4%
64.3%
B
64.3%
64.3%
78.6%
71.4%
57.1%
50.0%
C
71.4%
50.0%
50.0%
50.0%
50.0%
50.0%
/n/
A
69.6%
60.9%
63.0%
63.0%
54.4%
56.5%
B
67.4%
56.5%
52.2%
52.2%
56.5%
56.5%
C
67.4%
65.2%
69.6%
54.4%
54.4%
45.7%
/j/
A
88.9%
83.3%
61.1%
83.3%
72.2%
72.2%
B
94.4%
88.9%
83.3%
83.3%
77.8%
72.2%
C
88.9%
72.2%
83.3%
72.2%
83.3%
55.6%
/r/
A
75.0%
66.7%
50.0%
62.5%
66.7%
58.3%
B
87.5%
83.3%
79.2%
70.8%
62.5%
66.7%
C
75.0%
70.8%
66.7%
75.0%
50.0%
16.7%
/w/
A
100.0%
65.0%
62.5%
37.5%
62.5%
37.5%
B
87.5%
100.0%
75.0%
87.5%
37.5%
75.0%
C
75.0%
50.0%
62.5%
62.5%
62.5%
50.0%
Table 6: The results of the residual classification averaged
for all phonemes.
Real speech
phoneme
Residual of
the sinewave
sum
Residual of
the harmonic
sum
kNN
A
78.0%
64.4%
64.0%
B
81.8%
75.8%
67.2%
C
76.8%
71.5%
59.9%
Mean
78.9%
70.6%
63.7%
Naive Bayes
A
70.0%
67.2%
58.6%
B
80.7%
77.3%
70.5%
C
69.8%
68.1%
53.7%
Mean
73.5%
70.9%
60.9%
The test significance level equals 0.05. These
results are as follows: for kNN classifier, the t-value
is 2.11605, the p-value is 0.019118, for Naive Bayes
classifier the t-value is 2.80706, the p-value is
0.003309. Therefore, we can conclude that the
differences are significant.
7 CONCLUSIONS
Phoneme models based on SISO system are proposed
in this paper to create a synthesized speech that
retains the Lombard effect. For that purpose, sounds
of vowels (/a/, /i/, /o/, /u/, /e/) and semivowels (/l/,
/m/, /n/, /j/, /r/, /w/) were utilized in this research. In
general, 581 phoneme recordings employed in the
experiment construction.
In the first part of the experiment, models of
normal speech and that with Lombard effect were
created. The average modeling accuracies (MAE of
the modeled and real signal spectrum) resulted from
this part are as follows: 3.25% for recordings without
noise, 3.92% for recordings with pink noise of 73 dB,
4.35% for recordings with pink noise of 84 dB, and
4.05% for recordings with babble speech of 80 dB.
In the second part of the experiment detection of
the Lombard effect in the synthesized signal noise
residual was performed. We observed that the lowest
residual classification accuracies (63.7% for kNN
classifier, and 60.9% for Naive Bayes classifier) were
obtained in the case of harmonic sum-based
synthesis. In the case of the sinewave sum, the mean
classification accuracy for the kNN classifier was
70.6%, while for the Naive Bayes classifier - 70.9%.
The employment of the one-way analysis of means
An Attempt to Create Speech Synthesis Model That Retains Lombard Effect Characteristics
287

test (t-Test) revealed that the differences between
accuracies of the two considered synthesis methods
are significant.
The results obtained in this study lead to the
conclusion that the proposed model may retain
Lombard effect characteristics.
In the future, we would like to pursue the analysis
of the synthesized phonemes in the context of
checking whether the models created are language-
dependent.
Moreover, future research will expand the
database so that it can be possible to compare the
results obtained with the state-of-the-art algorithms,
such as neural networks (and specifically
convolutional neural networks). The authors have
experience in such an analysis (Korvel et al., 2018),
but even though it will not be possible to directly
compare the results, because, in the case of deep
learning, 2D signal representations will be used
(cepstrogram, spectrogram, etc.).
Additionally, in the case of speech synthesis, an
essential element is the subjective test that allows for
assessing the quality of the synthesized sounds
obtained. This aspect is especially interesting in the
context of language specifics. Preliminary, informal
tests show that quality of the synthesized phonemes
may be directly compared to the original sound.
Therefore, the subjective quality evaluation will be
based on formal listening test sessions in which
normal-hearing subjects will participate. The original
phoneme, as well as the corresponding synthesized
versions, will be used. Subjects will be asked to
answer the following question: “Does the phoneme
sound natural?” and to assign a corresponding score.
Then, the participants will have to distinguish
between the original phoneme and the synthesized
one in the AA-AB comparison test, where A is the
original sound and B the synthesized phoneme. Thus,
this will be thoroughly researched in the future.
ACKNOWLEDGMENTS
This research is funded by the European Social Fund
under the No 09.3.3-LMT-K-712 “Development of
Competences of Scientists, other Researchers and
Students through Practical Research Activities”
measure.
REFERENCES
Al-Ali, A. K. H., Dean, D., Senadji, B., Chandran, V., Naik,
G. R., 2017. Enhanced forensic speaker verification
using a combination of DWT and MFCC feature
warping in the presence of noise and reverberation
conditions, IEEE Access, 5, 15400-15413.
Boril, H., Hansen, J.H.L., 2010. Unsupervised Equalization
of Lombard Effect for Speech Recognition in Noisy
Adverse Environments, IEEE Transactions On Audio,
Speech, And Language Processing, 18(6), 1379-1393.
Boril, H., Pollák, P., 2005. Design and Collection of Czech
Lombard Speech Database, Ninth European
Conference on Speech Communication and
Technology.
Brumm, H., Zollinger, S. A., 2011. The evolution of the
Lombard effect: 100 years of psychoacoustic research.
Behaviour, 148(11-13), 1173-1198. DOI: 148. 1173-
1198. 10.2307/41445240.
Chai, T., Draxler, R. R., 2014. Root mean square error
(RMSE) or mean absolute error (MAE)? Arguments
against avoiding RMSE in the literature, Geoscientific
Model Development, 7, 1247–1250.
Ellis, D. P. W., 2004. Sinewave Speech Analysis/Synthesis
in Matlab, Web resource, available:
http://www.ee.columbia.edu/ln/labrosa/matlab/sws/
accessed February 2019).
Ellis, D. P., 2008. An introduction to signal processing for
speech, The Handbook of Phonetic Sciences, 755-780.
DOI:10.1002/9781444317251.ch20
Folk, L., Schiel, F., 2011. The Lombard Effect in
spontaneous dialog speech, Proceedings of the
Interspeech, 2701-2704.
Garnier, M., Bailly, L., Dohen, M., Welby, P.,
Loevenbruck, H., 2006. An acoustic and articulatory
study of Lombard speech: Global effects on the
utterance, Ninth International Conference on Spoken
Language Processing, INTERSPEECH 2006 – ICSLP,
2246-2249.
Garnier, M., Henrich, N., 2013. Speaking in noise: How
does the Lombard effect improve acoustic contrasts
between speech and ambient noise?, Computer Speech
& Language, 28(2), 580-597.
Godoy, E., Koutsogiannaki, M., Stylianou, Y., 2014,
Approaching speech intelligibility enhancement with
inspiration from Lombard and Clear speaking styles,
Computer Speech & Language 28(2), 629-647.
Godoy, E., Koutsogiannaki, M., Stylianou, Y., 2014.
Approaching speech intelligibility enhancement with
inspiration from Lombard and Clear speaking styles,
Computer Speech and Language, 28(2), 629-647.
Huang, D. Y., Rahardja, S., Ong, E. P., 2010. Lombard
effect mimicking. In Seventh ISCA Workshop on
Speech Synthesis.
Kim, J., Davis, Ch., 2014. Comparing the consistency and
distinctiveness of speech produced in quiet and in noise.
Computer Speech & Language, 28(2), 598-606.
Kleczkowski, P., Żak, A., Król-Nowak, A., 2017. Lombard
Effect in Polish Speech and its Comparison in English
Speech, Archives of Acoustics, 42(4), 561–569,
doi:10.1515/aoa-2017-0060.
Korvel, G., Šimonytė, V., Slivinskas, V., 2016. A phoneme
harmonic generator, Information Technology and
Control, 45 (1), 7-12.
SIGMAP 2019 - 16th International Conference on Signal Processing and Multimedia Applications
288

Korvel, G., Kurowski, A., Kostek, B., Czyzewski, A., 2019.
Speech Analytics Based on Machine Learning. In:
Tsihrintzis G., Sotiropoulos D., Jain L. (eds) Machine
Learning Paradigms. Intelligent Systems Reference
Library, vol 149. Springer, Cham
Korvel, G., Treigys, P., Tamulevicus, G., Bernataviciene,
J., Kostek, B., 2018. Analysis of 2D Feature Spaces for
Deep Learning-Based Speech Recognition. Journal of
the Audio Engineering Society, 66(12), 1072-1081.
Kostek, B., Kupryjanow, A., Zwan, P., Jiang, W., Raś, Z.,
Wojnarski, M., Swietlicka, J., 2011. Report of the
ISMIS 2011 contest: music information retrieval,
International Symposium on Methodologies for
Intelligent Systems, 715-724.
Kotsiantis, S. B., 2007. Supervised Machine Learning: A
Review of Classification Techniques, Informatica,
31(3), 249-268.
Krishnamurthy, N., Hansen, J. H., Babble Noise: Modeling,
Analysis, and Applications, IEEE transactions on
audio, speech, and language processing, 17(7), 1394-
1407.
Lee, H., 2014. Foundations of applied statistical methods.
Springer.
Leu, F. Y., and Lin, G. L., 2017. An MFCC-based speaker
identification system, 2017 IEEE 31st International
Conference on Advanced Information Networking and
Applications (AINA), IEEE, 1055-1062.
López, A. R., Seshadri, S., Juvela, L., Räsänen, O., Alku,
P., 2017. Speaking Style Conversion from Normal to
Lombard Speech Using a Glottal Vocoder and Bayesian
GMMs. In Interspeech (pp. 1363-1367).
Marxer, R., Barker, J., Alghamdi, N., & Maddock, S.
(2018). The impact of the Lombard effect on audio and
visual speech recognition systems. Speech
Communication, 100, 58-68.
McAulay, R., Quatieri, T., 1986. Speech analysis/synthesis
based on a sinusoidal representation, IEEE
Transactions on Acoustics, Speech, and Signal
Processing, 34(4), 744-754.
Pyž, G., Šimonytė V., Slivinskas V., 2014. Developing
models of Lithuanian speech vowels and semivowels,
Informatica, 25(1), 55-72.
Raitio, T., Suni, A., Vainio, M., Alku, P., 2011. Analysis of
HMM-based Lombard speech synthesis. In Twelfth
Annual Conference of the International Speech
Communication Association.
Rosner, A., Kostek, B., 2018. Automatic music genre
classification based on musical instrument track
separation, Journal of Intelligent Information Systems,
50(2), 363-384, DOI:10.1007/s10844-017-0464-5.
Rosner, A., Schuller, B., Kostek, B., 2014. Classification of
Music Genres Based on Music Separation into
Harmonic and Drum Components, Archives of
Acoustics, 39(4), 629-638, DOI: 10.2478/aoa-2014-
0068
Serra, X., 1997. Musical Sound Modeling with Sinusoids
plus Noise, In C. Roads, S. Pope, A. Picialli, G. De Poli,
editors: “Musical Signal Processing”. Swets &
Zeitlinger Publishers. 91-122.
Slivinskas, V., Šimonytė, V., 2009. Modelling of a
mechanical system using output data of the hammer
blow sequence response. Journal of Vibroengineering,
11(1), 120-129.
Summers, W. V., Pisoni, D. B., Bernacki, R. H., Pedlow,
R. I., Stokes, M. A., 1988. Effects of noise on speech
production: Acoustic and perceptual analyses, The
Journal of the Acoustical Society of America, 84(3),
917-928.
Suni, A., Karhila, R., Raitio, T., Kurimo, M., Vainio, M.,
Alku, P., 2013. Lombard modified text-to-speech
synthesis for improved intelligibility: submission for
the hurricane challenge 2013. In Interspeech (pp. 3562-
3566).
Vlaj, D., Kačič, Z., 2011. The Influence of Lombard Effect
on Speech Recognition, Speech Technologies. In Tech.
https://www.intechopen.com/books/speech-
technologies/the-influence-of-lombard-effect-on-
speech-recognition (accessed February 2019).
Zollinger, S. A., Brumm, H., 2011. The Lombard effect.
Current Biology, 21(16), R614-R615.
An Attempt to Create Speech Synthesis Model That Retains Lombard Effect Characteristics
289
