Optimal Driving Profiles in Railway Systems based on Data
Envelopment Analysis
Achilleas Achilleos
1
, Markos Anastasopoulos
2
, Anna Tzanakaki
3,2
, Marius Iordache
4
,
Olivier Langlois
4
, Jean-Francois Pheulpin
4
and Dimitra Simeonidou
2
1
Institute of Accelerating Systems and Applications, Athens, Greece
2
Department of Electrical and Electronic Engineering, University of Bristol, U.K.
3
Department of Physics, National and Kapodistrian University of Athens, Greece
4
Alstom SA, France
Keywords: Smart Energy Metering, Data Envelopment Analysis, Optimal Driving Profiles, Railway System.
Abstract: The present study focuses on the development of a dynamically re-configurable Information Communication
Technology (ICT) infrastructure to support the sustainable development of railway network. Once data have
been collected, the extracted knowledge is used to develop a set of applications that can improve the energy
efficient operation of railway systems. A typical example includes the identification of the optimal driving
profiles in terms of energy consumption. In the present study, this is achieved through the adoption of an
optimization framework based on Data Envelopment Analysis (DEA). The performance of the proposed
scheme is evaluated based on actual data collected at an operation tramway system. Preliminary results
illustrate that when the proposed method is applied, a 10% reduction in the overall power consumption can
be achieved.
1 INTRODUCTION
The present study focuses on the identification of the
optimal driving profiles on tramway systems. To
achieve this, an experimental campaign has been
carried out to measure various parameters from an
operational tramway system. Data for this study was
collected via a dynamically re-configurable
Information Communication Technology (ICT)
infrastructure
to facilitate both the operation and the
Data Centers
Internet
EPC
PDN-
GW
Data Centers
vBBU
vBBU
RRH
RRH
Mobile Network Operator #1 Mobile Network Operator #2
LTE
z
LTE
LTE WiFi
Multi-technology Access Network
P-S GW/
GSN
Metro/Core
Optical
RRH
RRH
Heterogeneous Transport
Network
EventsWeather
Facilities
Sensors
Devices
MQTT, AMQP,
STOMP
Rest
APIs
CoAP
Storage
Processing
Analytics
Data Management Platform
1
2
3
LTE Macro
cell
SDN Controller
Management & Orchestration Services
Control
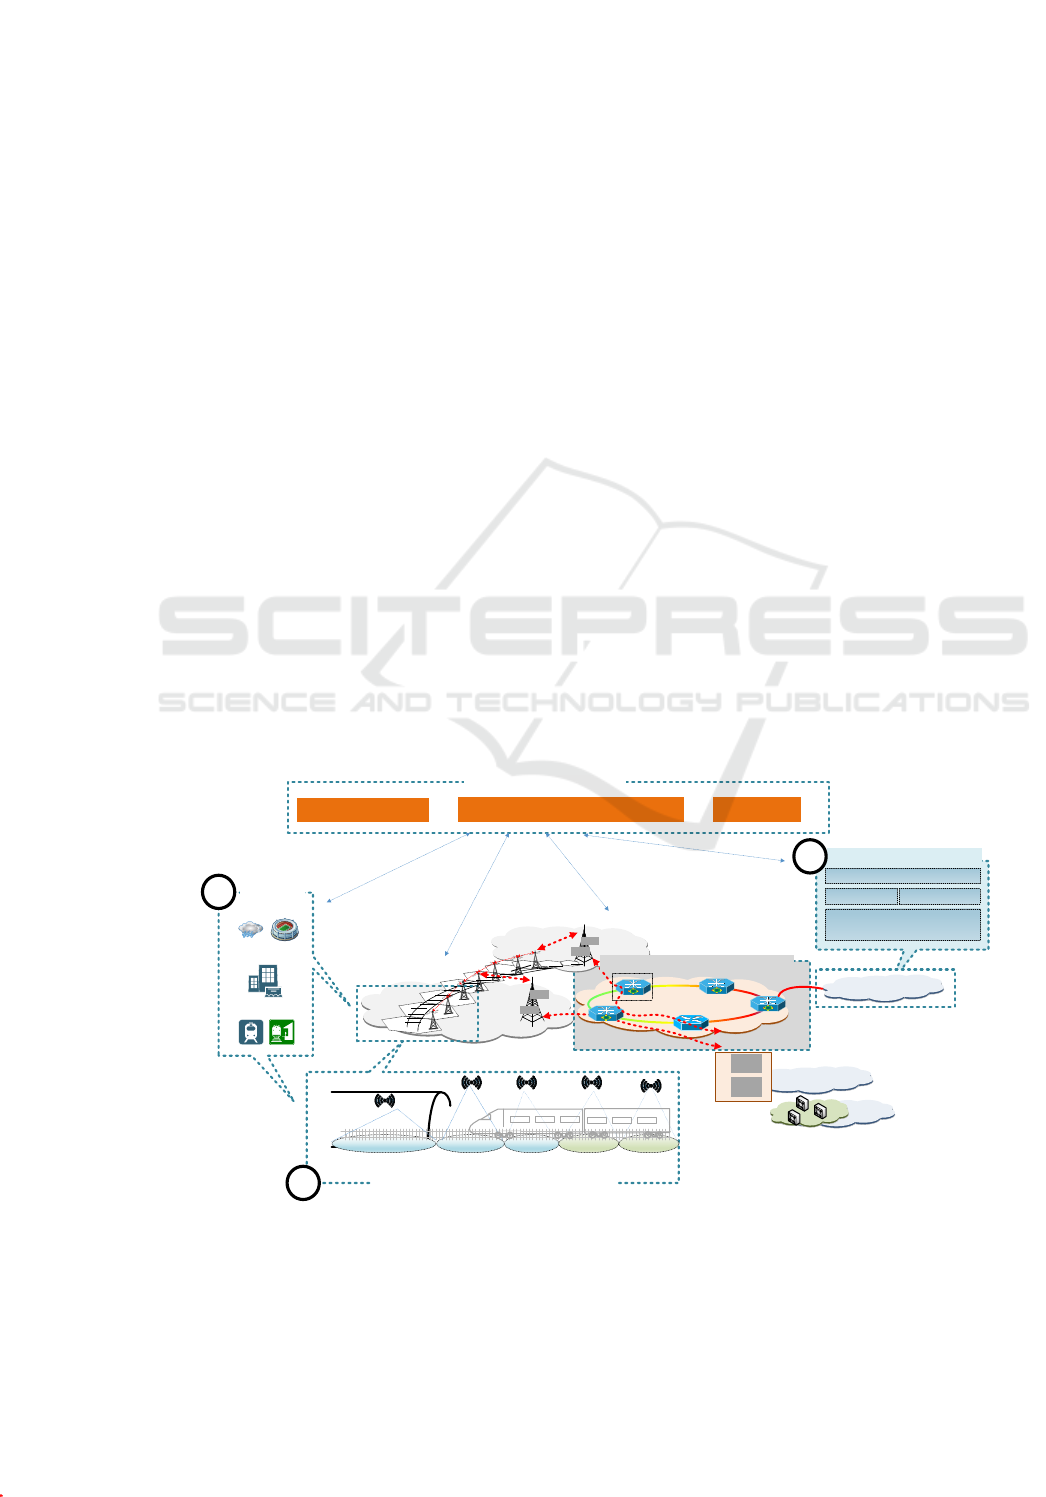
Figure 1: Converged Heterogeneous Network and Compute Infrastructures supporting railway services: Use case where data
are collected from various devices (1) are transmitted over a 5G network (2) to the cloud-based data management platform (3).
254
Achilleos, A., Anastasopoulos, M., Tzanakaki, A., Iordache, M., Langlois, O., Pheulpin, J. and Simeonidou, D.
Optimal Driving Profiles in Railway Systems based on Data Envelopment Analysis.
DOI: 10.5220/0007878000002179
In Proceedings of the 5th International Conference on Vehicle Technology and Intelligent Transport Systems (VEHITS 2019), pages 254-259
ISBN: 978-989-758-374-2; ISSN: 2184-495X
Copyright
c
2022 by SCITEPRESS – Science and Technology Publications, Lda. All rights reserved

end-user services supported by the railway network.
Despite the recent progress in railway smart metering
solutions and the implementation of several
experimental trials, optimal operation of the ICT
network supporting the power grid remains an
unsolved challenge, even in the case where
monitoring is limited to the rolling stock. The same
holds for the interoperability between different
heterogeneous network segments, which are currently
static and unaware of each other. As a result, Railway
System Operators (RSOs) are faced with a number of
options for building their ICT networks but are
limited by their inability to dynamically reconfigure
the network infrastructure according to their
operational and business needs and the lack of
benchmarking information between possible
solutions.
In response to these challenges we propose a
smart metering system that monitors the energy flows
of the whole railway systems and identifies the
optimal performance/cost trade-offs on the fly. This
is achieved through the deployment of an advanced
open Operational Data Management (ODM) platform
that comprises the following core elements
Anastasopoulos (2018):
a) A heterogeneous secure and resilient
telecommunication platform, consisting of both
wireless (e.g. Long Term Evolution – LTE, WiFi,
Satellite) and wireline (e.g. optical) systems
converging energy and telecom services. This
infrastructure is used to interconnect a plethora of
monitoring devices and end-users to the
Operational Control Center (OCC).
b) A platform that relies on a hybrid data storage and
processing mechanism combining state-of-the art
open source SQL/Non-SQL databases as well as
batch and stream processing engines. Based on the
characteristics of the collected data and the
selected applications, data are dynamically
forwarded to the most suitable storage/processing
platform. A high-level view of this process is
shown in Figure 1.
Once information has been collected, the
extracted knowledge is used to support a set of
applications that can improve the energy efficient
operation of railway systems. A typical example
includes the identification of the optimal driving
profiles in terms of energy consumption. In the
present study, this is achieved through the adoption of
an optimization framework based on Data
Envelopment Analysis (DEA). The performance of
the proposed scheme is evaluated based on actual data
collected from an operational tramway system. The
rest of the paper is organized as follows. Section 2
outlines the objectives of the proposed study, Section
3 gives a brief overview of the state of the art on the
subject, the research methodology along with a
description of the proposed scheme is provided in
Section 4. Finally, Section 5 concludes the paper.
2 OUTLINE OF OBJECTIVES
The main objective of this study is to improve the
energy efficient operation of tramway systems
through the identification of the optimal driving
profiles. To achieve this, a smart metering system has
been deployed monitoring energy, kinematic and
environmental parameters of an operational tramway
system based on sensing equipment installed both on-
board and at the trackside. Once data have been
collected and stored at the ODM system, an
optimization framework based on DEA has been
developed allowing the identification of the optimal
driving styles. The objective of this approach is to
identify driving styles that minimize the consumed
energy subject to set of constraints related to
scheduling, capacity and environmental conditions.
3 STATE OF THE ART
The problem of identifying optimal driving styles in
railway systems has been extensively studied over the
last years and a plethora of solutions have been
proposed. These include offline techniques based on
Integer Linear Programming (
Gallo, 2015), schemes
exploiting analytical kinematic equations and online
algorithms using Machine Learning techniques
(
Zhang, 2019). Another approach relies on the
Dynamic Programming Optimization Method
proposed in (Mensing, 2011). Other studies minimize
energy using Particle Swarm Optimization for a
catenary-free mass transit system (Chang, 1997).
In this work, a different approach compared to the
state-of-the art is adopted based on DEA. DEA can be
effectively applied to the railway sector to improve
service efficiency. Based on DEA, a linear
programming model can be developed that can
identify driving styles which can produce more output
(i.e. transfer a larger number of passengers in shorter
times) with less input requirements (i.e. power
consumption).
Optimal Driving Profiles in Railway Systems based on Data Envelopment Analysis
255
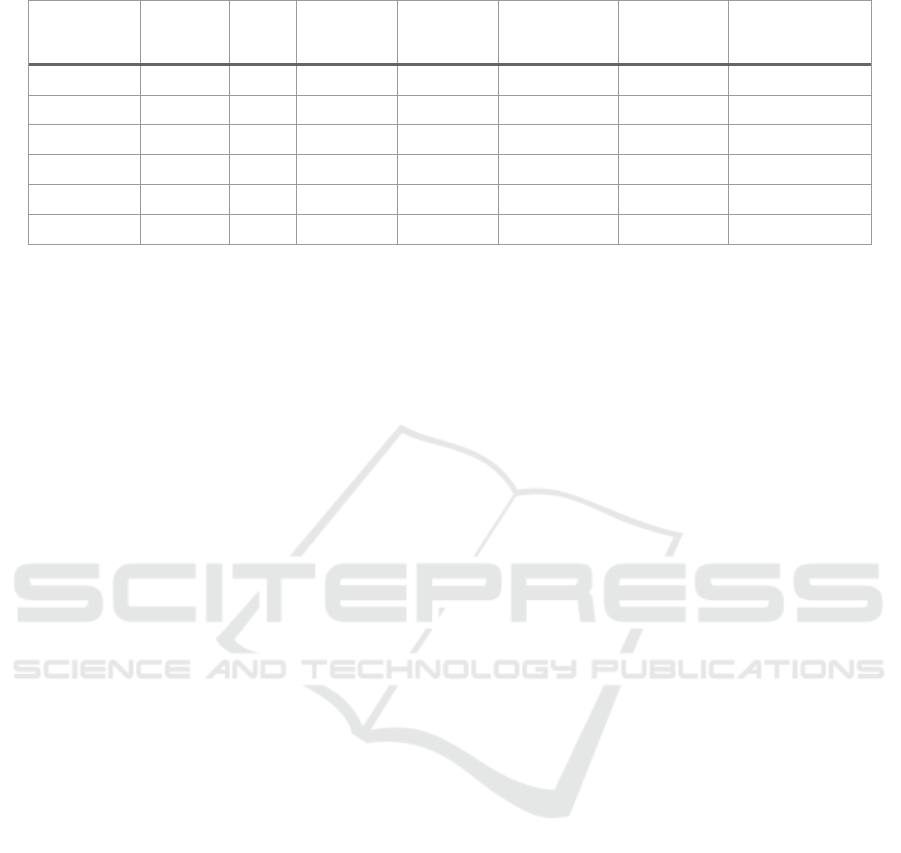
Table 1: Sample of the collected dataset.
Timestamp External
Temp
Speed Current
HVAC C2
Voltage
(catenary)
Current
(Ventilation)
Voltage
HVAC
Total
Energy
Panto
g
ra
p
h
°C km/h A V A V kWh
1442729913 10.8 43 15.6 892 38.7 449.32 37.0573402
1442729914 10.8 40.8 15.6 891 37.9 449.28 37.00736674
1442729915 10.7 38.9 15.6 869 38.2 449.55 36.95579201
1442729916 10.7 36.9 15.6 874 38.2 449.64 36.90263086
1442729917 10.8 35.1 15.6 855 39.5 449.73 36.85689206
4 METHODOLOGY
4.1 Data Collection Process
To improve energy efficient operation of railway
systems, initially, an ODM platform has been
deployed enabling data collection and processing of
information obtained from a variety of sensors and
devices. This platform comprises a communication
segment that relies on a set of optical and wireless
network technologies to interconnect a variety of end-
devices and compute resources. Through this
approach, data obtained from various sources
(monitoring devices, users and social media) can be
dynamically and in real-time directed to the OCC for
processing. The wireless technologies comprise
cellular WiFi, LiFi and LTE networks to provide the
on-board and on-board to trackside connectivity. For
the trackside the to the OCC segment, information is
transferred over an optical network. The overall
solution is shown in Figure 1. As mentioned above,
this platform is used to monitor a variety of
parameters. An indicative sample of the collected
measurements is provided in Table 1. This dataset
includes information related to the geographic
location of the rolling stock, on-board CO2 levels that
is used to estimate the number of passengers, internal
and external temperature that is important for the
evaluation of the Heating Ventilation and Air-
conditioning system’s (HVAC) performance,
kinematic parameters (including acceleration and
speed) etc.
The smart metering solution also comprises an
Information Technology (IT) segment that is
responsible for the storage and processing of the
measurements. Storage is accommodated by hybrid
mechanism combining state-of-the-art open source
SQL/NoSQL databases while processing is executing
based on Apache Spark. Using purposely developed
algorithms, knowledge can be extracted from the
dataset which can assist railway system operators to
identify optimal train driving and scheduling profiles.
4.2 Model Description
In the present study, identification of the optimal
driving profiles is performed using DEA. DEA is a
very powerful service management and
benchmarking technique originally developed by
Chames, Cooper and Rhodes (1978) to evaluate non-
profit and public sector organizations. This is
achieved by measuring the productive efficiency of
the construction elements of these organizations,
namely, decision-making units (DMUs). DEA can
measure how efficiently a DMU uses the resources
available to generate a set of outputs. The
performance of DMUs is assessed using the concept
of efficiency or productivity defined as a ratio of total
outputs to total inputs. Note that efficiencies
estimated using DEA are relative, that is, relative to
the best performing DMU or DMUs (if multiple
DMUs are the most efficient). The most efficient
DMU is assigned an efficiency score of 1, and the
performance of other DMUs vary between 0 and 1
relative to the best performance.
To apply DEA in railway environments, driving
styles are treated as DMUs. Now, let 𝑆 be the set of
driving styles extracted from the dataset with 𝐗
,𝑖∈
𝑆, being the vector of inputs of style 𝑖 , with 𝑁
elements 𝑥
,𝑗∈𝑁. Let 𝐘
,𝑖∈𝑆 be corresponding
vector of outputs with size 𝑀 (𝐘
=[𝑦
,𝑦
,…,𝑦
].
Let also 𝐗
=[𝑥
,…𝑥
] be the inputs of the
driving style that we want to evaluate and 𝐘
=
[𝑦
,..,𝑦
] the output vector. Introducing
parameter λ
indicating the weight given to driving
style 𝑖 in its attempt to dominate Style 0, the measure
of efficiency 𝜃 of Style 0 is determined through the
solution of the following optimization problem:
VEHITS 2019 - 5th International Conference on Vehicle Technology and Intelligent Transport Systems
256
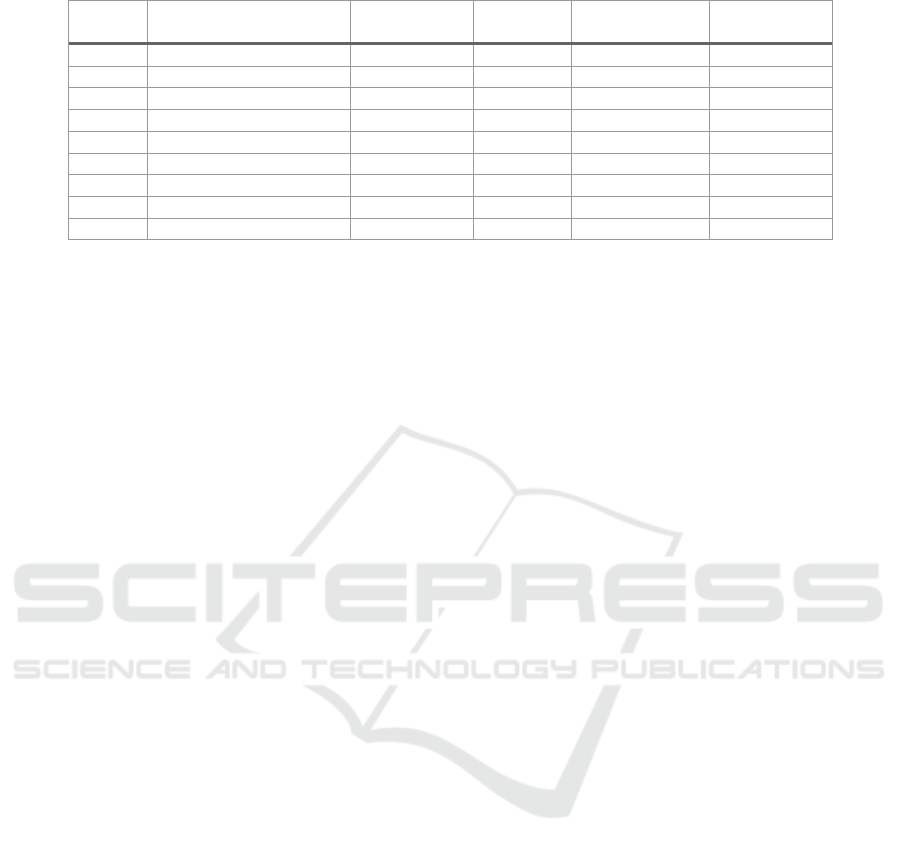
Table 2: Sample of 10 routes used for the identification of the optimal driving profiles.
StyleID Inter-station Travelling
Time (sec)
Total Energy
(KW)
HVAC
(KW)
CO2
(Average ppm)
Temperature
o
C
1 73 3139.2726 44.872627 47.979189 11.301351
2 77 2665.796 47.293833 38.555385 13.503846
3 73 4601.6475 29.122982 42.172973 14.404054
4 74 3397.467 45.642488 41.707368 14.797368
5 73 3146.8157 44.755127 45.322297 14.97973
6 77 3549.4091 307.04326 42.435443 15.134177
7 78 3334.6836 48.084032 42.387342 14.173418
8 75 3090.6305 45.894299 54.406974 13.892105
9 68 4883.8277 41.379654 46.720725 13.031884
𝑀𝑖𝑛 𝜃
Subject to
𝜆
𝑥
∈
≤𝜃𝑥
,∀𝑗 ∈ 𝑁 (1)
𝜆
𝑦
∈
≥𝑦
,∀𝑗 ∈ 𝑀 (2)
𝜆
≥0∀𝑖∈𝑆
Constraint (1) limits the inputs of all other driving
styles below the inputs used by the reference model
0, while equation (2) selects the driving styles that
outperform style 0. The above problem is solved for
all driving styles to identify the most efficient one.
In the present study, the optimal driving styles
have been calculated taking as inputs parameters
related to the in-cabin CO2 levels, the external
temperature, the total driving time between adjacent
stations, the total power consumption as measured by
the pantograph and the power consumed by the
HVAC system. An indicative sample of the
parameters characterizing the driving styles is
provided in Table 2, while the corresponding linear
programming (LP) formulation considering only the
first two styles is given below:
LP for evaluating Style 1:
min 𝜃
subject to
47.979189𝜆
+ 38.555385𝜆
+ 42.172973𝜆
≥ 47.979189𝜃 (3.1)
11.301351 𝜆
+ 13.503846𝜆
+ 14.404054𝜆
≤ 11.301351𝜃 (3.2)
3139.2726𝜆
+ 2665.796𝜆
+ 4601.6475𝐿3
≤ 3139.2726 (3.3)
44.872627𝜆
+ 47.293833𝜆
+ 291.22982𝜆
≤ 44.872627 (3.4)
73λ1 + 77λ
+ 73λ
≤ 73 (3.5)
λ
,λ
,λ
≥0
LP for evaluating Style 2:
min 𝜃
subject to
47.979189𝜆
+ 38.555385𝜆
+ 42.172973𝜆
≥ 38.555385𝜃 (4.1)
11.301351 𝜆
+ 13.503846𝜆
+ 14.404054𝜆
≤ 13.503846𝜃 (4.2)
3139.2726𝜆
+ 2665.796𝜆
+ 4601.6475𝐿3
≤ 2665.796 (4.3)
44.872627𝜆
+ 47.293833𝜆
+ 291.22982𝜆
≤ 47.293833(4.4)
73λ1 + 77λ
+73λ
≤ 77 (4.5)
λ
,λ
,λ
≥0
4.3 Results
Solving the LP model for the styles shown in Table
2, the efficiency scores can be readily determined.
The relevant results are provided in Table 3.
A preliminary set of results indicating the driving
styles obtained when the DEA approach is adopted is
shown in Figure 2. When the system is optimized for
energy efficiency (green curve) the obtained driving
style is smooth. On the other hand, when the system
is optimized for shorter travelling times a higher
average speed and steeper acceleration levels are
Optimal Driving Profiles in Railway Systems based on Data Envelopment Analysis
257
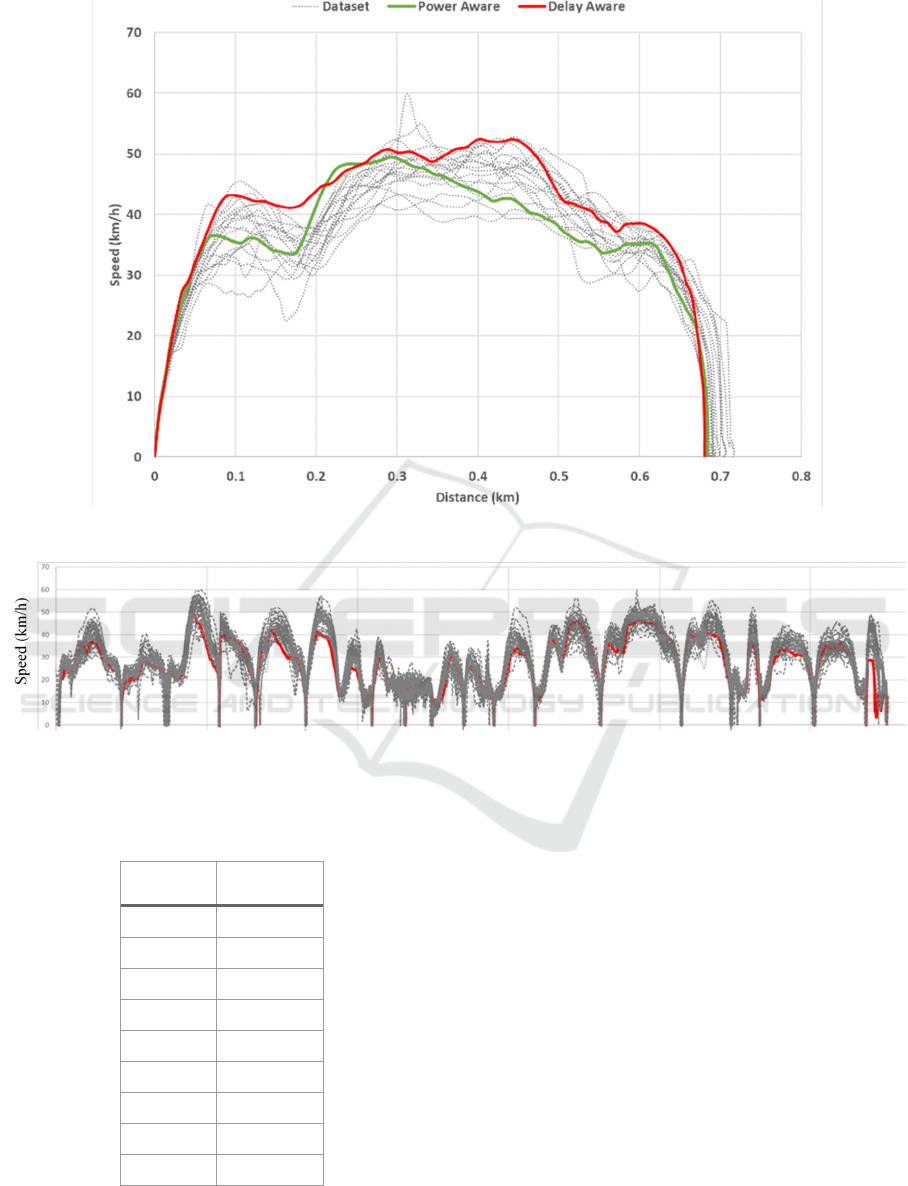
Figure 2: Tramway speed as a function KM distance for various driving profiles.
Figure 3: Optimal driving profile obtained when the DEA method is applied (red line) and comparison with styles obtained
from measurements (grey lines).
Table 3: Efficiency scores for the driving styles shown in
Table 2.
Style ID Efficiency
score
1 0.8099
2 0.7312
3 0.6887
4 0.6902
5 0.7649
6 0.6746
7 0.67
8 0.8975
9 0.819
observed. A similar set of results are shown in Figure
3 where the optimal profile that minimizes the power
consumption under end-to-end scheduling and
passengers’ constraints is illustrated. When the
proposed method is applied, a 10% reduction in the
overall power consumption can be achieved.
In the method followed, the fastest routes were
compared, those with the highest consumption and
those with the slowest routes, respectively. In
addition, the similar time routes were compared to
each other to arrive at the above results. For example,
we notice that routes 1 and 5 reach their destination at
the same time and have almost the same consumption,
total and ventilation. However, CO2 levels in the
cabin are higher in the case of the first route, so more
passengers are transferred. Therefore, it is reasonable
to get the result that route 1 is more efficient than
route 5. Additionally, we notice that route 8 is more
efficient than route 1. Also, in these routes the
VEHITS 2019 - 5th International Conference on Vehicle Technology and Intelligent Transport Systems
258

consumptions are similar, but we observe a
considerable increase CO2. As a result, the tramway
on route 8, with more passengers and lower
consumption, arrived later to the station compared to
route 1.
5 CONCLUSIONS
The present study proposed a modelling framework
based on Data Envelopment Analysis that aims at
identifying the optimal driving styles in terms of
energy efficiency of an operational tramway system.
To achieve this, in the first stage of the research, a
data management platform has been deployed
enabling collection and monitoring of energy,
kinematic and environmental parameters.
Preliminary results indicate that the proposed
approach can reduce the energy consumption in
railway systems by 10%. A main limitation of this
approach is related to its increased computational
complexity. To address this, in our future work the
DEA method will be coupled with machine learning
techniques to reduce the complexity of the ILP
formulations.
ACKNOWLEDGEMENT
In2Stempo project has received
funding from the Shift2Rail Joint
Undertaking under the European
Union's Horizon 2020 grant agreement no 777515.
REFERENCES
Anastasopoulos, M., Tzanakaki A., Iordache, M., Langlois,
O., Pheulpin, Jean-Francois, Simeonidou D. ICT
platforms in support of future railway systems, In proc
of TRA 2018, Vienna. 16-19 April 2018.
Chang C. and Sim, S. “Optimising train movements
through coast control using genetic algorithms,” IEE
Proceedings on Electric Power Applications, 1997, vol.
144, pp. 65–73.
Charnes, A., Cooper W., Rhodes. E., (1978) “Measuring the
efficiency of decision making units”, European Journal
of Operational Research, vol. 2, issue 6, 429-444
Cornuejols, G., Trick, M., (1998). Quantitative Methods
for the Management Sciences, Course Notes, Chapter
12, “Data Envelopment Analysis, [Online] https://
mat.gsia.cmu.edu/classes/QUANT/
De Martinis, V. Gallo, M., D’Acierno. L. “Estimating the
benefits of energy-efficient train driving strategies: a
model calibration with real data”.
Gallo, M., Simonelli, F., De Luca, G., and V. De Martinis,
"Estimating the effects of energy-efficient driving
profiles on railway consumption," 2015 IEEE 15th
International Conference on Environment and
Electrical Engineering (EEEIC), Rome, 2015, pp. 813-
818.
Huiru Zhang, Limin Jia, Li Wang, Xinyue Xu. (2019)
“Energy consumption optimization of train operation
for railway systems: Algorithm development and real-
world case study”. Journal of Cleaner Production 214,
pages 1024-1037.
Mensing, F., Trigui, R., Bideaux, E. "Vehicle trajectory
optimization for application in ECO-driving", Vehicle
Power and Propulsion Conference (VPPC), 2011, pp. 1-
6.
Powell, J.P. Palacín R. (2014) "A comparison of modelled
and real-life driving profiles for the simulation of
railway vehicle operation", NewRail – Centre for
Railway Research, Newcastle University, Newcastle
upon Tyne, UK
Optimal Driving Profiles in Railway Systems based on Data Envelopment Analysis
259
