
Collecting and Analysing Learners Data in a Massive Open Online
Course for Mathematics
Ana Azevedo
1
, Marisa Oliveira
2
, Alcinda Barreiras
2
, Jose Manuel Azevedo
1
, Graça Marcos
2
and
Hermínia Ferreira
2
1
CEOS.PP / ISCAP / P. PORTO, Instituto Politecnico do Porto, Portugal
2
Institute of Engineering of Porto, P. PORTO, Instituto Politecnico do Porto, Porto, Portugal
Keywords: Mathematics, MOOC, Computer-Aided Learning, Higher Education, Learning Analytics.
Abstract: Massive Open Online Courses (MOOCs) are online courses with an unlimited number of participants and no
entry requirements. Due to their massive and open nature, MOOCs have a high potential to offer access to
education to millions of people worldwide. However, there are several challenges in MOOCs such as huge
drop-out rates, improper automated assessments, diverse student engagement, and attention, etc. Learning
Analytics is “the measurement, collection, analysis, and reporting of data about learners and their contexts,
for purposes of understanding and optimizing learning and the environments in which it occurs” (Society of
Learning Analytics Research (SoLAR)) which can help us to contain such issues. This paper presents an initial
analysis, using descriptive analytics, of the students’ activity in a MOOC for Mathematics. The analysis
allowed the developers of the course to better understand some of the limitations and also some of the
strengths of the course in order to continuously adapt it to the users’ needs and interests.
1 INTRODUCTION
The emerging computer and network technologies
have changed the way we live, work, teach and learn.
The learning paradigm took advantage of the
emerging technologies in the development of
different education models, changing the teaching-
learning process (Oliveira et al., 2017). The use of
Information and Communication Technologies in
education is now seen as a pedagogical tool and the
basis of knowledge development. These technologies
are already radically changing the educational
environment. Applications, social networks, and
tablets are already a reality (Moran, 2013).
In the digital age, online courses have become
recognized learning tools, providing a method of
interactive and collaborative education. In this
context, it is through the Internet that the user can
develop new ideas and increase knowledge, sharing
experiences, information and practices. The history of
MOOCs is not very old. The acronym MOOC was
coined in 2008, to refer to the course ‘‘Connectivism
and Connective Knowledge’’ offered by Stephen
Downes and George Siemens. Following it, in 2011,
a few more educational videos were developed by the
professors from Stanford University and released
through open online platforms supported with free
web resources. Since then, MOOCs have steadily
increased their presence in digital learning becoming
an important trend. Simply explained, MOOCs are
online courses with unlimited number of participants
and no entry requirements. Due to their massive and
open nature, MOOCs have great potential to offer
access to education to millions of people worldwide.
Learning analytics, with the help of Big Data
Technologies, helps us to interpret humongous
MOOCs data to assess progress, predict performance
and identify problems (Laveti et al., 2017).
The Porto Declaration on European MOOCs
(Jansen, 2015) as a draft emerged on a conference that
had taken place in Porto, Portugal and encouraged the
growth of this type of training, which responds to the
demands of lifelong training and learning, in order to
support the guidelines of Paris OER Declaration of
UNESCO (2012). The growth of MOOCs has helped
institutions and societies more aware of the
possibilities and advantages of open and online
education (Jansen and Konings, 2017). Nowadays
there are available over 100 platforms offering
MOOCs. Thus the navigation can be quite
challenging for learners. Instructors, technicians and
even learners are discovering more about which
Azevedo, A., Oliveira, M., Barreiras, A., Azevedo, J., Marcos, G. and Ferreira, H.
Collecting and Analysing Learners Data in a Massive Open Online Course for Mathematics.
DOI: 10.5220/0007905306810688
In Proceedings of the 11th International Conference on Computer Supported Education (CSEDU 2019), pages 681-688
ISBN: 978-989-758-367-4
Copyright
c
2019 by SCITEPRESS – Science and Technology Publications, Lda. All rights reserved
681

techniques and methods to use for the best outcome.
MOOCs are a perfect tool for blending lectures with
technology (Tusk, 2015).
The growing investment that the Polytechnic of
Porto (P.PORTO) has done in the modernization of
pedagogical paradigms and informal education is also
achieved by encouraging teachers in the development
of MOOCs. In 2013 the Polytechnic of Porto
launched its own MOOC platform that allowed the
development of open courses and projects. The first
one that appears was “Math Without STRESS” or in
its original version in Portuguese, “Matemtica 100
STRESS”, that is operating since 2014 (Soares et al.,
2016). This first MOOC is a course oriented towards
undergraduate students who wish to prepare for the
national exam of Mathematics.
The e-Learning and Pedagogical Innovation Unit
of the Polytechnic of Porto (EIPP) has the mission of
promoting and supporting the usage of a vast array of
technologies in learning and education on “b” and “e-
learning” contexts. This unit allowed the academic
team the opportunity to explore new technology and
learning paradigms. The incorporation of the MOOCs
in the teaching of mathematics is presented as a
possibility to assist in consolidating the changes
presented above. Over the years the academic team
had developed several courses. We refer to the one
that had appeared in the scientific area of
mathematics that had various modules incorporated,
and it is called “Matemtica para Todos”
(Mathematics for All). This course includes several
courses, mini-courses and hybrid e-books that help to
prepare students for different exams to enter in the
university and other modules directed to support
curricular units of the undergraduate courses,
particularly those that cover the subjects of calculus,
statistics, and algebra.
With regard to university education, it is apparent
that students are in today’s digitally connected world,
able to access online learning materials and teachers
are no longer the only source of knowledge. Is
necessary to rethinking the established modes of
teaching and it can be done by including and combine
flexible teaching/resources like MOOCs that are self-
service resources.
The possibilities of using the MOOCs in the
classroom, as basic or complementary materials, aim
to motivate the students in the search for more
information and knowledge, make the classes become
more attractive and productive. Interactivity,
exchanges of experience with other students and
teachers, and the varied and collaborative forms of
problem-solving make MOOCs a significant tool in
the knowledge building process.
This paper presents an initial approach to the
analysis of a MOOC for Mathematics, using
descriptive analytics. This type of analytics aims at
understanding what happened and what is happening
as well as recognizing some underlying trends in the
data (Sharda, Delen and Turban, 2018). Thus, hereby
we present an initial analysis of the activities
developed by the users of the referred MOOC during
the last year period, in order to understand how it can
be improved to attract more users.
In the rest of the paper, we will start to present the
context of the research, describing the “Mathematics
for All – M23” MOOC. Following the method used
to obtain the results is explained. Next, the results are
presented and analyzed. The paper finishes with the
conclusion.
2 MATHEMATICS FOR ALL:
M23
The “Mathematics for All” is a Math project of the
Department of Mathematics of the School of
Engineering of Porto (ISEP) an organic unit of
P.PORTO (Polytechnic Institute of Porto). This
project arises because the use of new technologies of
teaching allows a greater variety of learning styles by
promoting a new and different way of learning,
depending on the individual differences of each one.
The use of different methods of knowledge and
didactic methods provides a more efficient teaching-
learning process. “Mathematics for All” uses several
technological resources available, mediated through
the internet as a source of interaction and
communication.
This project is structured in several courses, mini-
courses and hybrid e-books that are aimed for
different target audiences. “Mathematics for All –
M23” is a math MOOC included in this project and is
addressed for students who want to obtain in-depth
knowledge on subjects that are evaluated in the
specific Mathematics exam. This exam is necessary
for access to all the Schools of P.PORTO for people
of over 23 years old. This MOOC is also addressed to
higher education students that want to acquire
knowledge about all or some of the topics included in
the MOOC and also to individuals who want to
update their Math skills. The organization of courses
and mini-courses is modular, and the contents can be
used autonomously or as a complement.
Students evaluated in the Mathematics exam of
over 23 years with disabilities should be able to live
as independently as possible and participate in all
A2E 2019 - Special Session on Analytics in Educational Environments
682

aspects of life, including education (Sanchez-Gordon
et al., 2018). In this context, the presented MOOC is
truly accessible.
2.1 Objectives
“Mathematics for All – M23” contains a series of
modules that run entirely online and is open to anyone
to enroll in. It is an online self-study course that is
designed for students to use as their wish, for self-
study. Students can always use the resources as they
feel that it will help them to learn.
In this MOOC students will focus on topics that
are evaluated on the exam for accessing the Higher
Education of the Seniors of 23 years. They learn by
having a balance between theory and application,
leading students to understand key mathematical
concepts.
2.2 Contents and Sections
The complete course is composed of 10
modules/topics, and each topic is divided into several
subtopics. However, only the modules that best suit
each student can be chosen since they are independent
from each other. There are the following modules:
Module 1 - IR Operations
Module 2 - Operations with polynomials
Module 3 - Equations, Inequations, and Systems of
Equations
Module 4 - Functions
Module 5 - Polynomial, rational and irrational
functions
Module 6 - Understanding trigonometry
Module 7 - Trigonometric Functions
Module 8 - Exponential and logarithmic functions
Module 9 - Limits and continuity
Module 10 - Derivatives
These modules follow the topics evaluated in the
Mathematics exam referred above and are also
fundamental for other mathematics matters.
The information is available in the format of video
lessons, pdf documents or consolidation exercises,
tests for self-evaluation with randomized quizzes and
instant feedback. The questions can be numeric,
multiple choice, true/false or graphics. Note that, after
the submission of a test detailed feedback on the
errors and the correct resolution is presented. The
students can use the documents available or watch the
proposed video-lessons to consolidate the worked
knowledge. These activities aim to strengthen and
consolidate learning. In the end, students are able to
take a global test containing several questions related
to the course syllabus. After this, feedback is given to
inform the student about the performance achieved.
In all the resources there is a discussion forum-
"Sharing doubts," because we believe that during
learning there must be an interaction between trainees
and trainers.
3 EMPIRICAL STUDY
In this section we present the analysis that was
undertaken in order to better understand student’s
behavior when accessing the course, aiming at
understanding what happened and what is happening
as well as recognizing some underlying trends in the
data.
3.1 Method
In this study, we analyzed the users’ data using some
of the instruments installed in the project web site
implemented in Moodle, version 3.1. We did
quantitative analyses of the data. There were used the
default Moodle reports available for that version and
the plug-in Analytics graphs, which was installed in
the Moodle platform. Analytics graphs is a Moodle
plugin that provides five graphs that may facilitate the
identification of student profiles. Those graphs allow
the teacher to send messages to users according to
their behavior inside a course. Among other
possibilities, it stands out to click over graph elements
in order to send email to a group of students or to a
particular student. More detailed information about
this plugin can be found in the following link:
https://moodle.org/plugins/block_analytics_graphs.
Also, some data were collected and analyzed using
Excel
TM
.
The research questions were the following:
i) where do the students come from?
ii) how engaged were the students in the course?
iii) are there some of the contents more interesting
than others?
iv) is it important the day of the week when we want
to propose problems/tasks to be solved in a limited
time period?
v) have the goals been reached?
vi) are the materials available enough for the purpose
for which they were created?
All those questions guided a reflection around
students’ engagement and behavior and intend to
answer to a broader question about the effectiveness
of the course.
Collecting and Analysing Learners Data in a Massive Open Online Course for Mathematics
683
3.2 Results
The data refers to accesses beginning in September
2017, when the course was made available in this
platform. During that period 43 users were accessing
the system. At the moment there are 38 active users.
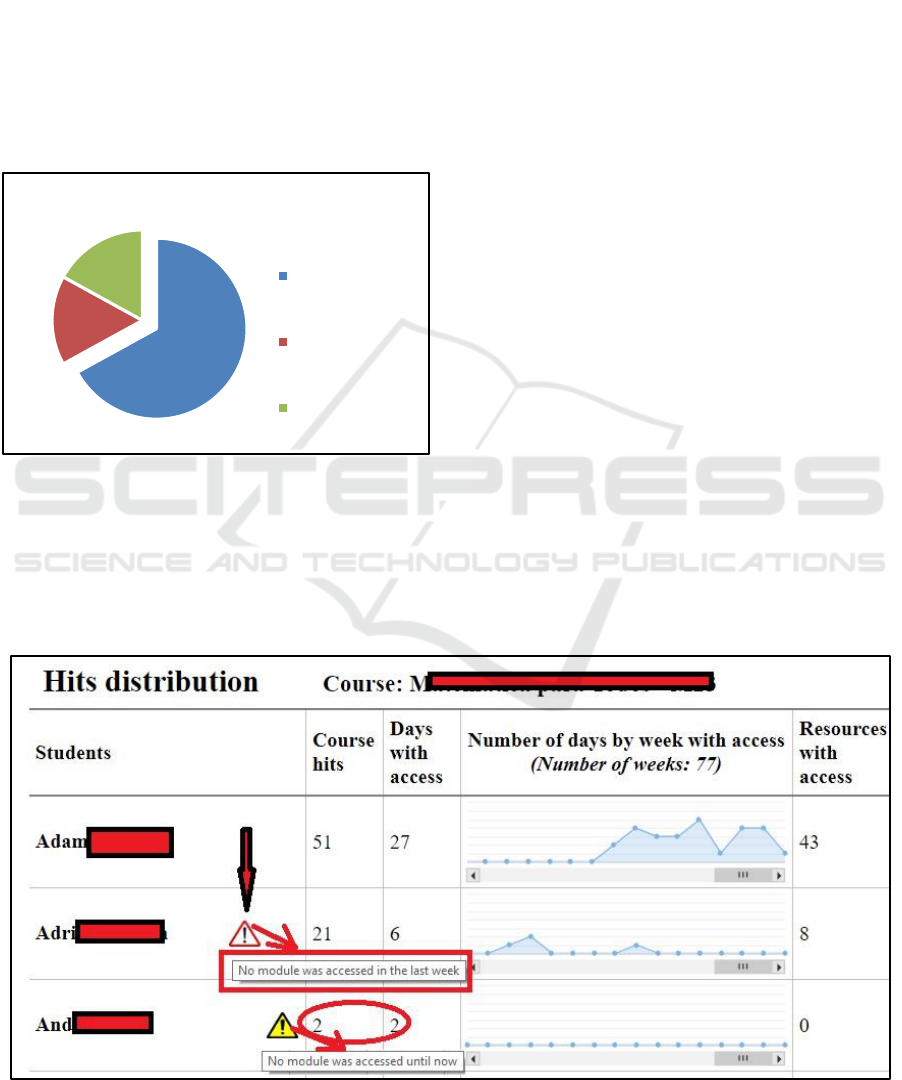
We start with the analysis of the geographical
origins of each student. In figure 1 we can observe
that the vast majority of the accesses (67%) are from
the Porto region. We also have accesses from other
countries other than Portugal (17%). This is
accordingly to the fact that most of the candidates to
the exam referred above are from the Porto region.
Figure 1: Geographical distribution of the IPs that accessed
the course.
3.2.1 Students’ Activity
Figure 2 presents an extract of the dashboard of the
accesses to the course and its resources in each week,
for the first three users in alphabetical order. This is
only a small part of the data available, which refers to
43 users.
Considering all the users’ data, we could see that
67 is the number of days for the user with more days
accessing the course. This user has got 306 course hits
and accessed 95 of the resources that are available in
the course. We can also see that 13 of the active users
have more than 20 days with accesses to the course.
We consider that this represents a reasonable
engagement in the course.
In the dashboard presented in figure 2, we have
several important elements that we would like to
emphasize.
Firstly, there are alerts for the students with no
accesses in the last week and also for the students with
no modules accessed yet (see highlights in figure 2).
Secondly, at the bottom of this dashboard (figure
3) there is the possibility of contacting by email the
users with no accesses. This is an important
functionality that the teachers should explore more,
as a tool to improve students’ engagement.
The analysis of the time frame presented in the fourth
column allows us to see that in general the frequency
of the accesses increases when the exam is
approaching, which can be considered a normal
situation.
This is emphasized by the activity graph presented
in Figure. It can also be seen that the students actively
participate in the course since there are several posts
from as well as visualizations. In this figure, we can
also see that the activity for this year improved
significantly when compared to last years’ activity.
An analysis of the distributions of the accesses to
the several contents of the course was also made. It was
Figure 2: How each user is accessing the course and its resources in each course week.
67%
16%
17%
Percentage of acess by IP
Porto
Other countries
Others Regions
of Portugal
A2E 2019 - Special Session on Analytics in Educational Environments
684
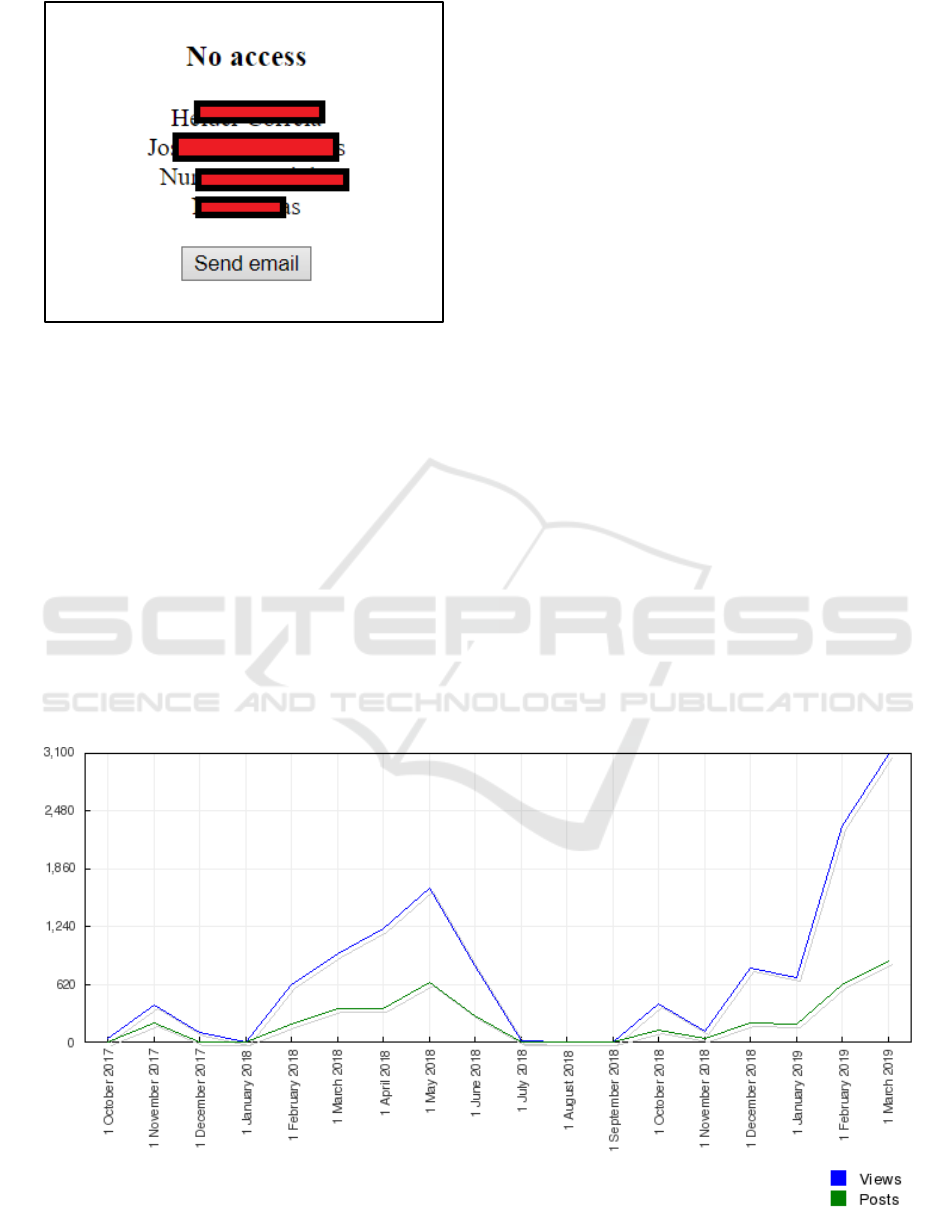
Figure 3: Bottom of the dashboard with of the accesses to
the course and its resources in each week.
verified that all the resources had at least three users
accessing it (1 self-assessment test from the last
module of the course). The resources with more users
accessing it were the ones from the first modules, and
the number of users accessing the resources decreases
along the following modules. This can signify that the
users sequentially go along the course, and some of
them give up some way in the path. This is not positive,
despite could be considered normal in MOOC courses,
but the teachers need to find some strategies to solve
this problem.
We made a deeper analysis of the resource forum,
which is made available to share doubts. Teachers
regularly support the students and give regular
feedback to the students. This forum has got 19
students accessing it, and 24 that do not access it.
There is a functionality of the plugin easily
allowing to contact by email the students with no
accesses to the forum or to other specific activity. This
can be used as a strategy to keep in touch with less
engaged students inviting them to access the course
more often. Also, there is the possibility of contacting
the students that already accessed some specific
activity. This functionality can be used to contact those
users expressing positive feelings by the fact that they
accessed that activity and inviting them to access other
activities, for instance, inviting the users to access self-
assessment test after accessing a tutorial. These regular
contacts are simple strategies to help the users
maintaining contact with the course, thus increasing
their engagement in the course.
Considering the number of accesses by module Table
1), we can confirm that the most accessed modules are
the first five modules, and there can be observed a
decrease along the modules 1 to 10, except for modules
4 and 5. We emphasize that the first module can be
considered as a special one since its contents serve as
the foundation for all the other ones. This fact can
explain why its number of accesses almost doubles
when we compare it with the number of accesses of the
other modules.
Considering the hours of the day with activity from
the users in the last year (Figure), we can conclude
that the users access the course mainly at the evening
and night, with a peak at 22:00. This is consistent with
Figure 4: All activities (views and posts) of the users.
Collecting and Analysing Learners Data in a Massive Open Online Course for Mathematics
685
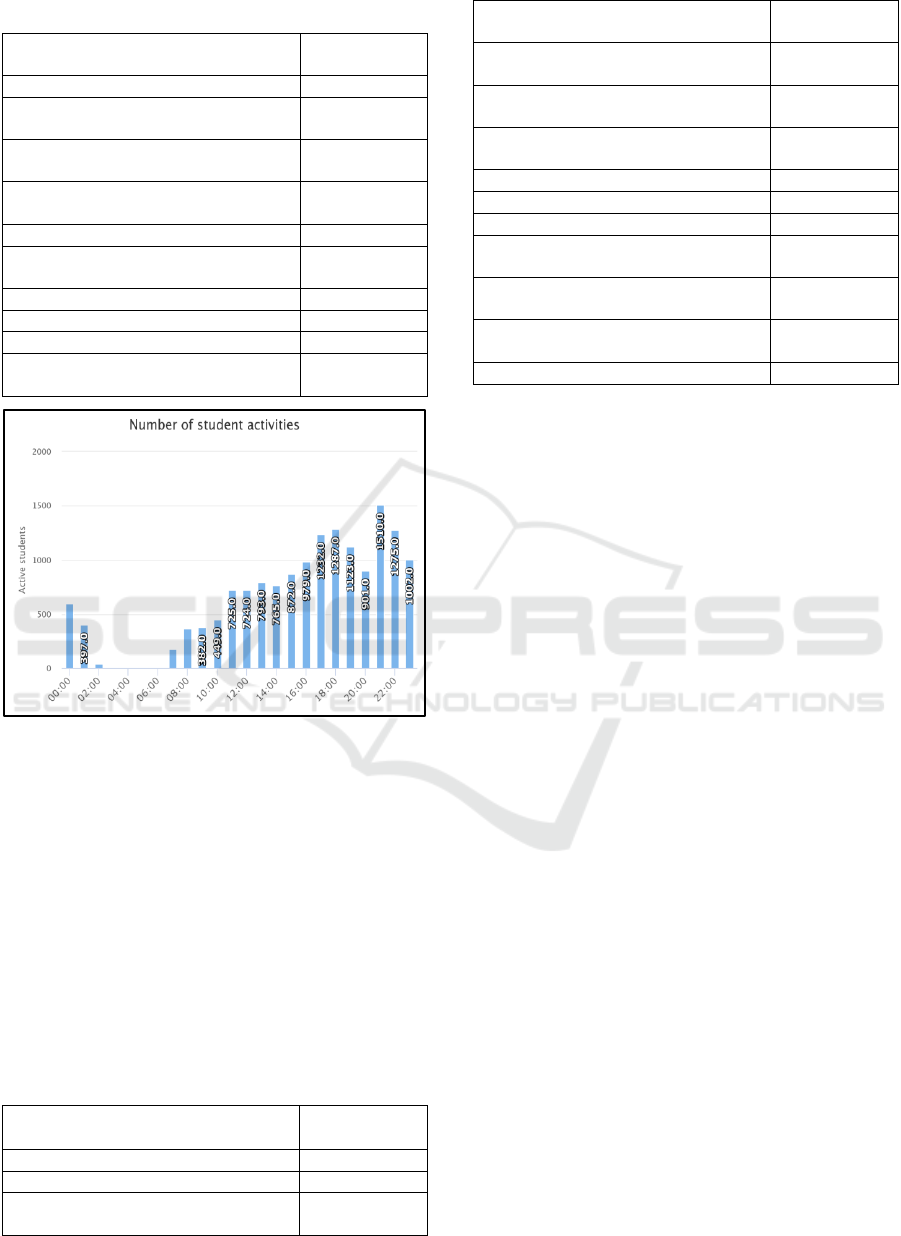
Table 1: Most accessed modules.
Modules
Nº of
Accesses
Module 1 - IR Operations
2567
Module 2 - Operations with
polynomials
1416
Module 3 - Equations, Inequations,
and Systems of Equations
1318
Module 5 - Polynomial, rational and
irrational functions
1124
Module 4 - Functions
1097
Module 6 – Understanding
trigonometry
545
Module 7 - Trigonometric Functions
440
Module 9 - Limits and continuity
424
Module 10 - Derivatives
308
Module 8 - Exponential and
logarithmic functions
219
Figure 5: Number of student activities by hour of the day
during the last year.
the fact that most of the students doing the exam
referred above are already in the working market, thus
do not have time available for studying during the day,
thus realizing more activities during after working
hours.
As for the most accessed activities by total duration
in hours we can observe, in Table 2, that tests were the
most accessed ones as well as some of the tutorials.
Since tests have no limited time to be completed, we
can say that the students take a long time to complete
those tests.
Table 2: Most accessed activities by total duration in hours.
Activities
Duration in
hours
Teste: Teste de auto-avaliação
363 days, 15h
Teste: Teste de avaliação_7
361 days, 1h
Ficheiro: Equações do 2.º grau -
tutorial
360 days, 8h
Ficheiro: Inquações do 2.º grau -
tutorial
359 days, 23h
Ficheiro: Equações do 1.º grau -
tutorial
359 days, 9h
Ficheiro: Polinómios e igualdade de
polinómios - tutorial
358 days, 10h
Ficheiro: Inequações do 1.º grau -
tutorial_1
355 days, 12h
Teste: Teste de avaliação_2
354 days
Teste: Teste de auto_avaliação
353 days, 6h
Ficheiro: Introdução às funções 2
353 days, 3h
Ficheiro: Generalidades sobre
funções - tutorial
350 days, 18h
Ficheiro: Funções Trigonométricas 5
- tutorial
349 days, 21h
Ficheiro: Derivada de uma função
num ponto - tutorial
349 days, 11h
Teste: Teste de auto-avaliação
349 days
3.2.2 Assessment Tests
There are several tests with multiple-choice questions
(MCQ), that allow the users to do their self-
assessment. MCQ have several advantages and also
some limitations but are useful to assess knowledge
acquisition (Azevedo et al. 2019), thus were
considered by the teachers has the ideal type of
questions to use in the course. The tests are randomly
generated using a bank of MCQ, thus allowing the
students to test their knowledge acquisitions several
times with different questions.
When analyzing the distribution of the
assessments, we only consider the tests available at
the end of the first seven modules. We do not consider
the tests of the last three modules since the number of
attempts was very reduced.
Figure presents the distribution of these seven
tests. For tests 1, 4, and 6 all the users got grades
above 50%. For tests 2 and 3, 75% of the users got
grades above 50%. For tests 1, 2, 3, 5, and 6 the
median is above 75%, and for test 4 the median is very
close to that value. For the test in module 7, 50% of
the users got grades above 50%, but the difference
between the 1
st
quartile and the 3
rd
quartile is very big,
being that the 3
rd
quartile is below 75% and the
median is about 50%. Module 7 concerns
trigonometric functions, which is usually a subject
that presents many difficulties to the students.
A2E 2019 - Special Session on Analytics in Educational Environments
686
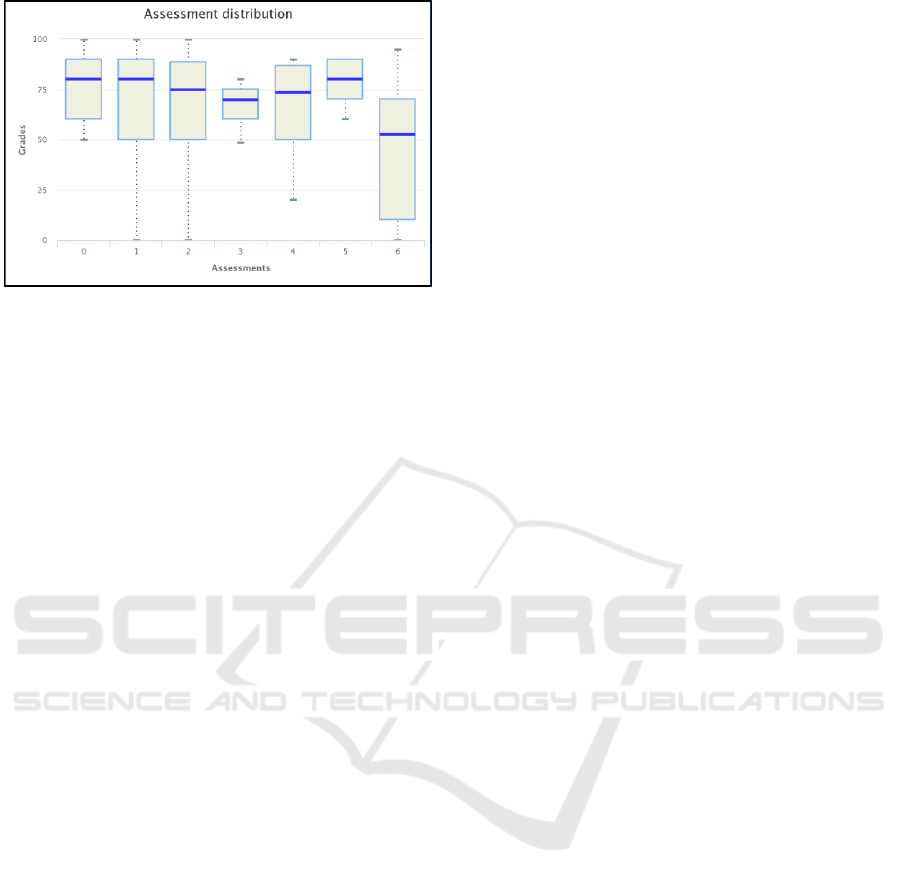
Figure 6: Distributions of the grades of the assessments.
3.2.3 Results in the Exam
Considering that the course is mainly addressed for
students that are evaluated in the specific
Mathematics exam necessary for the access to all the
Schools of P.PORTO for people of over 23 years old,
we compared the grades obtained in that exam of the
examinees that enrolled in the MOOC course and
those that do not. The median of the grades for the
group that enrolled in the MOOC course was slightly
higher when compared with the median of the other
group (8.2 and 7, respectively). Considering that the
number of students of the first group is very smaller
when compared to the number of students of the other
group, that the samples are independent and
homogeneous in variances, and that the smaller group
strongly deviates from normal distribution we applied
the Man-Witten test. Nevertheless, no statistical
evidence was found out for that difference.
4 CONCLUSION
Massive Open Online Courses bring education
opportunities to huge audiences. Understanding how
students learn within MOOCs is very important.
Learning Analytics is becoming very popular for this
type of analyses. In this paper, we presented some
descriptive learning analytics instruments, that can
help to improve students engagement and learning in
a MOOC course.
This paper constitutes an important initial
reflection for the teachers that develop the course that
is available for around one and a half years. It was
very stimulating to verify that the number of students
using the platform is steadily increasing in the last
year. Also, the level of activity in the course is very
reasonable. It was possible to better understand the
type of activity developed by the user of the MOOC.
One useful finding was that all the resources were
already accessed, despite some of them having low
levels of accesses.
Most of the students’ accesses the course from
areas around Porto, which is accordingly to the type
of students usually attending the exam for which the
MOOC is aimed at.
One important finding was that the users
sequentially go along the course, and some of them
give up some way in the path. This is not positive,
despite it could be considered normal in MOOC
courses. The tools provide useful functionalities to
contact the users of the MOOC course through email.
Maintaining these contacts regularly is a
straightforward strategy that can help the users
maintaining contact with the course, thus increasing
their engagement.
The MCQ test presented good levels in the grades
obtained by the students, so we can consider that there
was a good level of knowledge acquisition from the
students. Nevertheless, we intend to do a deeper
analysis of the quality of the questions, using
appropriate techniques such as Classical Test Theory
or Item Response Theory. These type of analysis are
very important to ascertain if the tests are accurately
measuring what they intend to measure.
Concerning the exam, only a few students that
enrolled in the MOOC course attended the exam
when compared to the ones that do not enroll in the
MOOC course. The examinees that were enrolled in
the MOOC course obtained slightly better grades,
despite no statistical evidence was found for the
differences. Despite that this was promising.
Considering that only one exam was done during the
time the course is available, we intend to increase the
number of users in the course as well as the level of
the activity for all the modules available. That way,
we expect to be able to get to some better conclusions.
In the future, we are also planning to inquiry the
students about the reason for accessing this type of
resources. This can be done with the introduction of a
questionnaire with a simple question in the first
access, just before allowing the access to the course
materials.
We are also planning to implement predictive
analytics and other analytics tools that can help us to
better understand how the course can be improved to
attract more users and improve their levels of
engagement.
Collecting and Analysing Learners Data in a Massive Open Online Course for Mathematics
687

REFERENCES
Azevedo, A., Marcos, G., Ferreira, H., Vaz de Carvalho, C.,
Oliveira, M. and Barreiras, A., 2017. Collecting and
Analysing Learners Data to Support the Adaptive
Engine of OPERA, a Learning System for
Mathematics. 1(Csedu), pp. 631–638. doi:
10.5220/0006389806310638.
Azevedo, J., Oliveira, E. P. and Beites, P. D., 2019. E-
Assessment and Multiple-Choice Questions. In
Azevedo, A. and Azevedo, J. (eds.) Handbook of
Research on E-Assessment in Higher Education.
Hershey, PA: IGI Global, pp. 1–27. doi: 10.4018/978-
1-5225-5936-8.ch001.
Jansen, D., 2015. The Porto Declaration on European
MOOCs. EADTU - European Association of Distance
Teaching Universities. Available at:
http://www.eadtu.eu/images/News/Porto_Declaration_
on_European_MOOCs_Final.pdf.
Jansen, D. and Konings, L., 2017. MOOC Strategies of
European Institutions. European Association of
Distance Teaching Universities. Available at:
https://oerknowledgecloud.org/sites/oerknowledgeclou
d.org/files/MOOC_Strategies_of_European_Institutio
ns.pdf.
Laveti, R. N., Kuppili, S., Ch, J., Pal, S. N. and Babu, N. S.
C., 2017. Implementation of learning analytics
framework for MOOCs using state-of-the-art in-
memory computing. In 2017 5th National Conference
on E-Learning E-Learning Technologies
(ELELTECH), pp. 1–6. doi:
10.1109/ELELTECH.2017.8074997.
Moran, J. M., 2013. Ensino e aprendizagem inovadores
com apoio de tecnologias. In MORAN, J. M.,
MASETTO, M. T., and BEHRENS, M. A. (eds.) Novas
tecnologias e mediação pedagógica. 21.
a
. Campinas:
Papirus editora, pp. 11–65.
Sanchez-Gordon, S. and Luján-Mora, S., 2018. Research
challenges in accessible MOOCs: a systematic
literature review 2008--2016. Universal Access in the
Information Society, 17(4), pp. 775–789. doi:
10.1007/s10209-017-0531-2.
Sharda, R., Delen, D. and Turban, E., 2018. Business
Intelligence, Analytics, and Data Science: A
Managerial Perspective. 4th ed. Pearson.
Soares, F. and Lopes, A. P., 2016. TEACHING
MATHEMATICS USING MASSIVE OPEN ONLINE
COURSES. In, pp. 2635–2641. doi:
10.21125/inted.2016.1563.
Tusk, A., 2015. MOOCs – a game shifter in adult learning,
Epale. Available at: https://
ec.europa.eu/epale/en/blog/moocs-game-shifter-adult-
learning (Accessed: March 24, 2019).
UNESCO, 2012. Paris OER Declaration, WORLD OPEN
EDUCATIONAL RESOURCES (OER) CONGRESS
UNESCO. Available at:
http://www.unesco.org/new/fileadmin/MULTIMEDIA
/HQ/CI/CI/pdf/Events/English_Paris_OER_Declaratio
n.pdf.
A2E 2019 - Special Session on Analytics in Educational Environments
688
