
A Simplified Finite Element Analysis Method for Axial Compression
Behavior of Rectangular Concrete Columns with Interlocking
Multi-spiral Reinforcements
Ping-Hsiung Wang
1a
and Kuo-Chun Chang
2b
1
National Center for Research on Earthquake Engineering, Taipei, Taiwan
2
Department of Civil Engineering, National Taiwan University, Taipei, Taiwan
Keywords: Concrete Column, Axial Compression Behavior, Confinement, Multi-spiral, Finite Element.
Abstract: This paper proposes a simplified finite element analysis method to analyze the axial compression behavior of
rectangular concrete columns confined by interlocking multi-spiral reinforcements. The proposed method
utilizes an elastic finite element analysis to approximate the distribution and ultimate state of confining stress
in each core concrete element, which is substituted into the Mander confined concrete model to obtain the
integrated compressive curve of a column. Verification of the proposed method against the test results of four
4-spiral and four 5-spiral reinforcement columns shows good agreement. Parametric studies focused on the
5-spiral reinforcement show that for the same amount of transverse reinforcement, a column with a larger
confined area, which closely depends on the radius ratio between the small and large spirals (
/
), can
receive a better axial load-carrying capacity and confinement efficiency. To achieve economic confinement
design, the volumetric ratio of large spirals to small spirals (
/
) to have the concurrent yielding of both
large and small spirals was found to be around 1.0, 0.8, and 0.7 for
/
= 1/2, 1/3, and 1/4, respectively.
1 INTRODUCTION
Using confinement by transverse reinforcement,
concrete columns can exhibit good ductile behavior
and enhanced strength under axial compression. The
efficiency of the confinement effect is dependent on
the configuration of the confining steel as the effect is
triggered passively with the lateral expansion of the
confined concrete core. To fit the shape of the column
section, tie reinforcements are generally used in
rectangular columns while spirals or circular hoops
are applied to circular columns. It is well recognized
that the tie reinforcement is less efficient than the
spiral or circular hoop, since the arching action of the
former forms vertically between the levels of
transverse steels and also horizontally between the
tied longitudinal bars, resulting in more uneven
confining stress than the latter. The current seismic
design code (ACI 318-14 2014; Caltrans 2003) also
requires less transverse reinforcements for spiral or
circular hoop columns than for rectangular tied
a
https://orcid.org/0000-0001-7572-8213
b
https://orcid.org/0000-0002-9273-4081
columns if the shear strength does not govern the
column design.
To utilize the advantages of spiral confinement
and to boost the fabrication automation of steel cages
in the prefabrication industry, Yin et al., (2011; 2012)
and Wang (2004) proposed using innovative
interlocking multi-spiral as transverse reinforcements
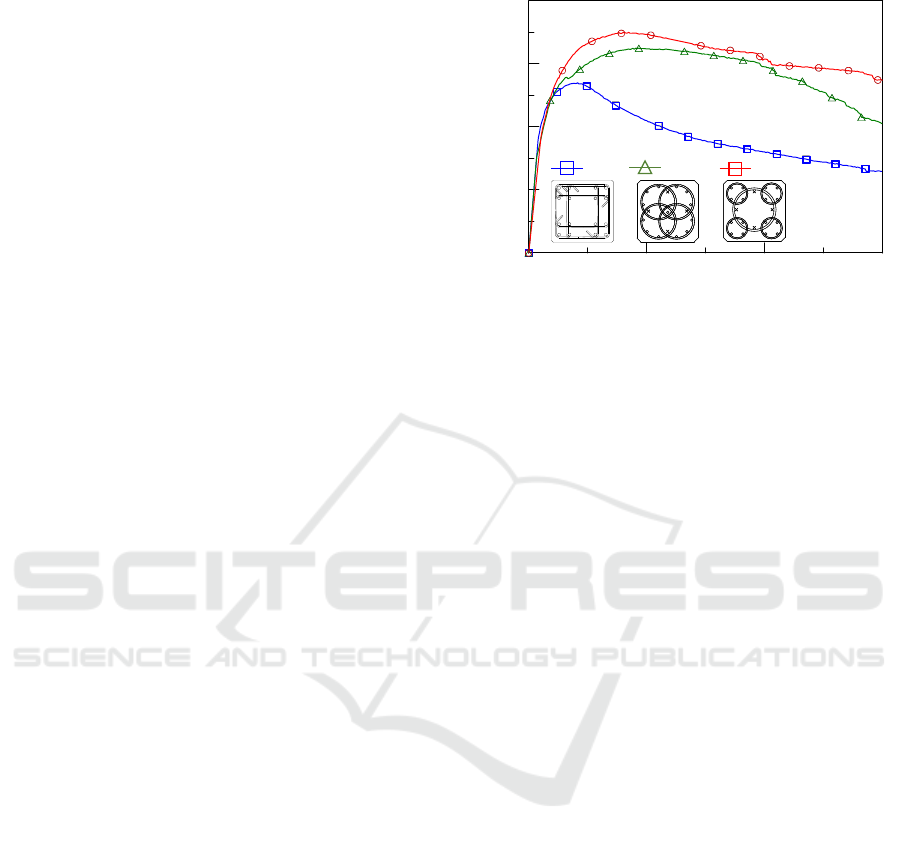
in rectangular concrete columns. Fig. 1 shows the
axial stress-strain curves of two representative multi-
spiral columns in comparison with those of a typical
tied column (T1). In the figure, column 4S1 is
comprised of four identical spirals, each of which
interlocks with the others, while column 5S3 has one
large spiral interlocking with four small ones at the
corners of the column. It can be clearly seen that,
based on approximately the same amount of
transverse reinforcements, columns 4S1 and 5S3
show superior ductile behavior at the post-peak
branch and their compressive strength can be
increased by 19% and 28% compared to column T1,
respectively.
A number of stress-strain constitutive models had
Wang, P. and Chang, K.
A Simplified Finite Element Analysis Method for Axial Compression Behavior of Rectangular Concrete Columns with Interlocking Multi-spiral Reinforcements.
DOI: 10.5220/0007915901110120
In Proceedings of the 9th International Conference on Simulation and Modeling Methodologies, Technologies and Applications (SIMULTECH 2019), pages 111-120
ISBN: 978-989-758-381-0
Copyright
c
2019 by SCITEPRESS – Science and Technology Publications, Lda. All rights reserved
111
been developed for predicting the uniaxial
compression behavior of confined and unconfined
concrete (Sheikh and Uzumeri 1982; Mander et al.,
1988; Saatcioglu and Razvi 1992; Cusson and
Paultre, 1995; Hoshikuma et al., 1997). These models
were empirically constructed based on experimental
results and some simple analytical calculation; the
key point of the models is to evaluate the effective
confining pressure acting on the confined concrete
core. For columns with irregular confinement
configurations such as the interlocking multi-spiral
mentioned above, however, the applicability of these
models is limited due to the complicated distribution
of confining pressure that cannot be computed by
means of simple force equilibrium on confined units.
In addition to the empirical models, the nonlinear
finite element method is an alternative to simulating
the confined behavior of concrete in a more detailed
manner. Many finite element modeling
methodologies have been developed (Karabinis and
Kiousis, 1994; Malvar et al., 2004; Luccioni and
Rougier, 2005; Papanikolaou and Kappos, 2009; Yu
et al., 2010; Song and Lu, 2011; Teng et al., 2015)
where the concrete plasticity constitutive model used
plays a crucial role in affecting the reliability and
accuracy of results. According to the complexity of
the confining mechanism, different levels of
sophistication may be required when defining the
yield criterion, the strain hardening and softening
rules, the flow rule, and even the damage function
while many relevant parameters need to be calibrated.
In general, compared to the experimental results, a
circular concrete section with uniform confining
stress provided by active pressure or fiber reinforced
polymer (FRP) could result in better simulations,
whereas a rectangular section confined by commonly
used tie reinforcements would result in less favorable
results. Nevertheless, no attempt has been made to
apply these methodologies to rectangular multi-spiral
columns and it can be expected to be a challenge.
The objective of this research was to propose a
simplified finite element analysis method for
analyzing the uniaxial compression behavior of
rectangular concrete columns with complicated
confinement configurations such as the interlocking
4-spiral and 5-spiral configurations mentioned above.
The proposed method combined an elastic finite
element analysis with an empirical stress-strain
model of confined concrete to achieve efficient and
satisfactory simulation results. Due to the superior
confined behavior and favorable assembling
automation, a parametric study focused on the
interlocking 5-spiral was then used to evaluate the
influence of various design parameters on the confi-
nement efficiency.
Figure 1: Comparison of axial compression behaviors of
rectangular concrete columns with tie reinforcement and
interlocking multi-spiral configurations.
2 FUNDAMENTAL CONCEPT
AND ANALYTICAL
PROCEDURE
The proposed simplified method made use of the
advantages of both the empirical stress-strain
confined concrete model and the finite element
analysis method; the former could provide well
established correlations between the effective
confining stress and the confined concrete strength,
while the latter could more realistically analyze the
distribution of confining stress. The confined
concrete model proposed by Mander et al., (1998)
was used in the research. The key parameters of the
Mander model are the effective confining stress
for spiral (or circular hoop) reinforcement and the
maximum (
) and minimum (
) effective
confining stresses for rectangular tie reinforcement,
all of which are exerted on the confined concrete core.
The effective confining stress is further defined as a
product of the confining stress
(or the maximum
and minimum confining stresses, namely
and
,
respectively) and the effective confinement
coefficient
. Once these parameters are obtained,
the stress-strain curve of confined concrete with
enhanced compressive strength
and ductility can
then be easily constructed. For columns with
commonly used regular transverse reinforcements,
the confining stress was approximated in the Mander
model as uniformly distributed stress over the
confined core using a simple force equilibrium. In
addition, the effective confinement coefficient was
assumed to be the ratio of the area of effectively
0 0.01 0.02 0.03
Axial strain
0
0.4
0.8
1.2
1.6
Normalized axial stress
(
f
c
/
f
'
c
)
T1
4S1
5S3
SIMULTECH 2019 - 9th International Conference on Simulation and Modeling Methodologies, Technologies and Applications
112
confined concrete core, which excludes the
ineffectively confined area due to the arching action,
to the area of confined concrete core enclosed by the
perimeter of transverse reinforcement.
However, for interlocking multi-spiral columns,
the inherently uneven and complicated distribution of
confining stress cannot be approximated using the
methodology mentioned above. Therefore, it was
proposed in this research to derive the amount and
distribution of confining stress by means of elastic
finite element analysis. The proposed method was
based on the assumption that the ultimate state of
confining stress within the confined concrete core
coincided with the maximum stress of confining steel
that has just reached yielding stress. This may be
justified by the fact that once the confining steel
yields, the lateral expansion of confined concrete
under axial compression cannot be effectively
restrained, resulting in a significant increase in the
Poisson’s ratio of the concrete and a decrease in
confining stress. With this assumption, elastic finite
element analysis was used to approximate the
ultimate state of confining stress, which can avoid
nonlinear analysis, eliminating the need for
sophisticated concrete plasticity modeling and time-
consuming computation. Moreover, discrete circular
hoops are used to simulate a continuous spiral for
simplicity of modeling and calculation. The proposed
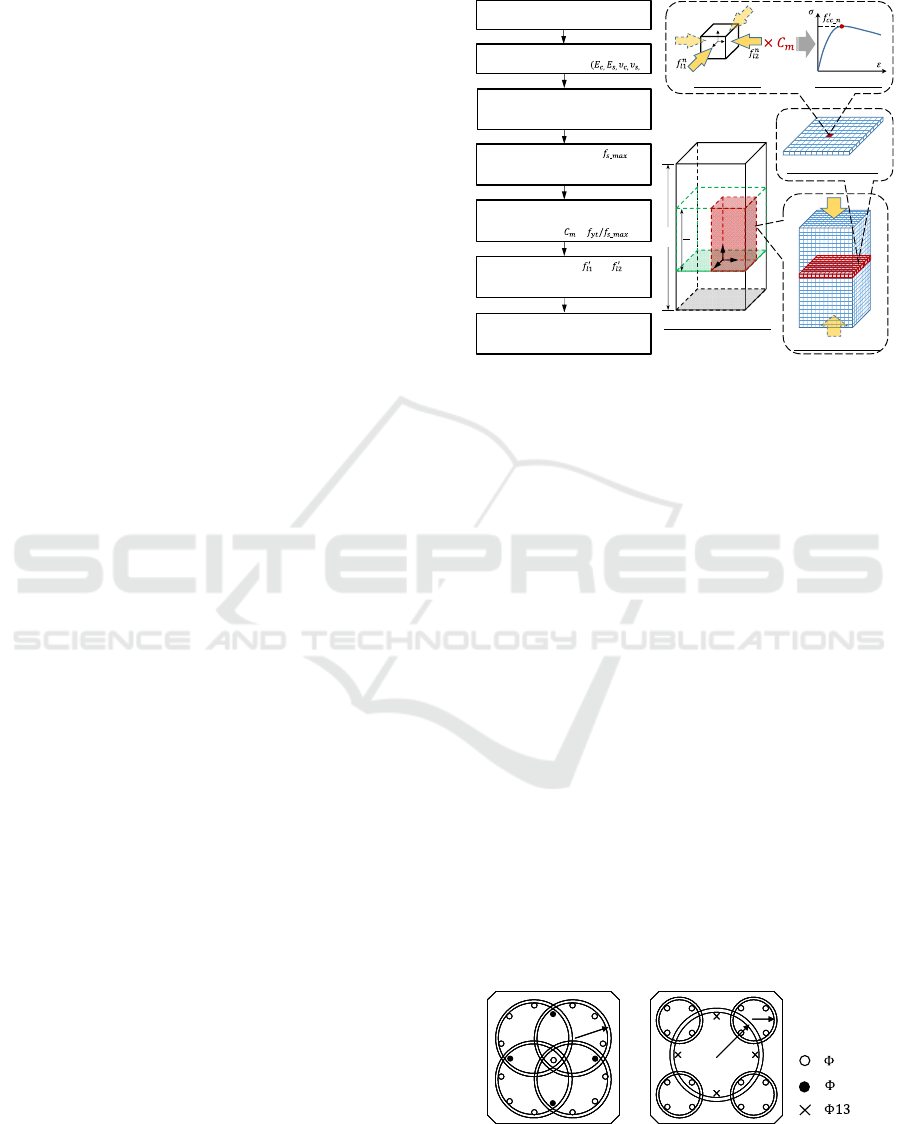
method can be achieved as illustrated in Fig. 2 by
firstly performing an elastic finite element analysis to
impose a small amount of compressive displacement
on the built model. Then, the maximum tensile stress
of the confining steel
_
can be determined, and a
horizontal layer of concrete elements between the
level of confining steel having the maximum stress
and its adjacent level can be selected for further
calculation. The position of the selected layer of the
concrete element is generally located at around the
mid-height of the column due to the geometric
symmetry and boundary constraints of the column,
causing this location to have the largest lateral
expansion as observed in experiments (Yin et al.
2011, 2012; Wang 2004). Second, the maximum and
minimum confining (or principal) stresses of each
confined concrete element of the selected layer are
extracted from the analysis result and are magnified
by an amplification coefficient
. The
is defined
as the ratio of yielding strength
to the maximum
stress
_
of confining steel, to approximate the
ultimate confining stresses (i.e., the
and
) of the
confined concrete elements. It should be noted that
the magnified confining stresses are equivalent to the
effective confining stresses denoted in the Mander
model because the three-dimensional finite element
model can more realistically capture the confining
stress distribution than an assumed one.
Figure 2: Flowchart and illustration of proposed simplified
FEA method.
3 FINITE ELEMENT MODELING
3.1 Model Configuration
Two types of interlocking multi-spiral
reinforcements, namely type 4S and type 5S, are
considered in this research due to their superior
confinement effects as mentioned in the introduction.
Fig. 3 shows the selected configurations of these two
types of columns, where the height of the column is
1200 mm with a cross section of 600 mm 600 mm.
Type 4S is composed of four identical interlocking
spirals with a radius
= 180 mm. Type 5S consists of
a central large spiral with a radius
= 210 mm
interlocked with four small corner spirals having
identical radius
= 105 mm. The layouts and bar
sizes of the longitudinal reinforcements for the two
columns, resulting in similar amounts of vertical
reinforcements, are also designated in Fig. 3. On the
other hand, the vertical spacing and bar size of
transverse reinforcements vary according to different
design scenarios, as given in later sections.
(a) Type 4S (b) Type 5S
Figure 3: Configuration of interlocking multi-spiral
column.
Build finite element model
(use circular hoops to simulate spiral)
Define elastic material properties for
concrete and steel elements
)
Assign boundary conditions and perform
elastic analysis using small compressive
displacement
Find out the maximum stress of
confining steel and select a layer of
confined concrete element nearby
Output the maximum and minimum
confining stress of each element and
multiply them by
(= )
Substitute the computed and into
Mander’s model to obtain the stress-strain
curve of each confined concrete element
Sum up the contribution of confined and
cover concretes and longitudinal steels to
obtain the integrated compressive curve
Confined concrete column
Finite element model
Selected element layer
Single element n
(principal axes)
Mander’s model
5S
4S
H
H
2
x
y
z
(global axes)
r
e
r
e
r
b
r
s
r
b
r
s
: 25 (mm)
:
22 (mm)
: (mm)
A Simplified Finite Element Analysis Method for Axial Compression Behavior of Rectangular Concrete Columns with Interlocking
Multi-spiral Reinforcements
113
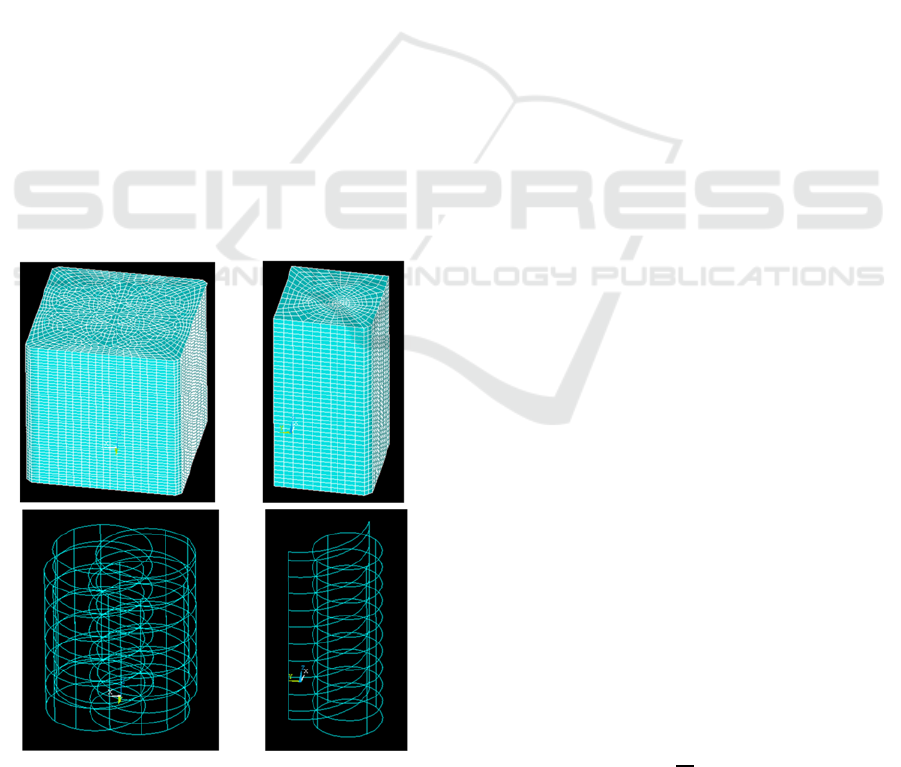
The finite element modeling and analyses were
performed using the ANSYS general purpose finite
element software. Given that the experimental axial
stress-strain curves of the confined concrete columns
were derived based on the displacement measurement
within the middle-half column, only that part of the
column was modeled in the finite element model, as
illustrated in Fig. 2. This kind of modeling could also
approximately neglect the boundary effects caused by
the friction constraints between the testing machine
and column specimen under compressive loading
tests. Besides, due to the symmetry of the transverse
reinforcement and based on the assumption that
continuous spirals were simulated by discrete circular
hoops, type 5S can be further modeled as one-fourth
of the middle-half column, as shown in Fig. 2. As a
result, only one-half and one-eighth of column
specimens were modeled for types 4S and 5S,
respectively. For the type 5S model, the boundary
conditions u
0,y,z
0 and v
x,0,z
0 were
assigned to the symmetric planes of x0 and y0,
respectively, where u and v are the nodal
displacements along the global axes x and y ,
respectively, as designated in Fig. 2. For both types
of models, the axial compression loading was applied
by assigning w
x,y,0
0 to the plane z0 and
imposing an appropriate axial displacement
w
x,y,H/2
on the plane zH/2, where w is
the nodal displacement along the global axis z.
(a)Type 4S (1/2 model) (b)Type 5S (1/8 model)
Figure 4: Finite element models for types 4S and 5S
columns.
In modeling the steel reinforcements of reinforced
concrete members, three methodologies, namely the
distributed, embedded, and discrete methods, are
commonly used. To better capture the arching action
between the levels of transverse reinforcements, the
discrete method was adopted in this research. Both
longitudinal and transverse reinforcing steel elements
were explicitly constructed and attached to the
adjacent nodes of concrete elements. Perfect bond
between the concrete and steel was assumed;
therefore, they shared the same nodal displacements
at the concurrent nodes. An eight-node solid element
and two-node link element were used for the concrete
and reinforcing steels, respectively. The link element
had axial strength but carried no bending stiffness.
Fig. 4 shows the meshed finite element models for the
types 4S and 5S columns where the element sizes
were determined based on a mesh convergence
analysis and the configuration of the reinforcing
steels.
3.2 Steel Reinforcement
Considering that the finite element analyses in the
proposed method was conducted within the elastic
range, only fundamental material properties were
needed. For both the longitudinal and transverse
reinforcing steels, a Young’s modulus
of 200 GPa
and a Poisson’s ratio
of 0.2 were used for
modeling. The cross-section areas and vertical
spacings of reinforcing steels were set according to
their respective design requirements as presented in
the next section. After the finite element analyses, the
contribution of each element needed to be integrated
to obtain the whole compression behavior of the
column. At this stage of the calculation, an elastic-
perfectly plastic stress-strain relation was used to
approximate the axial compression behavior of
longitudinal steels. This can be justified by the fact
that after the transverse reinforcements yield, a
reduction in the lateral restraint allows the buckling
of longitudinal steels to occur, eliminating the strain
hardening of steel.
3.3 Concrete Material Model
The Poisson’s ratio of concrete
commonly ranges
from 0.15 to 0.2, and
0.17 is used in this
research. The modulus of elasticity of concrete
can
be determined according to the formula suggested by
ACI 318-14 (2014) as follows:
4700
(MPa)
(1)
SIMULTECH 2019 - 9th International Conference on Simulation and Modeling Methodologies, Technologies and Applications
114

As mentioned previously, the magnified confining
stresses (
and
) from the elastic finite element
analysis results are utilized to compute the confined
compressive strength
and the corresponding
compressive stress-strain curve for each confined
concrete element. The confined compressive strength
of concrete under multiaxial compressive stresses
was derived by Mander et al. (1988) using an ultimate
strength surface and was given in a plot relating the
confining stresses and the confined strength. To aid
numerical calculations, Chang and Mander (1994)
proposed an approximate equation for the plot as
follows:
K
1
̅
0.1
0.9
1
̅
(2)
where
̅
2
(3)
,
(4)
A6.8886
0.606917.275
.
(5)
B
4.5
5
0.98490.6306
.
0.1
5
(6)
In addition, the compressive strain
, corresponding
to
in the Mander model, is given by
15
1
(7)
where
and
are the unconfined concrete
strength and corresponding compressive strain,
respectively, and the latter is assumed to be 0.002 in
this research.
4 VERIFICATOIN WITH
EXPERIMENTAL RESULTS
The axial compression test results from Yin et al.,
(2011; 2012) and Wang (2004) for rectangular
concrete columns using type 4S and 5S
reinforcements are used to verify the proposed
simplified FEA method. Table 1 lists the design
parameters and material properties of the tested
columns while their cross-sectional configurations
are given in Fig. 3. Four type 4S columns, with
different volumetric ratios of transverse
reinforcement (
) ranging from 1.47% to 4.5%, are
used to study the effect of the amount of transverse
reinforcements on the compressive behaviors of
columns. The
is defined as the ratio of the volume
of the interlocking multi-spiral reinforcements to the
gross volume of the column. In addition, four type 5S
columns are used to study the effects of the amount
of transverse reinforcements (
= 1.44% to 2.56%) as
well as the design combination of large and small
spirals (i.e., having the same volume ratio but
different bar sizes and spacings such as Columns 5S3
and 5S4) on column behavior.
Table 1: Design parameters and material properties.
4.1 Type 4S Columns
Fig. 5 shows comparisons of the analytical and
experimental axial compressive stress-strain curves
for the four type 4S columns. The analytical result of
each column is presented in terms of the axial strength
contributions from the confined core concrete
(denoted as
_
, unconfined cover concrete
(denoted as
_
, and longitudinal
reinforcements (denoted as
_
and
_
. The
axial stress of the individual contributing components
were calculated as the axial force divided by the gross
column cross-sectional area; therefore, the
summation of each contributing stress-strain curve is
the total stress-strain curve of column. To identify the
effect of the cover concrete on the compressive
behavior of the column, two summation results with
and without the inclusion of the cover concrete,
_
and _
, respectively, are also
given in the figures. The two summation results show
that the cover concrete has significant influence on
the initial stiffness of columns. In addition, the initial
stiffness of the analytical result with the cover
concrete match well with that of the experimental
curve for the four columns, until a significant
nonlinearity of the experimental curve occurs. Then,
the experimental curve approximately lies between
the two analytical curves with and without the cover
concrete before these two analytical curves coincide.
This phenomenon can be explained by the fact that,
Specimen
′
(MPa)
Transverse reinforcemen
t
Maximum strength
Error
(%)
Spacing
(mm)
Size
(mm)
(MPa)
(%)
Experiment
(MPa)
Proposed
(MPa)
4S1 43.9 75 Φ13 323.4 2.0 57.0 55.5 -2.70
4S3 39.5 50 Φ16 372.1 4.5 70.6 67.3 -4.71
4S4 43.9 65 Φ16 372.1 3.5 65.5 66.5 1.55
4S5 43.9 100 Φ13 323.4 1.47 50.4 52.8 4.81
5S1 38.6 50 Φ13 323.4 2.56 57.6 55.3 -4.03
5S3 39.5
70(b) Φ16 372.7
2.2 55.2 54.0 -2.27
70(s) Φ13 323.4
5S4 39.5 60 Φ13 323.4 2.2 53.5 53.2 -0.49
5S5 38.6 50 Φ10 313.9 1.44 49.7 49.6 -0.28
Note: (b) and (s) indicate the large and small spirals, respectively, for the type 5S column.
A Simplified Finite Element Analysis Method for Axial Compression Behavior of Rectangular Concrete Columns with Interlocking
Multi-spiral Reinforcements
115
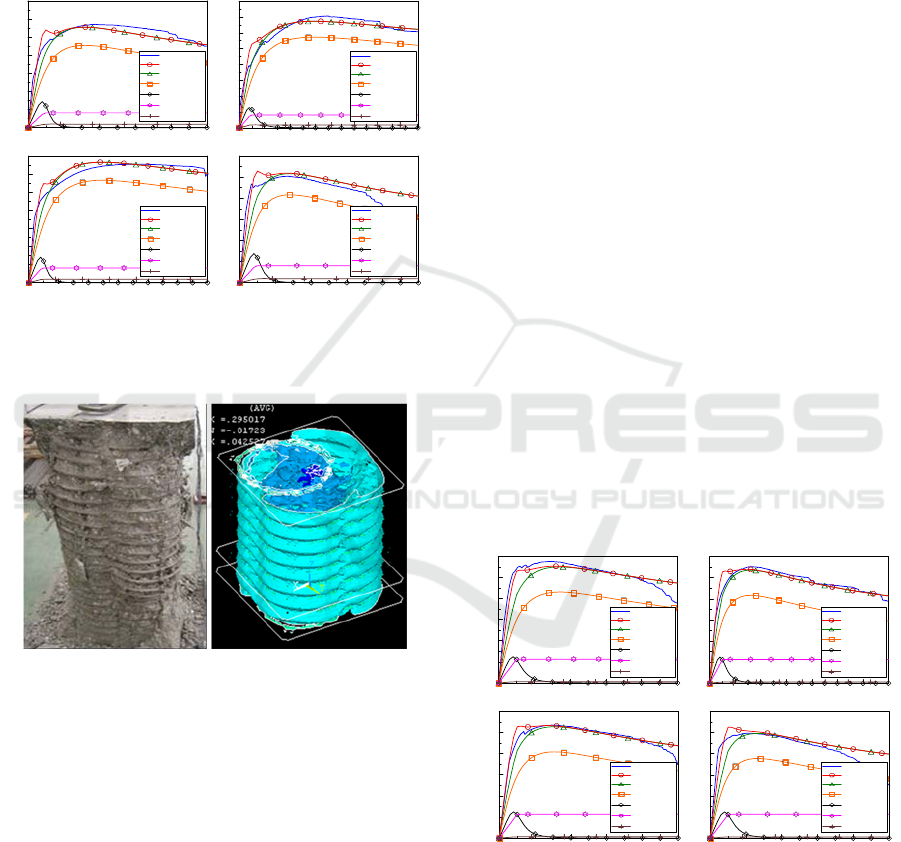
as axial deformation increases, the cover concrete
tends to spall off the confined core because of their
different levels of lateral expansion. Moreover, the
defects on the column construction and the boundary
constraints of the testing machine could also affect
the onset of cover spalling. As a result, the cover
concrete is usually unable to achieve its maximum
strength, as shown in Fig. 5.
Figure 5: Comparison between experimental and analytical
results for type 4S columns: (a) 4S1; (b) 4S3; (c) 4S4; and
(d) 4S5.
(a) (b)
Figure 6: (a) Failure condition and (b) contour plot of equal
maximum confining stress for Column 4S4.
In general, the proposed simplified finite analysis
method can well predict the experimental axial stress-
strain behaviors of the four columns in terms of the
initial stiffness, the maximum axial strength, and the
post-peak strength degradation behavior. As listed in
Table 1, the maximum percentage of error in the
maximum axial strength for the four columns is
within 5%. This also indicates that the proposed
method can effectively capture the effects of the
amount of transverse reinforcements on the
compressive behaviors of the type 4S columns. Fig.
6(a) shows the failure condition of Column 4S4 and
Fig. 6(b) shows a contour plot of the equal maximum
confining stress from the finite element analysis of
the corresponding column. It can be clearly seen from
Fig. 6(b) that due to the arching action, the equal
confining stress contour has decreasing sectional
areas towards the middle of the two levels of
confining steels, which conforms to the experimental
observations shown in Fig. 6(a).
4.2 Type 5S Columns
Fig. 7 shows comparisons of the analytical and
experimental axial compressive stress-strain curves
for the four type 5S columns. In general, the proposed
simplified method can satisfactorily capture the axial
compression behaviors of the four columns despite
the presence of some deviations in the prediction of
the column initial stiffness and the maximum
strength. The errors in the predicted maximum
strength are within 4% as listed in Table 1. For these
four columns, Column 5S4 has the best simulation
results, where the experimental curve follows nearly
the same slope as the analytical curve with cover
concrete until an axial stress of around 32 MPa is
reached, transfers between the two analytical curves
with and without the cover concrete to approach the
intersection of the two analytical curves, and then
progresses closely with the descending branch of the
analytical curves. The analytical results can
appropriately reflect the positive trend of the
increasing amount of transverse reinforcements on
the maximum compressive strength, as observed in
the test results.
Figure 7: Comparison between experimental and analytical
results for type 5S columns: (a) 5S1; (b) 5S3; (c) 5S4; and
(d) 5S5.
In addition, under the same amount of transverse
reinforcements, the effects of different design
combinations of large and small spirals (i.e., Column
5S3 and 5S4) on the maximum compressive strength
0 0.005 0.01 0.015 0.02 0.025
Axial strain
0
10
20
30
40
50
60
70
Axial stress (MPa)
Experiment
SFEA
_total
SFEA
_conf
f
c_conf
f
c_unconf
f
s_
25
f
s_
22
(a) 4S1
0 0.005 0.01 0.015 0.02 0.025 0.03 0.035
Axial strain
0
10
20
30
40
50
60
70
80
Axial stress (MPa)
Experiment
SFEA
_total
SFEA
_conf
f
c_conf
f
c_unconf
f
s_
25
f
s_
22
(b) 4S3
0 0.005 0.01 0.015 0.02 0.025 0.03
Axial strain
0
10
20
30
40
50
60
70
Axial stress (MPa)
Experiment
SFEA
_total
SFEA
_conf
f
c_conf
f
c_unconf
f
s_
25
f
s_
22
(c) 4S4
0 0.005 0.01 0.015 0.02 0.025
Axial strain
0
10
20
30
40
50
60
Axial stress (MPa)
Experiment
SFEA
_total
SFEA
_conf
f
c_conf
f
c_unconf
f
s_
25
f
s_
22
(d) 4S5
0 0.005 0.01 0.015 0.02 0.025
Axial strain
0
10
20
30
40
50
60
Axial stress (MPa)
Experiment
SFEA
_total
SFEA
_conf
f
c_conf
f
c_unconf
f
s_
25
f
s_
13
(a) 5S1
0 0.005 0.01 0.015 0.02 0.025 0.03 0.035
Axial strain
0
10
20
30
40
50
60
Axial stress (MPa)
Experiment
SFEA
_total
SFEA
_conf
f
c_conf
f
c_unconf
f
s_
25
f
s_
13
(b) 5S3
0 0.005 0.01 0.015 0.02 0.025
Axial strain
0
10
20
30
40
50
60
Axial stress (MPa)
Experiment
SFEA
_total
SFEA
_conf
f
c_conf
f
c_unconf
f
s_
25
f
s_
13
(c) 5S4
0 0.005 0.01 0.015 0.02 0.025
Axial strain
0
10
20
30
40
50
60
Axial stress (MPa)
Experiment
SFEA
_total
SFEA
_conf
f
c_conf
f
c_unconf
f
s_
25
f
s_
13
(d) 5S5
SIMULTECH 2019 - 9th International Conference on Simulation and Modeling Methodologies, Technologies and Applications
116
can also be captured using the proposed method. Fig.
8(a) shows the failure condition of Column 5S3 while
Fig. 8(b) shows the corresponding contour plot of
equal maximum confining stress from the finite
element analysis. As found in the type 4S column, the
finite element analysis results could properly account
for the arching actions formed between the two levels
of confining steels.
(a) (b)
Figure 8: (a) Failure condition and (b) contour plot of equal
maximum confining stress for Column 5S3.
5 PARAMETRIC STUDIES OF
TYPE 5S REINFORCEMENT
Type 5S reinforcement is considered a promising
method of transverse reinforcement for rectangular
RC columns compared to type 4S due to the following
reasons. The first is its superior confined behavior for
the same amount of transverse reinforcement, as
shown in Fig. 1. Secondly, type 5S reinforcement is
beneficial for the assembly of the interlocking spiral
cage, since the large spiral only needs to lap over a
small spiral at each corner of the column. In contrast,
each spiral of the type 4S reinforcement always has
to interlock with the other three spirals. Finally, the
small spirals of type 5S reinforcements allow the
longitudinal steel of a column to be located much
closer to the perimeter of the column than for type 4S,
resulting in a greater flexural rigidity. Therefore,
parametric studies were conducted by using the
proposed method on type 5S reinforcement to
investigate the influence of various spiral design
parameters on the confinement efficiency. The
dimensions of the column remained the same as those
of the experimental studies mentioned above, but the
radiuses (or diameters) of the large and small spirals
were changed to produce different design
combinations. A radius ratio (
/
), the ratio of the
radius of the small spirals (
) to that of the large
spiral (
), was used to define the geometry of the
interlocking spirals and hence its confined area (
).
The
is the area enclosed by the outside edges of
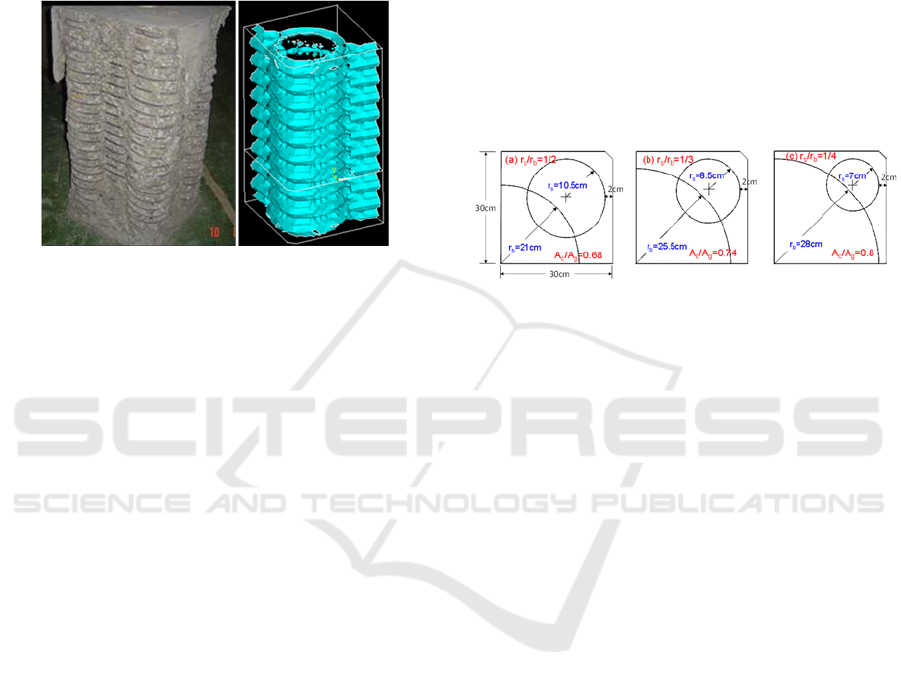
the interlocking spirals. As shown in Fig. 9, given a
column section and a minimum depth (2 cm) of cover
concrete, the confined area or the ratio (
/
) of the
confined area to the gross area of the column section
(
) increases as the radius ratio decreases. In the
parametric studies, three radius ratios, namely
/
=
1/2, 1/3, and 1/4, were considered, resulting in
/
= 0.68, 0.74, and 0.80, respectively, where the
first one is identical to the experimental ratio. In
addition, the compressive strength of the unconfined
concrete and the yielding strength of the spirals were
assumed to be 34.3 and 274.4 MPa, respectively.
Figure 9: Geometries of type 5S reinforcements used in the
parametric studies for: (a)
/
= 1/2; (b)
/
= 1/3; and
(c)
/
= ¼.
5.1 Effect of the Amount of Large and
Small Spirals
To investigate the effects of the amount of large and
small spirals on the compressive strength of confined
concrete, the proposed method was applied to
columns with various combinations of large and small
spirals for the three spiral radius ratios. The amount
of spiral reinforcement is commonly represented by
the volumetric ratio (ρ), which is the ratio of the spiral
volume to the volume of core concrete confined by
the spiral within a vertical spacing. In general, given
a bar size and a vertical spiral spacing, the volumetric
ratio of small spiral (
) is larger than that of large
spiral (
) since the spiral volumetric ratio is
inversely proportional to the spiral radius (or
diameter). Therefore, the analytical cases of this
section were devised in such a way that the
was
fixed while the
was increased and greater than
.
Moreover, the vertical spiral spacing was set to be 60
mm for all the analytical cases in this section. Figs.
10(a) to 10(c) show the relationships between the
normalized compressive strength (
/
) of the core
concrete confined by the interlocking multi-spiral
reinforcements and
associated with a specific
for
/
= 1/2, 1/3, and 1/4, respectively. When the
remains constant, the normalized compressive
strength of the confined concrete is approximately
proportional to the
for the three
/
cases. In
A Simplified Finite Element Analysis Method for Axial Compression Behavior of Rectangular Concrete Columns with Interlocking
Multi-spiral Reinforcements
117
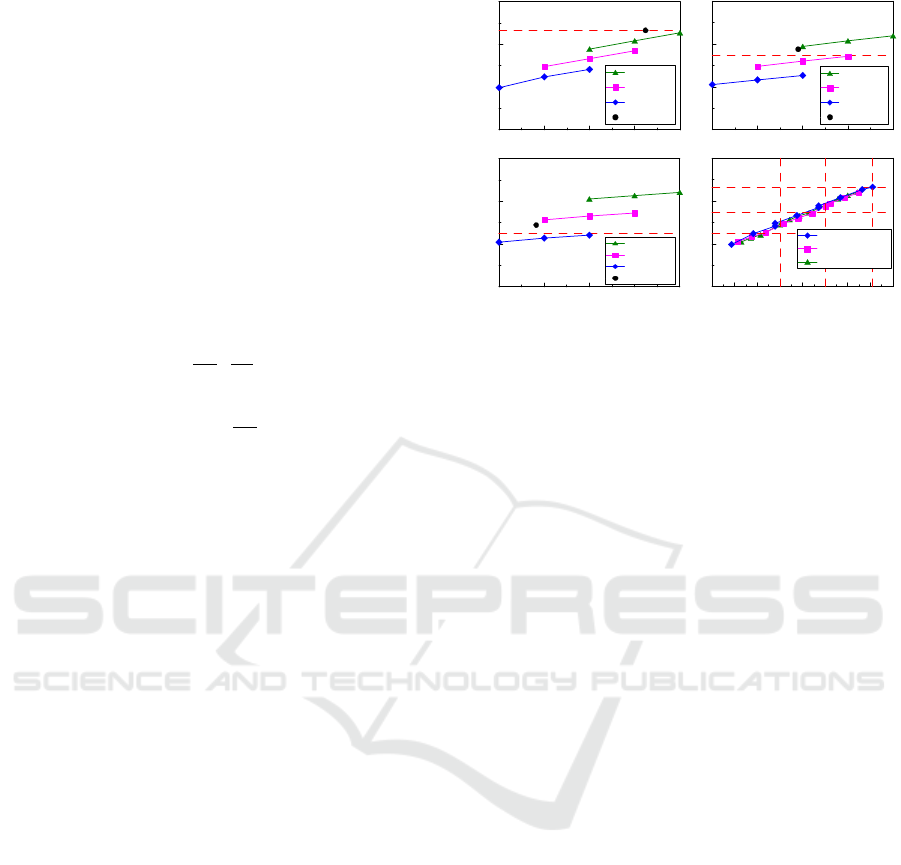
addition, the rate of increase of
/
with increasing
(i.e., the slope of the line in the figures) tends to
decrease as the
/
decreases. This can be attributed
to the fact that for larger
/
, the small spiral has a
greater contribution to the compressive strength
based on the total confined area. On the contrary,
when the
remains constant (i.e.,
= 2.0% in the
figures), the rate of increase of
/
with increasing
(i.e., the difference of
/
between different
in the figures) tends to increase as the
/
decreases.
According to ACI 318-14 (2014), the required
amount of transverse reinforcement for the spiral
confinement of a column is the greater of the
following two equations:
0.45
1
(8
)
0.12
(9)
Eq. (8) is intended to ensure that the axial load
capacity, based on the confined concrete strength
and the confined area
after cover concrete
spalling, is not less than that based on the
and
.
Eq. (9) is intended to provide adequate curvature
ductility at the potential plastic hinge regions of the
column. For a column with
/
smaller than 0.79,
which is nearly within the cases considered in the
parametric study, Eq. (8) will govern the required
amount of transverse reinforcement. Therefore, the
code-required volumetric ratio of spirals according to
Eq. (8) is inversely proportional to the
/
, and
hence directly proportional to the
/
considered in
this paper. Namely, the less the confined area, the
greater confined concrete strength
associated with
more transverse reinforcement is needed to
compensate the spalling of the cover concrete. This
implies that the value of
/
should not be less
than the reciprocal of
/
. Accordingly, for the
cases of
/
= 1/2, 1/3, and 1/4, the minimum code-
required
are 2.62%, 1.95%, and 1.41%, which
correspond to the minimum required
/
of 1.47,
1.35, and 1.25, respectively. Figs. 10(a) to 10(c) also
show the analytical results of columns with the code-
required
where the volumetric ratios of large and
small spirals are both equal to the
. It can be found
that when the
/
= 1/2, the analyzed
/
is
almost identical to the code-required strength denoted
by a dashed line. As the
/
decreases, it tends to
produce a greater confined concrete strength than the
code-required value.
Figure 10: Effects of the amount of large and small spirals
on normalized confined concrete strength for: (a)
/
=1/2; (b)
/
=1/3; (c)
/
=1/4; and (d) all cases.
5.2 Concurrent Yielding of Large and
Small Spirals
The interlocking multi-spiral reinforcement
consisting of one large and four small spirals was
designed to collectively constrain the lateral
expansion of the confined concrete core when
subjected to axial loading. Therefore, failure of either
the large or any small spiral would lead to the
disintegration of the confining mechanism. In the
general design cases mentioned above, namely the
being greater than
, the maximum steel stress of the
large spiral (
_
) is greater than that of the small
spiral (
_
), resulting in the failure or yielding of the
large spiral before that of the small spiral. In addition,
it was found that the ratio of
_
/
_
tended to
decrease as the ratio of
/
decreased.
Accordingly, the optimum design of the type 5S
reinforcement was defined in this research such that
the
/
ratio can cause the concurrent yielding of
the large and small spirals to achieve economic
design.
Figs. 11(a) to 11(c) show the relationships
between the ratios of
_
/
_
and the ratios of
/
for
/
= 1/2, 1/3, and 1/4, respectively. For
each plot in the figures, the ratio of
/
is varied
based on a fixed
(i.e.,
= 1.0%, 1.5%, or 2.0%).
The ratio of
_
/
_
is approximately proportional
to the ratio of
/
at a specific rate depending on
the ratio of
. In addition, the three curves
corresponding to different ratios of
nearly
converge to the same point where the ratio of
_
/
_
is equal to one and the corresponding
/
, denoted as
/
_
, are found to be
1 1.5 2 2.5 3
s
(%)
1
1.2
1.4
1.6
f
'
cc
/f
'
c
b
=2.0%
b
=1.5%
b
=1.0%
b
=
s
=2.62%
(a) r
s
/r
b
=1/2
1 1.5 2 2.5 3
s
(%)
1
1.2
1.4
1.
6
f
'
cc
/f
'
c
b
=2.0%
b
=1.5%
b
=1.0%
b
=
s
=1.95%
(b) r
s
/r
b
=1/3
11.522.53
s
(%)
1
1.2
1.4
1.6
f
'
cc
/f
'
c
b
=2.0%
b
=1.5%
b
=1.0%
b
=
s
=1.41%
(c) r
s
/r
b
=1/4
0.6 0.8 1 1.2 1.4 1.6 1.8 2 2.2
t
(%)
1
1.2
1.4
1.6
f
'
cc
/f
'
c
r
s
/r
b
=1/2, A
c
/A
g
=0.68
r
s
/r
b
=1/3, A
c
/A
g
=0.74
r
s
/r
b
=1/4, A
c
/A
g
=0.80
(d) all cases
code requirement
code requirement
code requirement
code requirement
r
s
/r
b
=1/2
1/3
1/4
r
s
/r
b
=1/4
1/3
1/2
SIMULTECH 2019 - 9th International Conference on Simulation and Modeling Methodologies, Technologies and Applications
118
around 1.0, 0.8, and 0.7 for
/
= 1/2, 1/3, and 1/4,
respectively. This indicates that, to achieve
concurrent yielding of the large and small spirals, the
ratio of
/
_
needs to be decreased when the
ratio of
/
decreases.
Figure 11: Relationships between
_
/
_
and
/
for: (a)
/
=1/2; (b)
/
=1/3; and (c)
/
=1/4.
5.3 Effect of Vertical Spiral Spacing
To examine the effect of the vertical spacing of the
spiral on the compressive strength of confined
concrete, the vertical spacing was varied while
keeping the volumetric ratios of the large and small
spirals unchanged. The
and
both conformed to
the minimum requirement according to Eq. (8) and
had the values of 2.62%, 1.95%, and 1.41% for the
ratios of
/
= 1/2, 1/3, and 1/4, respectively. Fig.
12(a) shows the relationship between the
/
and
the vertical spacing of spirals for the three
/
cases. It is shown that the
/
decreases as the
vertical spacing increases. This can be attributed to
the fact that the larger the vertical spacing, the less
effective lateral confinement can develop between the
two levels of spirals due to the arching action.
Moreover, the analytical results also show that the
rate of decline in
/
associated with increasing
vertical spiral spacing is more severe for cases with
larger
/
than those with smaller ones.
Fig. 12(b) further examines the analytical results
in terms of whether they can satisfy the code-required
minimum strength, namely
/
/
1. It
can then be found that, to satisfy the minimum
strength requirement, the vertical spiral spacings
could not be greater than around 60 mm, 125 mm, and
200 mm for the ratios of
/
= 1/2, 1/3, and 1/4,
respectively.
Figure 12: Effect of vertical spiral spacing on the
compressive strength of columns in terms of: (a)
/
and
(b)
/
/
.
6 CONCLUSIONS
This study aims to propose a simplified finite element
analysis method to analyze the axial compression
behavior of rectangular concrete columns confined by
interlocking multi-spiral reinforcement. The
proposed simplified method utilizes the elastic finite
element analysis to approximate the distribution and
ultimate state of confining stress in each core concrete
element, which is substituted into the Mander
confined concrete model and then summed to obtain
the integrated compressive curve of a column.
Verification of the proposed method against test
results of four type 4S and four type 5S columns
shows good agreement between them. By using the
proposed method, parametric studies focused on type
5S reinforcement were conducted to investigate the
influence of various spiral design parameters on the
confinement efficiency. Important conclusions can be
drawn as follows:
For the same amount of transverse reinforcement,
a column with a lesser radius ratio
/
(or a
larger confined area) can sustain approximately
the same normalized confined concrete strength
/
as its counterpart, resulting in a better axial
load-carrying capacity and confinement
efficiency.
In order to achieve economic confinement design,
the volumetric ratio of large spirals to that of small
spirals (
/
), to have concurrent yielding of the
large and small spirals, was found to be around
1.0, 0.8, and 0.7 for
/
= 1/2, 1/3, and 1/4,
respectively.
Given a minimum amount of spirals required by
ACI 318-14, it was found that the vertical spacing
of spirals could not be greater than around 60 mm,
125 mm, and 200 mm for the ratios of
/
= 1/2,
1/3, and 1/4, respectively, to fulfill the code-
required minimum strength, namely
/
/
1.
0.511.522.5
s
/
b
0.99
1
1.01
1.02
1.03
1.04
1.05
f
sp_b
/f
sp_s
b
=2.0%
b
=1.5%
b
=1.0%
(a) r
s
/r
b
=1/2
0.511.522.5
s
/
b
0.99
1
1.01
1.02
1.03
1.04
1.05
1.06
1.07
f
sp_b
/f
sp_s
b
=2.0%
b
=1.5%
b
=1.0%
(b) r
s
/r
b
=1/3
0.511.522.5
s
/
b
0.99
1
1.01
1.02
1.03
1.04
1.05
1.06
1.07
1.08
f
sp_b
/f
sp_s
b
=2.0%
b
=1.5%
b
=1.0%
(c) r
s
/r
b
=1/4
(
s
/
b
)
_conc
=1.0
(
s
/
b
)
_conc
=0.8
(
s
/
b
)
_conc
=0.7
50 75 100 125 150 175 200
Spacing (mm)
1.2
1.3
1.4
1.5
1.6
f
'
cc
/f
'
c
r
s
/r
b
=1/2,
b
=
s
=2.62%
r
s
/r
b
=1/3,
b
=
s
=1.95%
r
s
/r
b
=1/4,
b
=
s
=1.41%
(a)
50 75 100 125 150 175 200
Spacing (mm)
0.9
0.95
1
1.05
1.1
f
'
cc
/f
'
c
A
c
/
A
g
r
s
/r
b
=1/2,
b
=
s
=2.62%
r
s
/r
b
=1/3,
b
=
s
=1.95%
r
s
/r
b
=1/4,
b
=
s
=1.41%
(b)
A Simplified Finite Element Analysis Method for Axial Compression Behavior of Rectangular Concrete Columns with Interlocking
Multi-spiral Reinforcements
119

ACKNOWLEDGEMENTS
The authors would like to thank Ruentex Engineering
& Construction Co., Ltd. of Taiwan and National
Center for Research on Earthquake Engineering
(NCREE), Taiwan for their financial support.
REFERENCES
ACI Committee 318. 2014. Building code requirements for
structural concrete (ACI 318-14) and commentary.
American Concrete Institute, Farmington Hills, MI.
ANSYS. [Computer software]. Swanson Analysis Systems,
Canonsburg, PA.
Caltrans (California Department of Transportation). 2003.
Bridge design specifications. Engineering Service
Center, Earthquake Engineering Branch, Sacramento,
CA.
Cusson, Dj., and P. Paultre. 1995. “Stress-strain model for
confined high-strength concrete.” J. Struct. Eng. 121
(3): 468-477.
Chang, G. A., and J. B. Mander. 1994. “Seismic energy
based fatigue damage analysis of bridge columns: part
1- evaluation of seismic capacity.” Technical Report
NCEER-94-0006. University at Buffalo, New York,
US.
Hoshikuma, J., K. Kawashima, K. Nagaya, and A. W.
Taylor. 1997. “Stress-strain model for confined
reinforced concrete in bridge piers.” J. Struct. Eng. 123
(5): 624-633.
Karabinis, A.I., and P. D. Kiousis. 1994. “Effects of
confinement on concrete columns: plasticity approach.”
J. Struct. Eng. 120 (9): 2747-2767.
Luccioni, B.M., and V. C. Rougier. 2005. “A plastic
damage approach for confined concrete.” Computer &
Structures. 83: 2238-2256.
Mander, J. B., M. J. N. Priestly, and R. Park. 1988.
“Theoretical stress-strain model for confined concrete.”
J. Struct. Division. 114 (8): 1804-1826.
Malvar, L. J., K. B. Morrill, and J. E. Crawford. 2004.
“Numerical modeling of concrete confined by fiber-
reinforced composites.” J. Compos. Constr. 8 (4): 315-
322.
Papanikolaou, V.K., and A. J. Kappos. 2009. “Numerical
study of confinement effectiveness in solid and hollow
reinforced concrete bridge piers: Methodology.”
Comput. & Structures. 87: 1427-1439.
Sheikh, S. A., and S. M. Uzumeri. 1982. “Analytical model
for concrete confinement in tied columns.” J. Struct.
Division. 108 (12):2703-2722.
Saatcioglu, M., and S. R. Razvi. 1992. “Strength and
ductility of confined concrete.” J. Struct. Eng. 118 (6):
1590-1607.
Song, Z., and Y. Lu. 2011. “Numerical simulation of
concrete confined by transverse reinforcement.”
Comput & Concrete. 8 (1): 23-41.
Teng, J.G., Q. G. Xiao, T. Yu, and L. Lam. 2015. “Three-
dimensional finite element analysis of reinforced
concrete columns with FRP and/or steel confinement.”
Eng. Struct. 97:15-28.
Wang, P. H. 2004. “A study on new confinement
configurations for rectangular concrete columns.” [in
Chinese.] Master thesis, Department of Civil
Engineering, National Taiwan University, Taipei,
Taiwan.
Yin. S. Y. L., J. C. Wang, and P. H. Wang. 2012.
“Development of multi-spiral confinements in
rectangular columns for construction automation.” J.
Chinese Institute of Engineers. 35 (3): 309-320.
Yin. S. Y. L, T. L. Wu, T. C. Liu, S. A. Sheikh, and R.
Wang. 2011. “Interlocking spiral confinement for
rectangular columns.” Concrete International. 33 (12):
38-45.
Yu, T., J. G. Teng, Y. L. Wong, and S. L. Dong. 2010.
“Finite element modeling of confined concrete-I:
Drucker-Prager type plasticity model.” Eng. Struct. 32
(3): 665-679.
SIMULTECH 2019 - 9th International Conference on Simulation and Modeling Methodologies, Technologies and Applications
120
