
A Solution of a Mathematical Model Which Simulates Football Game
as a Logistics Network
Kenan Mengüç
a
Beykent Unıversity, Applied Schools of Logistics, Akcaburgaz Neighborhood, 34522 Esenyurt, İstanbul
Keywords: Transshipment Problem, Optimization, Spatio-temporal Data, Branch and Bound Algorıthm, Football,
Logistic.
Abstract: Routing is very important in team sports as well as in many parts of daily life. On 01.07.2018, in the World
Cup tournament organized in Russia, Spain lost the match with a penalty shootout although it performed a
higher number of passes. As a result of the elimination of Spain despite its very high ball possession, the
nature of modern football doesn’t necessarily require the multiplicity of passes. It is important to know where
the passes are done, rather than high amounts of them. This study has simulated a mathematical model by
bringing a different interpretation to the categorization of pass throws.
1 INTRODUCTION
In recent years the interest of the world in football has
been increasing. The economies formed in football
organizations are developing many industrial sectors.
Increased interest has enhanced the importance of
every moment in the game. Many companies have
made measurements about the tactics and the players
within the football game. Since these measurement
data is high confidence level, they give significant
results for the game. In this study, a mathematical
model was created in order to use these data more
effectively. Similar scenarios are used between the
logistics management and the football game for the
model. The purpose of the study is that build a
mathematical model by using this data set. Thus this
mathematical model provide to determine the best
attack route within the game for a team.
2 MANUSCRIPT PREPARATION
2.1 Literature
Over the last 50 years there has been a lot of
publication on optimization in sport (Wright, 2009).
The rules of the game in team sports were also
effective in speeding up the game (Takeuchi et al.,
a
https://orcid.org/0000-0002-7536-2124
2014). Football is a dynamic game as a course of its
nature (Barghi, 2015). Football is a team game and
the team's arrangement within the pitch is important.
High level of communication among players is
important for success (Grund, 2012). In addition the
team arrangement in digital game industry and in
robot game technology has been seen to have a
serious impact on team results (Razykov, 2006).
The amount and importance of big data is
increasing day by day. This big data take an important
place in football. Many measurement companies
make serious measurements of the game and players.
Opta Sportsdata is an academically reliable company
that makes these measurements (Liu et al., 2013).
Opta Sportdata data was also used to determine a
strategy for the football team (Stein et al., 2017). In
addition, another study aimed at the best players
selection for team squad (Tavana et al., 2013). In
Gudmundsson and Horton's study, spatio-temporal
data is used instead of classical percentage data
(Gudmundsson and Horton, 2017). Yet another study
has developed a clustering model for all time-spatial
routes that have ended with a goal (Hirano and
Tsumoto, 2005).
Passes between players takes an important place
in football. In a study conducted for 4 major leagues
in Europe, it was indicated that the teams with the
high pass were in higher places in the score ranking
(Cintia et al., 2015). The effect of the passes on the
Mengüç, K.
A Solution of a Mathematical Model Which Simulates Football Game as a Logistics Network.
DOI: 10.5220/0007917801050112
In Proceedings of the 7th International Conference on Sport Sciences Research and Technology Support (icSPORTS 2019), pages 105-112
ISBN: 978-989-758-383-4
Copyright
c
2019 by SCITEPRESS – Science and Technology Publications, Lda. All rights reserved
105
Spain National Football team's game was told to be
very important (Pena and Touchette, 2012). The
passes also vary according to the way the ball
tranships (Malqui, 2017). The problems of logistics
and football are quite similar. Krishnan and Rao's
transshipment model between two points in their
study has been implemented in this study (Krishnan
and Rao, 1965).
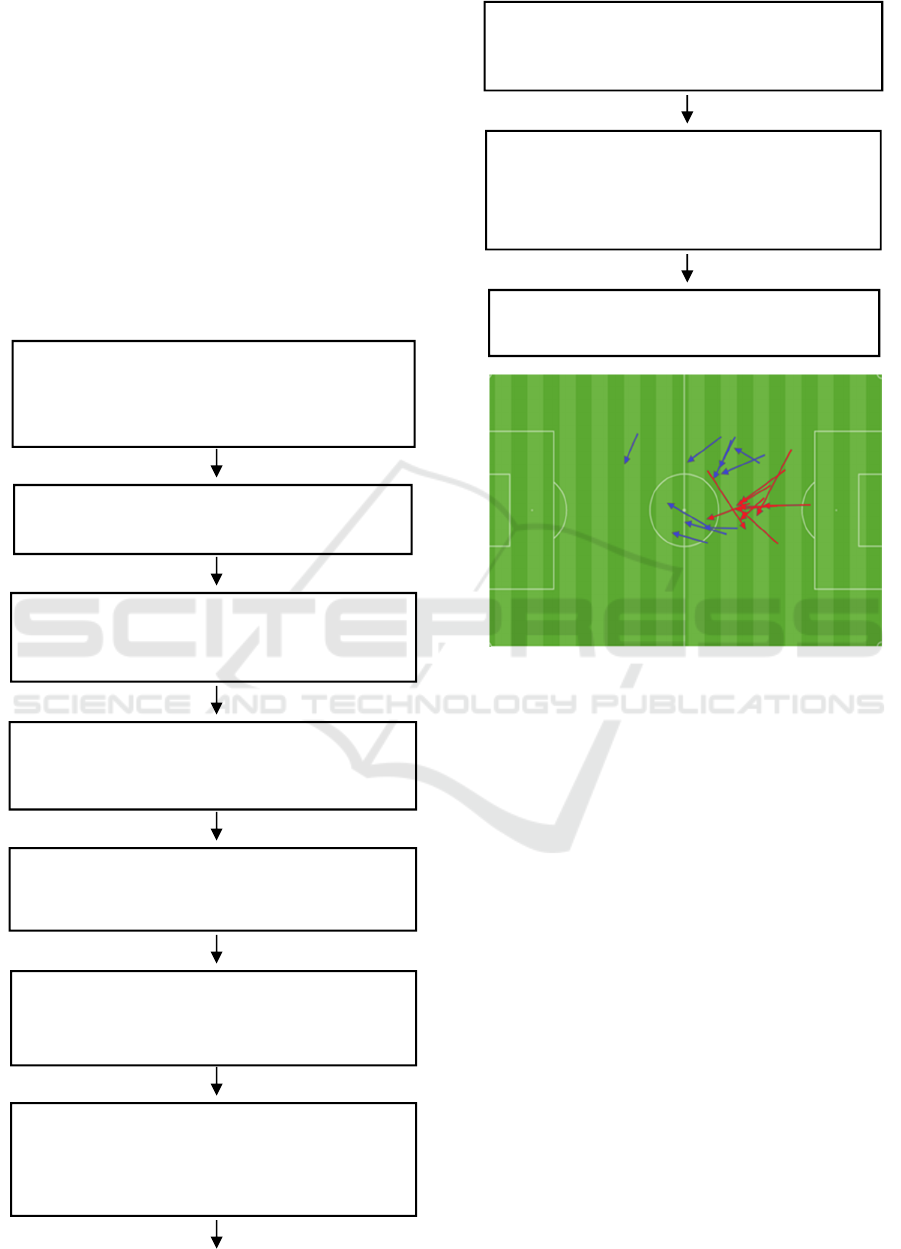
2.2 Model Creation
This study was started by reference to a transshipment
problem model. After that the study was followed
with regard to the steps below.
Figure 1: Passes of a player in a match.
Each pass in a season of Başakşehir F.K is
analyzed according to
,
,
coordinates.
Each player's passes are converted by using the
formula 1, 2, 3 and 4 according to the 4 main
directions that are left, right, back and forward.
0⇒
(1)
0⇒
(2)
0⇒
(3)
0⇒
(4)
/
∪
)
(5)
In this formula;
: Percentage of pass success for direction λ.
λ={r, l, f, b}
: Set of successful passes.
: Set of unsuccessful passes.
The data obtained were calculated in
meters according to the measurements of the
pitch and categorized for each player of
Başakşehir F.K' squad.
The measurement data obtained are
separated into
,
,
coordinates.
Four target directions have been
determined and the data is categorized as
forward, backward, right and left direction.
Passes are categorized by a scoring
method according to how far the ball is
brought closer to the penalty zone.
The general score has been created as a
result of the analysis of all seasonal passes
for each pla
y
er in 4 different directions.
General position of players in the pitch
was determined according to the matches
played by the players in a season.
Player preferences have been determined
for the squad of the team. According to the
data we obtained in Step 6, players are
assigned to zones.
The two most successful options between
possible players in the zone are determined to
transshipment.
In the scenario created, the model is
intended to find the best combination of pass
and player for the event of the ball passing
through that zone during the match.
The model is run for routes of three
different positions of played match.
icSPORTS 2019 - 7th International Conference on Sport Sciences Research and Technology Support
106
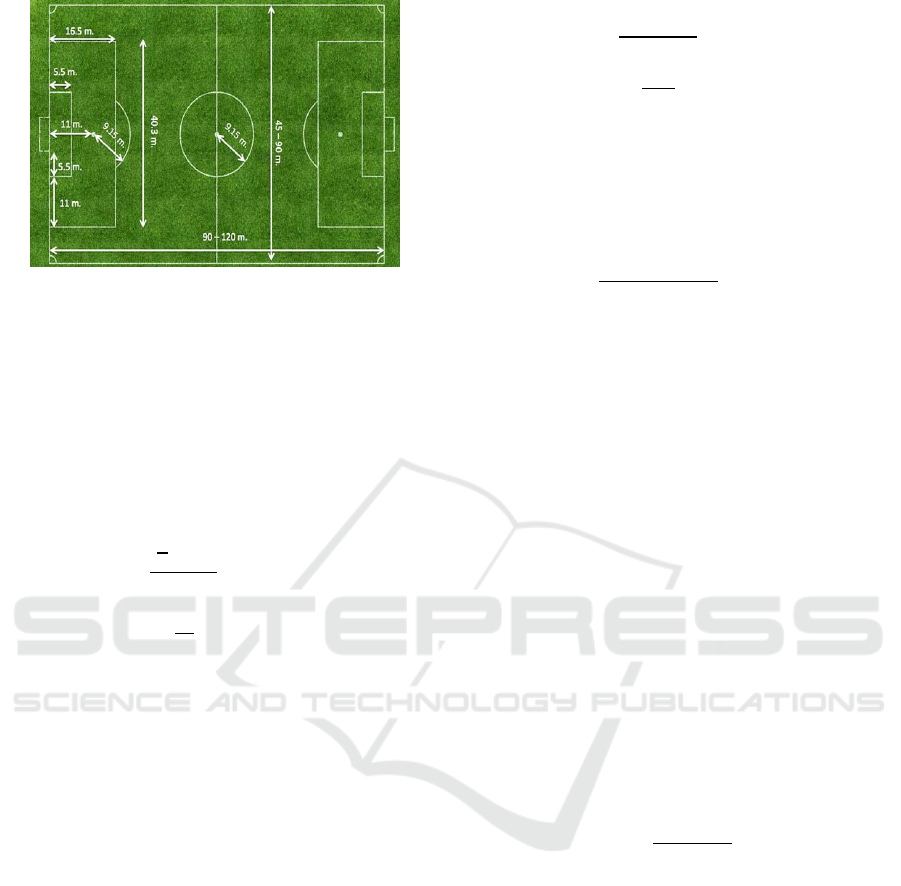
Figure 2: General pitch measurements.
Although there is not any standard measure of a
pitch in the world, most of the stadium size in Turkey
are 68 meters wide and 105 meters long. The
previously acquired data are processed according to
size of the pitch in Turkey such as step 4. According
to this, the formula 6 is used for right and left
direction passes and the formula 7 is used for forward
and back direction passes.
2
∗
|
|
(6)
∗
|
|
(7)
i: Starting point of transshipment of ball for each
pass.
j: Ending point of transshipment of ball for each pass.
: The success score of the vertical pass from i to
j.
: The success score of the horizontal pass from i
to j.
e: The length of the pitch where the match will be
played.
b: The width of the pitch where the match will be
played.
The 34 statement in the Formula 8 shows the center
point of the pitch which is 68 meters wide. Therefore
each ball transshipped to the center will have a high
score. Similarly, the expression 105 in formula 9
shows the length of the field. Thus, each pass that
makes the ball approach the opponent's goal will be
more valuable.
|
34
|
34
∗
|
|
(8)
105
∗
|
|
(9)
The red and blue arrows in figure 1 represent
successful and unsuccessful passes. Therefore I
categorized the previously passes analyzed as
successful and unsuccessful.
,
are
categorized as
,
,
and
.
∑
∑
∀
(10)
In this formula;
: The average score of the pass done in the λ
direction according to
,
,
and
λ={r, l, f, b}
: The score of i th successful pass in direction λ.
0,
,
˅
: The score of i th unsuccessful pass in direction λ.
: Total number of passes made in direction λ.
0,
=
˅
Linear Approach:
The average score for the average distance is known.
So we created a score data for any distance. Two
different methods were used for this score. The linear
approach formula is given below.
∗
(11)
100,
/100 (12)
> 100,
1 (13)
In this formula;
: The success percentage at the desired distance
for the direction λ of the player k.
: The success percentage at the average distance
for a season for the direction λ of the player k.
: The average pass distance for the direction λ of
the player k.
: The desired distance for i th pass of the player
k.
Exponential Approach:
A quadratic equation formula was used for the
exponential approach. This formula is given below.
A Solution of a Mathematical Model Which Simulates Football Game as a Logistics Network
107

∗
(14)
100,
/100 (15)
> 100,
1 (16)
1
1
1
(17)
1
1
1
(18)
: is the pass score at the desired distance for the
direction λ of the player k.
: is the pass score at the desired distance done by
player k from i to j.
The football ball will horizontally and vertically
change its position against the opposing goal with the
pass to be thrown. The distance of the pass is
converted to score according to formulas 7 and 8.
The
scores in formulas 13 and 14 are
as follows:
: Back direction passes or forward direction
pass is score converted by formula 7, 8.
: Left direction passes or right direction pass is
score converted by formula 7, 8.
The following model is the interpretation of a
transportation model according to the football game.
ObjectiveFunction:
Max
c
∗x
ij
(19)
Constraints:
x
x
∀i,j,z,k
(20)
x
x
1 ∀i,j
(21)
∑
x
,
∑
x
,
0
∀i1,2,..mvei
γ
,F
(22)
∑
x
,
∑
x
,
1 ∀
γ
(23)
x
,
x
,
1
(24)
x
1, c
0
x
0, c
1
(25)
,0
(26)
x
∈0,1 i, j =1,2,3,..m
(27)
19: The objective function is to maximize the sum of
the scores according to the distance of k or v player's
pass. The number 60 indicates that the football pitch
was divided into 60 symmetric zones.
m: it’s indicates the number of parts that form the
pitch. The football pitch is divided into approximately
60 equal parts. Which corresponds to an area of
approximately 1 square meter of each piece. m is 60
for this model
:Indicates whether the ball has been transferred
from zone i to zone j.
: Indicates the pass score of k player from i to j.
S: It is a set of players who play in the first 11 of a
team. (k, v ϵS)
20: A player cannot throw pass to himself.
21: One of the players k can throw pass from one
zone.
22: The ball must exit from that zone if it has once
entered the zone.
:In a game played, the ball is a zone where the ball
is taken from the opponent and where the attack
organization begins. (1,2….
F: is the region where the arc starting in the θ region
and ending in the t region is terminated. (θ, t ϵ F),
{45, 46, 50, 51, 52, 53, 56, 57, 58, 59} ϵ F
23: The ball can enter the pitch only from certain
zones.
24: The attack may only end in certain zones.
25: Sub tour constraint.
θ: The first of the effective regions for ending the
attack. (ϵF)
t: The last effective region for ending the attack
(t ϵ F )
2.3 Application of the Model
The match of Besiktas J.K with Basaksehir F.K in
2014/15 season was investigated for this study. The
squad in of Başakşehir F.K. in the match was taken
exactly and the players assignments as in Figure 3.
icSPORTS 2019 - 7th International Conference on Sport Sciences Research and Technology Support
108
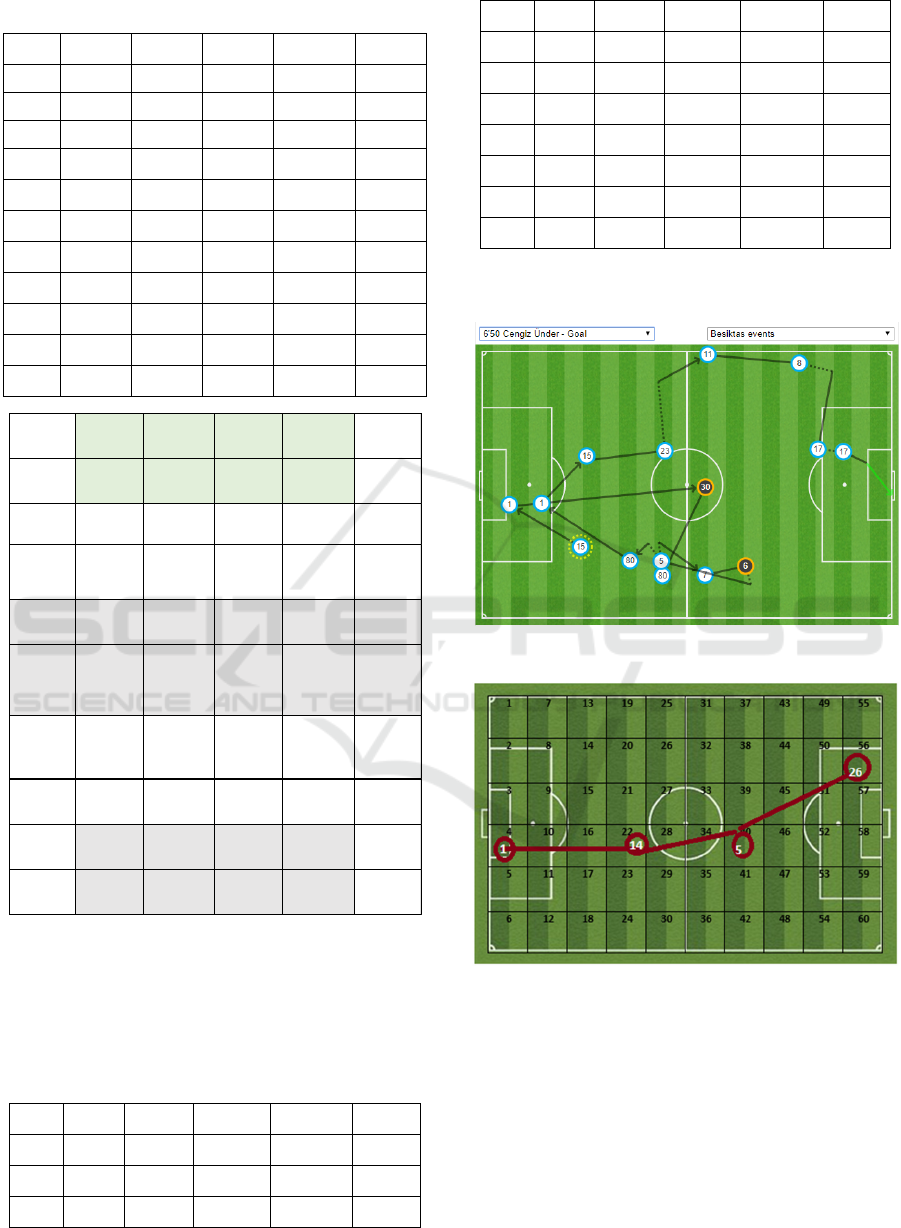
Table 1: The scores of the players.
No Score Left Right Forward Back
#1 Points 8,810 7,827 16,88 0,042
#80 Points 4,797 2,096 6,447 3,539
#14 Points 7,006 5,387 6,661 4,628
#15 Points 5,832 6,285 4,479 3,674
#11 Points 2,472 4,043 7,312 3,960
#7 Points 5,156 5,399 5,578 3,261
#8 Points 4,838 5,774 5,298 3,459
#5 Points 6,662 7,359 6,156 3,075
#23 Points 5,119 4,888 4,443 3,422
#17 Points 5,078 5,076 5,234 3,579
#26 Points 3,202 4,491 3,962 3,172
Figure 3: Regional assignment.
Table 1 shows the scores of the players of
Başakşehir for each direction. Formula 8 and 9 were
used for this scoring.
Table 2: The average pass success rates.
No
Ratio
Left Right
Forward
Back
#1 % 56,9 61,3 56,9 100
#80 % 83,19 76,92 73,47 96,21
#14 % 83,3 83,5 79,9 95,4
#15 % 84,5 86,8 79 96,1
#11 % 53,5 87,4 64,4 95,7
#7 % 73,8 84,3 64,9 90,7
#8 % 82,9 81 75,5 88,5
#5 % 85,3 85,54 79,77 97,24
#23 % 80,3 81,5 72,02 96
#17 % 74,7 76,3 62,4 90,3
#26 % 77,34 76,31 63,57 88,43
The following figures show the Optasport routes and
routes of the model.
Figure 4: Attack at 6th minutes.
Figure 5: Exponential approach at 6th minutes.
6.Region5.Region*(1) 4.Region*(1) 3.Region
*(1)
2.Region*(1) 1.Re gion
*(11)
12.Re gion
*(80)
11.Re gion*(1)
*(80)
10.Region*(1) 9.Region
*(1)
8.Region
*(15)
7.Re gion
*(11)
18.Re gion
*(80)*(15)
17.Re gion
*(15)*(11)*14
*(14)*(80)
16.Region
*(11)*(14)*(15)
15.Region
*(11)*(14)
*(15)
14.Region*(11)
*(14)*(15)
13.Region
*(11)
24.Re gion
*(7)*(8)*(15)
*(80)
23.Re gion
*(14)*(11)*(5)
*(8)*(15) *(80)
22.Region
*(14)*(8)*(5)
*(23)
*(15)*(11)
21.Region
*(8)*(23)*(14)
*(15)*(5)
20.Region
*(8)*(23)*(15)
*(5)*(14)*(11)
19.Region
*(8)*(17)*(11)
*(23)*(5)
30.Re gion
*(8)*(7)*(17)
*(15)*(80)
29.Re gion
*(8)*(14) *(15)
*(80)*(5)
28.Region
*(8)*(14)*(15)
*(23)*(5)
27.Region
*(8)*(14)
*(23)*(5)*(15)
26.Region
*(11)*(23)*(8)
*(14)*(15)*(5)
25.Region
*(11)*(23)*(5)
*(17)*(8)
36.Re gion
*(7)*(8)*(17)
*(80)*(15)
35.Re gion
*(7)*(15) *(8)
*(17)*(23)
*(80)*(26)*(5)
*(14)
34.Region
*(15)*(8)*(17)
*(23)*(26)*(5)
*(14)
33.Region*15
*(8)*(17)*(23)
*(26)*(5)
32.Region
*(15)*(8)*(17)
*(23)*(26)*(5)
*(11)
31.Region
*(15)*(8)*(17)
*(23)*(26)*(5)
*(11)
42.Re gion
*(7)
*(8)*(17)
*(80)*(15)
41.Re gion
*(7)*(15) *(8)
*(17)*(23)
*(80)*(26)*(5)
40.Region
*(15)*(8)*(17)
*(23)*(26)*(5)
39.Region
*(15)*(8)*(23)
*(26)*(5)
38.Region
*(15)*(8)*(17)
*(23)*(26)*(5)
37.Region
*(8)*(17)
*(26)*(5)
*(11)
48.Re gion
*(7)*(8)*(17)
*(80)*(15)
47.Re gion
*(7)*(8)*(17)
*(80)*(26)
46.Region
*(26)
45.Region
*(5)*(26)
44.Region
*(5)*(26)*(8)
*(17)
43.Region
*(8)*(17)
*(26)*(11)
54.Re gion
*(7)*(17)
*(80)
53.Re gion
*(7)*(80)
*(26)
52.Region 51.Region 50.Region
*(26)
49.Region
*(17)
60.Re gion*(7) 59.Region 58.Region 57.Region 56.Region 55.Region
A Solution of a Mathematical Model Which Simulates Football Game as a Logistics Network
109
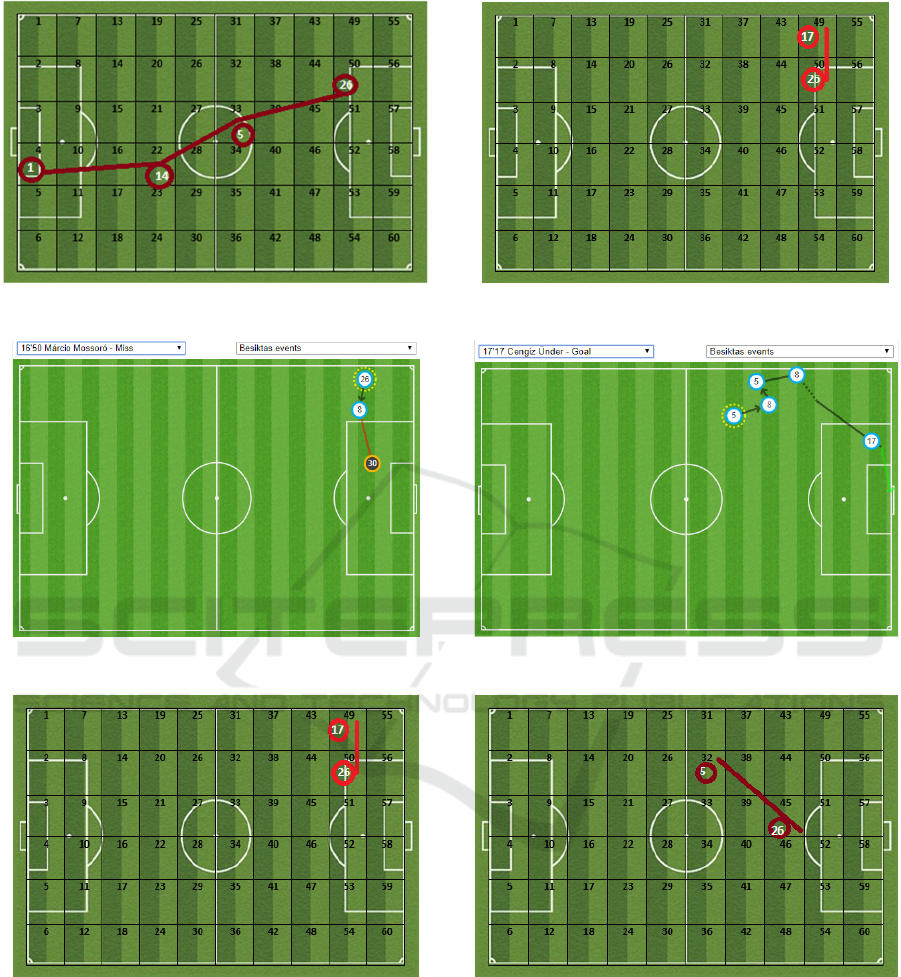
Figure 6: Linear approach at 6th minutes.
Figure 7: Attack at 16th minutes.
Figure 8: Exponential approach at 16th minutes.
Figure 9: Linear approach at 16th minutes.
Figure 10: Attack at 17th minutes.
Figure 11: Exponential approach at 17th minutes.
icSPORTS 2019 - 7th International Conference on Sport Sciences Research and Technology Support
110
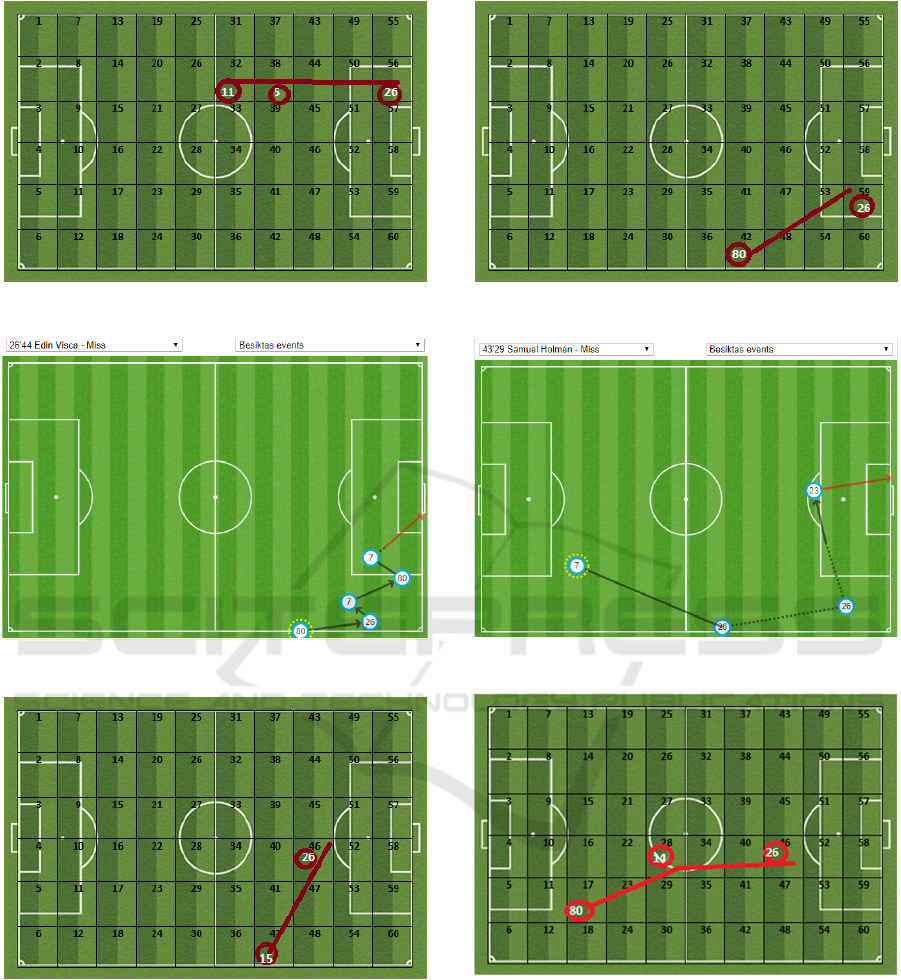
Figure 12: Linear approach at 17th minutes.
Figure 13: Attack at 26th minutes.
Figure 14: Exponential approach at 26th minutes.
Figure 15: Linear approach at 26th minutes.
Figure 16: Attack at 43th minutes.
Figure 17: Exponential approach at 43th minutes.
A Solution of a Mathematical Model Which Simulates Football Game as a Logistics Network
111
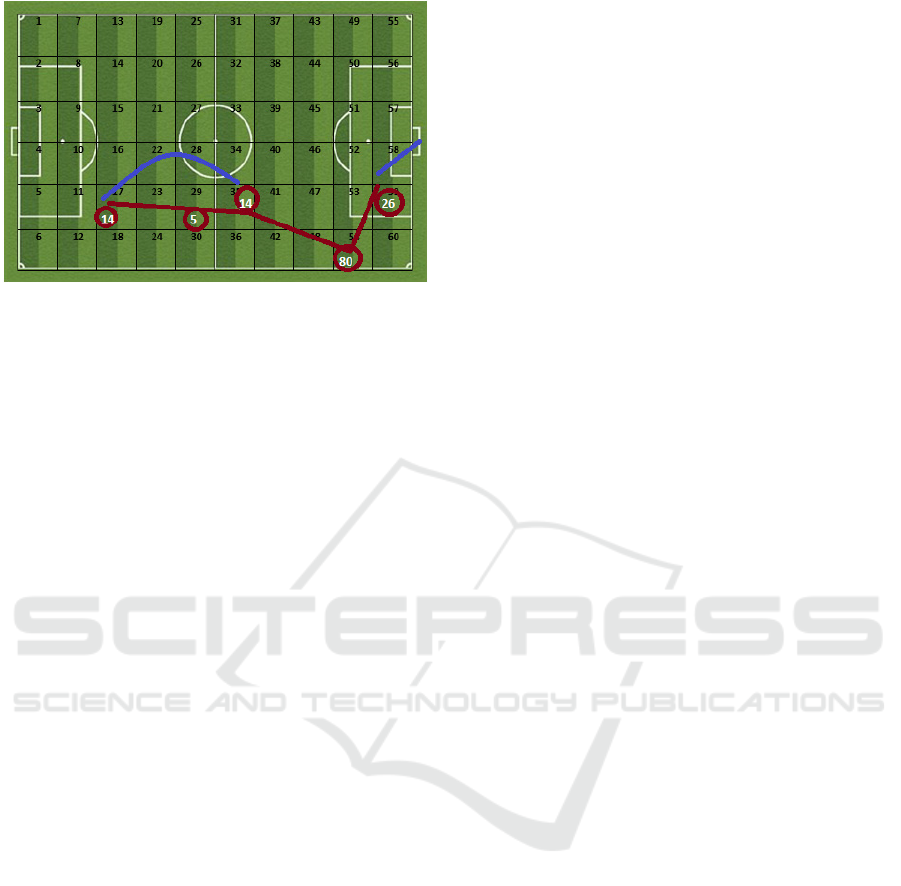
Figure 18: Linear approach at 43th minutes.
3 CONCLUSIONS
The reason for selecting these special minutes in the
match is the success of the attack occurs in these
minutes. In particular, the route in the 26th minute of
match and route of the model using the linear data is
quite similar. Apart from this, the linear and
exponential approach for the 16th position of the
match showed the same result. The first and end
points of the position at 17th minute of the match are
quite similar to the results of the linear approach. In
general, the linear approach shows quite similar
preferences with actual routing, whereas the
exponential approach has chosen to reach the
effective zones with less passes such as counter
attack.
REFERENCES
Barghi, A. R. (2015). Analyzing dynamic football passing
network. PhD Thesis. Université d'Ottawa/University
of Ottawa.
Cintia, P., Giannotti, F., Pappalardo, L., Pedreschi, D., and
Malvaldi, M. (2015). The harsh rule of the goals: Data-
driven performance indicators for football teams. Paper
presented at the 2015 IEEE International Conference
on Data Science and Advanced Analytics (DSAA).
Grund, T. U. (2012). Network structure and team
performance: The case of English Premier League
soccer teams. 34(4), 682-690.
doi:10.1016/j.socnet.2012.08.004
Gudmundsson, J., and Horton, M. J. A. C. S. (2017). Spatio-
temporal analysis of team sports. 50(2), 22.
Hirano, S.,and Tsumoto, S. (2005). A clustering method
for spatio-temporal data and its application to soccer
game records. Paper presented at the International
Workshop on Rough Sets, Fuzzy Sets, Data Mining, and
Granular-Soft Computing.
Krishnan, K., and Rao, V. J. J. o. I. E. (1965). Inventory
control in N warehouses. In (Vol. 16, pp. 212-&).
Liu, H., Hopkins, W., Gómez, A. M., and Molinuevo, S. J.
J. I. J. o. P. A. i. S. (2013). Inter-operator reliability of
live football match statistics from OPTA Sportsdata.
13(3), 803-821.
Malqui, J. L. S. (2017). A visual analytics approach for
passing strateggies analysis in soccer using geometric
features.
Pena, J. L., and Touchette, H. J. a. p. a. (2012). A network
theory analysis of football strategies.
Razykov, S. (2006). Optimal offensive player positioning
and collaboration in a digital soccer game. School of
Interactive Arts and Technology-Simon Fraser
University,
Stein, M., Janetzko, H., Seebacher, D., Jäger, A., Nagel, M.,
Hölsch, J., and Grossniklaus, M. J. D. (2017). How to
make sense of team sport data: From acquisition to data
modeling and research aspects. 2(1), 2.
Takeuchi, J., Ramadan, R., and Iida, H. J. I. P. S. o. J.
(2014). Game refinement theory and its application to
Volleyball. 2014, 1-6.
Tavana, M., Azizi, F., Azizi, F., and Behzadian, M. J. S. M.
R. (2013). A fuzzy inference system with application to
player selection and team formation in multi-player
sports. 16(1), 97-110.
Wright, M. B. (2009). 50 years of OR in sport. Journal of
the Operational Research Society, 60(sup1), S161-
S168.
icSPORTS 2019 - 7th International Conference on Sport Sciences Research and Technology Support
112
