
Ripple Effect Analysis of Data Flow Requirements
Bui Do Tien Hung, Takayuki Omori and Atsushi Ohnishi
Department of Computer Science, Ritsumeikan University, 1-1-1 Noji Higashi, Kusatsu, Shiga, 525-8577, Japan
Keywords:
Data Flow Requirements, Ripple Effect Analysis in Requirement Modification, Data Flow Diagram.
Abstract:
Ripple effect in the modification of software requirements should be properly analyzed, since it may cause
errors of software requirements. We have already proposed a ripple effect analysis method in deletion or
update of data flow requirements. In this paper, we enhance our method considering ripple effect analysis in
adding new data flows requirements. Our method will be illustrated with examples.
1 INTRODUCTION
In software development, software requirements may
change or evolve due to many reasons. This modifi-
cation would lead to ripple effect which could have
effect on the whole software requirements. Thereby,
there is a need for proper ripple effect analysis of
these modifications. Without considering ripple ef-
fect in modification of requirements, wrong require-
ments may remain and software development project
will not be successful.
Our aim is to establish a ripple effect analysis
method in modification of data flow requirements. In
this paper, we will introduce a ripple effect analysis
method in requirements changes. This method fo-
cuses on Data Flow Diagram (DFD), since it is widely
used in practical software development. This diagram
is the main diagram in Structured Analysis (DeMarco,
1978; Stevens et al., 1974). Data dictionary and pro-
cess description are sub-models in this technique. By
using these models, we propose a method to analyze
data flow requirements modification. We assume that
data stores and actors in the DFD are not changed in
requirements modifications; thereby, we do not apply
ripple effect analysis to these components.
In section 2, related works will be described. In
section 3, we will propose a ripple effect analysis
method in modification of elements of data flow di-
agram. In section 4, we will illustare our method with
an example of calculation system of apartment fee. In
section 5, we will briefly touch upon our prototype
system. Lastly we will conclude our research.
2 RELATED WORKS
In (Zhao et al., 2010) a ripple effect method
of requirements evolution using relationship matrix
among requirements is proposed. In (Yu-Qing et al.,
2009) another ripple effect method of requirements
evolution using relationship matrix among require-
ments is proposed. In case of data flow requirements,
reachable data flow requirements are not always af-
fected by requirement change. So, their method can-
not be applied to ripple effect analysis of data flow
diagram.
In general, code-based technique accounts for the
largest proportion of ripple effect analyzing tech-
niques (Bohner and Arnold, 1996). Since code-based
techniques are costly as the system already be de-
ployed. We intend to mitigate the impact change from
the requirement phase. Yau, Collofello and MacGre-
gor proposed a method of ripple effect analysis of per-
formance requirements by checking the modification
of decomposed performance requirements and iden-
tifying all of the mechanisms for the propagation of
performance (performance attiributes) changes, criti-
cal sections, and performance attiributes in a Fortran
program (Yau et al., 1978). Their method focuses on
ripple effect analysis of performance requirements in
modification of Fortran programs and cannot be ap-
plied to ripple effect analysis in modification of data
flow requirements, while our method focuses on rip-
ple effect analysis of data flow requirements in modi-
fication of data flow diagrams.
Briand, Labiche and Sullivian proposed a method
of impact analysis and change management based
on the UML model, specifically the class diagram
(Briand et al., 2003). Due to their claim, UML por-
262
Hung, B., Omori, T. and Ohnishi, A.
Ripple Effect Analysis of Data Flow Requirements.
DOI: 10.5220/0007917902620269
In Proceedings of the 14th International Conference on Software Technologies (ICSOFT 2019), pages 262-269
ISBN: 978-989-758-379-7
Copyright
c
2019 by SCITEPRESS – Science and Technology Publications, Lda. All rights reserved

trays the system at the higher level of extraction than
code-based impact method (Briand et al., 2003). Im-
pact analysis methods of requirements changes are
widely researched and proposed (Hassine et al., 2005;
Saito et al., 2012; Suma et al., 2012; Mokamme et al.,
2013; Gerzin et al., 2014; Haleem and Beg, 2015).
However, these methods cannot be applied to data
flow requirements. Our method can be applied to
data flow requirements and detect requirements to be
changed through ripple effect analysis.
As our former research, we have developed a rip-
ple effect analysis method (Heayyoung et al., 2018).
This method can be applied in deletion and/or update
of elements of data flow diagrams, but cannot be ap-
plied in addition of elements of data flow diagrams.
We propose an enhanced method of the previous work
in order that our proposed method can be applied in
deletion, update and/or addition of elements of data
flow diagrams.
3 RIPPLE EFFECT ANALYSIS
METHOD
Data flow diagram, data dictionary and process de-
scription are models in structured analysis (DeMarco,
1978). In this section we introduce rules of data flow
diagram and states of data flow and process in our
method.
3.1 Rules of Data Flow Diagram
Some rules exist in writing data flow diagram as
shown below (DeMarco, 1978).
• Each process should have both at least one input
and one output.
• Data store and actor have at least one data flow.
• Each data flow should attach to at least one pro-
cess.
We assume that these rules should be kept in data
flow diagrams in ripple effect analysis.
3.2 States of Data Flow in Ripple Effect
Analysis
We introduce the following 5 states of data flow in
ripple effect analysis. These states are “I” “N” “C”
“D” and “A.”
• State “I” means initial state. A data flow with this
state indicates that ripple effect analysis has not
been applied to this data flow yet.
• State “N” means no effect. A data flow with this
state indicates that this data flow is not affected in
ripple effect analysis.
• State “C” means changed. A data flow with
this state indicates that this data flow should be
changed.
• State “D” means deleted. A data flow with
this state indicates that this data flow should be
deleted.
• State “A” means added. A data flow with this state
indicates that this data flow is newly added to the
system.
3.3 States of Process in Ripple Effect
Analysis
We introduce 7 states of process of data flow diagram
in ripple effect analysis. These are “I” “N” “CC”
“CN” NC” “D” and “A.”
• A process with state “I” indicates that ripple effect
has not been applied to this process yet.
• A process with state “N” indicates that this pro-
cess has no effect.
• “CC” means both input and output of a process
are changed. A process with this state indicates
that both input and output of the process should
be changed.
• A process with state “CN” means that input of the
process should be changed, but its output has no
effect.
• A process with state “NC” means that input of
the process has no effect, but its output should be
changed.
• A process with state “D” means that this process
should be deleted.
• A process with state “A” means that this process
is newly added.
3.4 Assumptions of Ripple Effect
Analysis
We also assume that the following conditions are kept
in the analysis.
• Data flow, data dictionary, and process description
should be correct before the analysis.
• Each process in the bottom layer of data flow dia-
gram needs to have its process description.
Ripple Effect Analysis of Data Flow Requirements
263

3.5 Procedure of Ripple Effect Analysis
Before analysis, an analyst should identify data flows
and/or processes to be changed. He can also identify
data flows and/or processes not to be changed, if nec-
essary.
The procedure of analysis consists of five steps.
Step 1: The analyst identifies data flows and pro-
cesses which are corresponding to requirement
changes and specifies the states of changes, such
as, “A,” “D,” and “C.”
Step 2: Applies pre-defined tables in order to deter-
mine the states of elements with ripple effect.
Step 3: Analyzes the lower layer of data flow dia-
gram if he cannot make decisions with pre-defined
tables.
Step 4: Stops the ripple effect analysis if states of all
elements of DFDs are fixed or there are any incon-
sistencies in status of data flows or processes.
Step 5: Goes back to Step 1 to analyze other pro-
cesses and data flows.
3.6 Pre-defined Tables in Ripple Effect
Analysis
3.6.1 Lower Layer of Process
A process may have child processes, which clarify
its functions. Both input and output of children pro-
cesses need to be consistent with these of the parent
process.
Figure 1: Process X and its lower DFD.
In Figure 1, Process X has three children, which
are shown in the lower layer of Process X. The input
of Process X should be consistent with input of de-
tailed DFD. In Figure 1, input of Process X should be
consistent with input of Process X1. Similarly, output
of Process X should be consistent with output of Pro-
cess X2 and X3. The state of process/data flow will
be determined using the states of children elements.
Table 1: State of process is decided by state of input.
No. Input Process
1 D D
2 Not D Check the lower DFD
Table 2: State of output is decided by state of input and
process.
No. Input Process Output
3 D D D
4 D Not D Inconsistent
5 N N N
6 N NC Check the
lower DFD
7 N D or CN Inconsistent
or CC or A
8 C CN N
9 C N or CC Check the
lower DFD
10 C NC or D or A Inconsistent
11 A Not A Inconsistent
12 A A A
For example, if states of Process X1, X2, X3 are “A,”
state of Process X becomes “A.” If states of the three
children processes are “D,” the state of Process X be-
comes “D.” If states of children processes are “D” and
“A,” state of the parent process becomes “C.”
3.6.2 Forward Analysis
In forward analysis, we will analyze from input to
process and from process to output. Table 1 and 2
will be used for this analysis.
Table 1 indicates that states of process can be de-
cided by states of input. The state “Not D” includes
state I, C, A and N. The rule No. 1 of Table 1 means
that when all the input are deleted, then the process
which receives them should be deleted. Otherwise,
the state of process cannot be determined and the
lower layer of the process should be investigated to
decide the state of the parent process.
This investigation may be applied repeatedly until
the bottom layer of DFD. We assume that each pro-
cess of the bottom layer of DFD has process descrip-
tion and we can determine the states of processes of
the bottom layer of DFD. Then we integrate states of
the elements of upper layers of DFD based on Table
3.
In Table 3, element means input or output. The
states of child elements are same, the state of the par-
ent element becomes the same state. Otherwise, for
example, some input are deleted and some input are
changed in the child processes, the state of the corre-
ICSOFT 2019 - 14th International Conference on Software Technologies
264

Table 3: Integration of state of upper element of DFD by
states of lower elements.
Child elements Parent element
D D
A A
N N
Otherwise C
Table 4: State of process is decided by state of output.
No. Output Process
13 D D
14 Not D Check the lower DFD
sponding input of the parent process becomes C. After
states of elements are decided, the states of processes
will be determined based on Table 7.
In case of newly added input, there are 2 options.
One is to create a new process which receives the new
input. The other is to adopt an existing process which
receives the new input. For the second option, analyst
will check the lower DFD of existing process which is
related to new input to make sure it could receive new
input; otherwise, analyst would create a new process
for new input.
Table 2 is consequently used after Table 1. In the
rule 4, all of the input are deleted, but the process
still exist. This situation violates the first rule in sec-
tion 3.1. So, we regard this situation as inconsistent
and stop the analysis. In the rule 12, after deciding
to create new process; new output will be generated
from new process. On the other hand, in the rule 11,
an existing process receives newly added input only.
This becomes inconsistent, because existing process
should have some existing input. Our previous work
does not handle state A, and the state A in tables are
newly enhanced in the proposed method.
3.6.3 Backward Analysis
In backward analysis, we will analyze backwardly,
from output to input. Table 4 and 5 would be used.
Table 4 and 5 are symmetrical to Table 1 and 2,
each other. In Table 4, we can decide the state of pro-
cess from state of output. By using Table 5, we can
extend the analysis to input basing on state of process
and output.
3.6.4 Other Cases
Table 6 indicates that the states of both input and out-
put can be decided by state of process. The rule 30
shows that when process is added to the system, it
will either receive new input and output or the exist-
ing input and output or changed input and output.
Table 5: State of intput is decided by states of output and
process.
No. Output Process Input
15 D D D
16 D Not D Inconsistent
17 N N N
18 N CN Check the
lower DFD
19 N D or NC Inconsistent
or CC or A
20 C NC N
21 C N or CC Check the
lower DFD
22 C CN or D or A Inconsistent
23 A Not A Inconsistent
24 A A A
Table 6: Input and output states are decided by state of pro-
cess.
No. Process Input Output
25 D D D
26 N N N
27 CN Check the N
lower DFD
28 NC N Check the
lower DFD
29 CC Check the Check the
lower DFD lower DFD
30 A A or N or C A or N or C
In Table 7, the state of process will be decided by
both states of input and output. For instance, when
there is new input and output to the system, we can
either create new process or change the existing pro-
cess to handle new input and output. In Table 7, “X”
indicates “inconsistent.”
Table 7: Process state is decided by states of input and out-
put.
❳
❳
❳
❳
❳
❳
❳
❳
❳
❳
output
input
N D A C
N N X CN CN
D X D X X
A NC X A or CC CC
C NC X CC CC
4 EXAMPLE: CALCULATION OF
APARTMENT FEE
Generally, in Japan, when foreigners want to rent an
apartment, they have to work with real estate agency
Ripple Effect Analysis of Data Flow Requirements
265
and insurance company. In Figure 2, customer sends
his or her personal information which are income,
Japanese visa and phone number to the agency. To
make recommendations for the customer, apartment’s
rental fee and thank-youmoney will be extractedfrom
database. Here, the customer and apartment corre-
spond to actors. So, they will not be considered in
analysis.
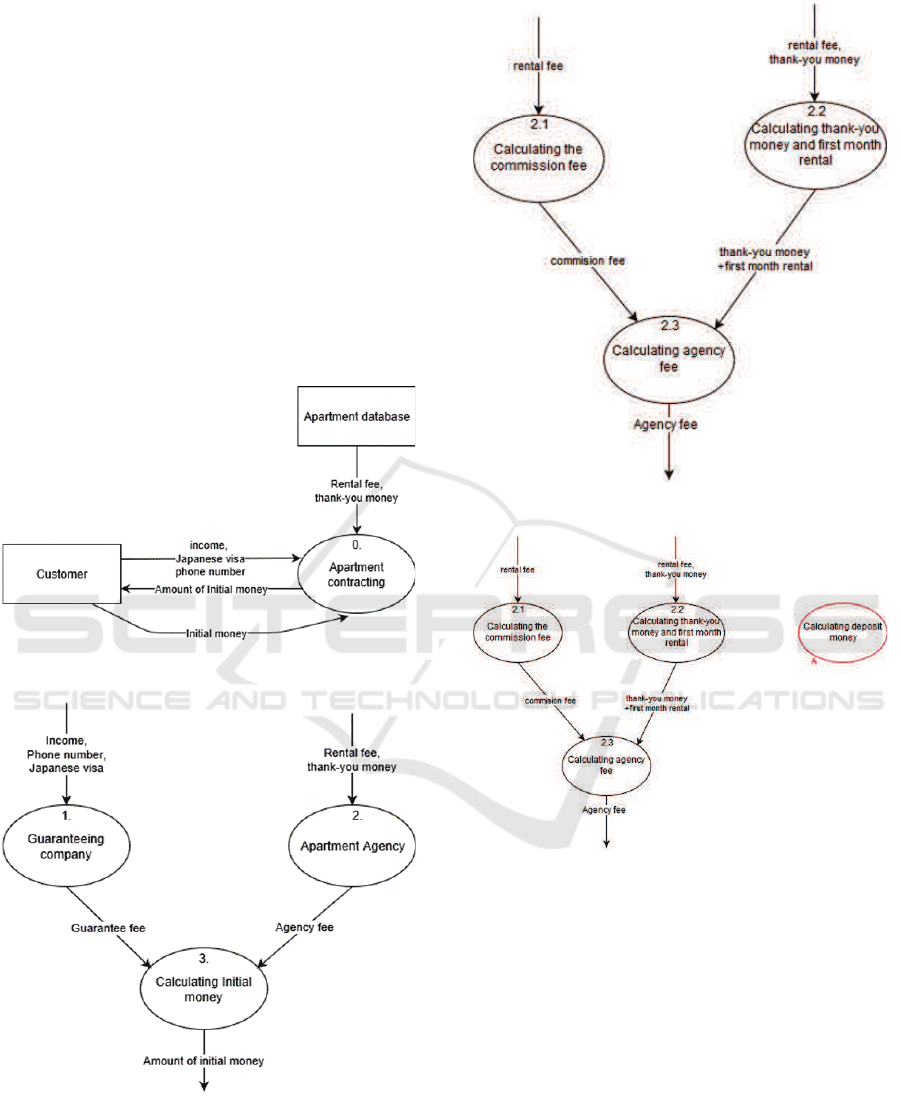
Figure 3 is the level 1 diagram; initial money in-
cludes guarantee fee and agency fee. Figure 4 is
lower layer DFD of process 2 “Apartment agency”.
In this figure, commission fee, thank-you money and
first month rental are paid as agency fee. To restrain
rules, agency should insert deposit money. In case
customers make any damages to the apartment, this
fee will be charged as penalty.
Figure 2: Context level diagram.
Figure 3: Level 1 diagram.
In Figure 5, a new process is added. Due to Table
6, we can create new input or use the exiting input for
this process. Since deposit fee is one-month rental fee
in Japan; we could use rental fee as input for this pro-
cess. In terms of output, in Table 6, new process can
Figure 4: Detailed process 2.
Figure 5: New process is added.
generate new output or existing output. In this case,
new process will generate new output named “deposit
money.”
In Figure 6, input of process 2.3 are changed since
there is a new input “deposit money”. Due to Table
1, we have to check the lower DFD of process 2.3.
But process 2.3 does not have lower DFD, so analyst
checks the process description of the process 2.3 as
shown in Figure 8.
In this case, the agency fee will be replaced by
“the original agency fee + deposit money,” so analyst
will decide that the state of this process becomes CN
(input is changed and output is not affected). Next
step is updating the parent process 2 based on the state
of data flows and processes in this figure.
ICSOFT 2019 - 14th International Conference on Software Technologies
266

Figure 6: The new process generates new output and re-
ceives existing input.
Figure 7: States of upper level DFD after analysis.
In Figure 7, all the elements’ state of parent-
diagram are updated due to the state of its children-
diagram. The process 2 is changed since a new pro-
cess 2.4 is added to the system. The process becomes
bold to mark this change. Other elements of the dia-
gram are not affected.
5 ANALYSIS TOOL
We have developed a prototype system based on the
proposed method (Heayyoung et al., 2018). Currently
this system does not support the analysis of added re-
quirements. This system is written with Java standard
edition 1.8 using Eclipse Neon.3 release (4.6.3). The
line of source code is about 3,600. This system is a 6
person-month product.
We adopted iEdit (iEdit Version 2.40, 2018) as a
DFD editor/viewer. First, users should make DFDs
Agency fee = commission fee + thank-you money
+ first month rental
Figure 8: Process description of Process 2.3.
with iEdit. Second, our system reads internal repre-
sentation of DFDs produced by iEdit and provides the
users with names of DFD elements so that the users
can select no effect/changed/deleted DFD elements as
changed requirements.
After specifying changed requirements, our sys-
tem starts to analyze ripple effects using tables in sec-
tion 3.6. When reaching DFDs of the bottom layer,
system shows process description of each process of
DFDs of the bottom in order that the users can decide
states of DFD elements of the bottom layer.
In the example in (Heayyoung et al., 2018), orig-
inally transportation expenses, accommodation fee,
and daily allowance were paid as trip expenses, and
we gave a changed requirement that daily allowance
will not be paid. As shown in Figure 10, daily al-
lowance is calculated by a process 2.2 named “Cal-
culating Daily allowance.”Input of this process has
been changed, because one of input data, “daily al-
lowance” has been deleted. According to the rule 2
of Table 1, the lower DFD of this process should be
checked. The lower DFD is shown in Figure 9. The
process 2.2.2 receives “Daily
Allowance” and pro-
cess descriprion of the process will be shown to an-
alyst. The process description shows that daily al-
lowance is determined by position code. Analyst
judges that position code will not be needed and
should be deleted, when daily allowance has been
deleted. Then, the process 2.2.2 will be deleted, be-
cause all the input of this process will be deleted.
Throughsimilar steps, all the processes and data flows
are deleted as shown in Figure 9. In these figures,
processes and data flows of dotted lines mean DFD
elements of “D” states. Process of thick line and data
flow of thick line mean DFD elements of “C (CC, CN,
NC)” states.
Then, the upper process will be deleted as shown
in Figure 10, because all the elemnts of the lower
DFD are deleted.
Next, process 2.4 will be checked because input
of this process will be changed. According to the rule
2 of Table 1, the lower DFD of this process should
be checked. In this example, analyst judged that Fi-
nal
Trip Expenses does not have any ripple effects,
althogh process 2.4 should be changed as shown in
Figure 10.
Lastly states of elements of the context diagram
will be determeined as shown in Figure 11.
Comparing ripple effect analysis by an experi-
enced software analyst with analysis by the prototype
Ripple Effect Analysis of Data Flow Requirements
267

Figure 9: The bottom layer of DFD of calculating daily allowance.
Figure 10: The third layer of DFD of accountant process.
Figure 11: The second layer of DFD of trip expenses system.
system, both the precision and recall ratios are 100%.
So, our method can perfectly make ripple effect anal-
ysis in this example.
6 CONCLUSION
We have developed a ripple effect analysis method
for data flow requirements. This method focuses on
data flow diagram, which allows us to investigate the
whole system based on input and output data. To im-
plement our method for practical analysis, we are cur-
rently developing the prototype system based on this
method. This system would allow analysts to detect
ripple effect more efficiently and more easily. Evalu-
ation of our method by applying to practical require-
ments change will be our future work.
ICSOFT 2019 - 14th International Conference on Software Technologies
268

ACKNOWLEDGEMENTS
The authors thank to Ms. J. Heayyoung of our lab-
oratory for her contributions to this research. This
research is partly supported by Grant-in-Aid for Sci-
entific Research, Japan Society for the Promotion of
Science, No.16K00112 and No. 19K11913.
REFERENCES
Bohner, S. and Arnold, R. S. (1996). Software Change Im-
pact Analysis. IEEE Computer Society Press.
Briand, L., Labiche, Y., and O’Sullivan, L. (2003). Im-
pact analysis and change management of uml models.
In International Conference on Software Maintenance
(ICSM’03), pages 256–265.
DeMarco, T. (1978). Structured Analysis and System Spec-
ification. Yourdon Inc., New York.
Gerzin, T., Henkler, S., Stierand, I., and Rettberg, A.
(2014). Impact analysis for timing requirements on
real-time systems. In 20th International Conference
on Embedded and Real-Time Computing Systems and
Applications, pages 1–10. IEEE Computer Society.
Haleem, M. and Beg, R. (2015). Impact analysis of require-
ment metrics in software development en-vironment.
In International Conference on Electrical, Computer
and Communication Technologies (ICECCT), pages
1–6. IEEE Computer Society.
Hassine, J., Rilling, J., Hewitt, J., and Dssouli, R. (2005).
Change impact analysis for requirement evolution us-
ing use case maps. In International Workshop on Prin-
ciples of Software Evolution (IWPSE’05), pages 81–
90. IEEE Computer Society.
Heayyoung, J., Omori, T., and Ohnishi, A. (2018). Ripple
effect analysis method of dfd in modifying data flow
requirements. In Joint Conference on Knowledge-
based Software Engineering (JCKBSE2018), pages 1–
11. Springer.
iEdit Version 2.40 (2018).
http://kondoumh.com/software/iedit.html. [On-
line; accessed 20-Feb.-2019].
Mokamme, F., Coatanea, E., Bakhouya, M., Christophe,
F., and Nonsiri, S. (2013). Impact analysis of graph-
based requirements models using pagerank algorithm.
In International Systems Conference (SysCon), pages
731–736. IEEE Computer Society.
Saito, S., Hoshino, T., Takeuchi, M., Hiraoka, M., Kitani,
T., and Aoyama, M. (2012). Empirical analysis of
the impact of requirements traceability quality to the
productivity of enterprise applications development.
In 19th Asia-Pacific Software Engineering Conference
(APSEC2012), pages 330–333. IEEE Computer Soci-
ety.
Stevens, W., Myers, G., and Constantine, L. (1974). Struc-
tured design. IBM Systems Journal, 13(2):115–139.
Suma, V., Shubhamangala, B. R., and Rao, L. M. (2012).
Impact analysis of volatility and security on require-
ment defects during software development process.
In International Conference on Software Engineering
and Mobile Application Modelling and Development
(ICSEMA 2012), pages 1–5.
Yau, S., Collofello, J., and MacGregor, T. (1978). Ripple
effect analysis of software maintenance. In Interna-
tional Computer Software and Applications Confer-
ence (COMPSAC’78), pages 60–65. IEEE Computer
Society.
Yu-Qing, Y., Shi-Xian, L., and Xian-Ming, L. (2009).
Quantitative analysis for requirements evolution’s
ripple-effect. In International Asia Conference on In-
formatics in Control, Automation and Robotics, pages
423–427. IEEE Computer Society.
Zhao, J., Liu, J., and Feng, W. (2010). Study on the rip-
ple effects of requirement evolution based on feedfor-
ward neural network. In International Conference on
Measuring Technology and Mechatronics Automation,
pages 677–680. IEEE Computer Society.
Ripple Effect Analysis of Data Flow Requirements
269
