
An IoT Framework for Assembly Tracking and Scheduling in
Manufacturing SME
Meysam Minoufekr
a
, Anass Driate and Peter Plapper
University of Luxembourg, 6 rue Coudenhove-Kalergi, Luxembourg
Keywords: Industrial Internet of Things, IIoT, Internet of Things, IoT, Internet of Production, Assembly Tracking,
Industry 4.0, Production Management.
Abstract: A universal RFID platform is presented, which is meant to be used as a building component of IoT integrated
collaboration platform for manufacturing applications. The core element of the system is based on affordable
Raspberry Pi modules, running on an IoT operating system. The main goal of this paper is to demonstrate an
affordable IoT solution for manufacturing SME to improve productivity by measuring and adapting the
assembly processes for a given product. To track the production chain, each part in the supply chain is
equipped with an RFID tag, which will be recorded during its travel through the facility. In addition, each
worker has his own RFID tag to localize himself and record the performed activities. The workstations are
equipped with RFID scanners used to record activity and product flow through the stations. All the gathered
data is collected on a server and the real-time status of the assembly line is processed and displayed to the
dispatching agents. Upon this data analysis, the dispatchers can take actions, update the manufacturing setup
and ultimately increase productivity.
1 INTRODUCTION
The Industrial Internet of Things (IoT) is a concept in
which people are surrounded by objects that are all
interconnected using embedded technologies – smart
objects (Kortuem, 2010). In the IoT, these devices can
exchange information and process it via network,
providing a next generation of services to humanity.
The environment is packed with systems that play the
role of sensors and actuators (Gubbi, 2013). All these
devices are spatially distributed, and communication
between them may be established using a variety of
technologies (
Ebling
, 2017).
These technologies have to be integrated with
easiness of creating ad-hoc connections for seamless
development and operation of the Internet of Things
(Ray, 2018). Currently, most implementations of IoT-
like solutions are being developed for business
solutions affordable for large enterprises
(Uckelmann, 2016), but there is an emerging need for
extending it to the small and medium size enterprises
(SME), with standardized and easy- to-use solutions.
The Scope of this paper is to make use of RFID
technology to record live data of assembly lines,
a
https://orcid.org/0000-0002-5877-0820
process this data and visualize it to facilitate decision-
making, layout and scheduling optimization for the
given assembly line. This will involve tracking the
parts and workers of the facility, introducing a digital
real-time interface for workstations and visualization
of performance statistics for dispatching personnel
optimizing the assembly processes.
The structure of this paper is as follows: the first
step is to understand the challenges of manufacturing
small and medium sized enterprises (SME). The
second step is a to analyse the existing technological
boundaries and introduce the RFID tracking to
achieve an implementation strategy followed by the
actual solution, which represents the development of
the measurement and workstation unit and its
deployment on the local assembly-line or on a smaller
test assembly-line. Ultimately, the RFID-based
system within the existing assembly line and provide
new ways to visualize the assembly process, its
bottlenecks and in the end provide useful statistics
and analytics.
Minoufekr, M., Driate, A. and Plapper, P.
An IoT Framework for Assembly Tracking and Scheduling in Manufacturing SME.
DOI: 10.5220/0007921805850594
In Proceedings of the 16th International Conference on Informatics in Control, Automation and Robotics (ICINCO 2019), pages 585-594
ISBN: 978-989-758-380-3
Copyright
c
2019 by SCITEPRESS – Science and Technology Publications, Lda. All rights reserved
585
1.1 Background and State of the Art
Internet of Thing (IoT), concept of physical objects
exchanging data through the Internet, is entering
enterprise market bringing growth and profit. In order
to function properly, IoT comprises of many different
abstraction layers from tiny sensors detecting
temperature change in individual objects up to huge
server warehouses powering cloud- computing
technologies. Before data coming from millions of
‘real’ physical objects can be processed, these objects
have to be somehow mapped into virtual world. This
is done by using sensor technologies that are able to
transform physical properties into electric signals.
One of the sensors, regarded as fundamental in IoT
world is Radio Frequency Identification (RFID)
technology. The RFID technology offers the ability to
detect and distinguish individual objects from
distance.
A big advantage of RFID is that it is affordable
for any manufacturing SME by using modern RFID
systems, which are based on commonly available
technology (Bucciero, 2018). The approach presented
here, can easily be adapted to new fields of
application, such as pharma production or healthcare
(Miorandi, 2012). Manufacturing companies are
strongly moving away from a push- to a pull
manufacturing, which requires highly flexible on
demand assembly lines. Such lines feature the
challenge of stock management and just-in-time
supply management for the assembly lines. To stay
competitive, manufacturing SME must produce with
high quality standards and avoid scrap parts. The cost
of reassembling, reworking products might quickly
become higher than the cost of the product itself and
result in direct waste.
The main manufacturing tasks addressed in this
paper are manual assembly processes. The assembly
can vary strongly between applications and product to
be manufactured. In general, the worker will
manufacture the product by following a certain
amount instruction, which guide him/her through the
assembly process on the workstation. Those
instructions are printed on paper separated into
smaller steps. These steps are to be executed within a
given time frame and with a defined quality that
addresses mostly human errors. An assembly error
can result in a rework or scrap product-creating waste
of time and resources. Tracking the assembly steps
enables crosschecks at each step and increases the
chance that products are assembled correctly,
reducing rework and production time.
2 PROBLEM DEFINITION AND
SOLUTION
Before data coming from numerous ‘real’ physical
objects can be processed for assembly tracking, these
objects have to be somehow mapped into virtual
world. This can be done by using sensor technologies
that are able to transform physical properties into
electric signals. One of the sensors, regarded as
fundamental in IoT world is Radio Frequency
Identification (RFID) technology. The RFID
technology offers the ability to detect and distinguish
individual objects from distance.
Current RFID systems are usually designed to
gather data about recognized objects and to send them
right away to a computer for processing. This solution
might be enough for smaller number of RFIDs (e.g.
timing marathon and races) but will be overwhelming
for the computational unit in IoT domain with
increasing investment and maintenance costs to the
manufacturing company.
This problem can be solved by adding smaller
computing units to each RFID reader. This computing
unit would process the data on the spot and send
results only when it is desired. This paper will
concentrate on creating such a platform (computing
unit with RFID reader, later called RFID platform) by
assembling hardware parts and writing necessary
software.
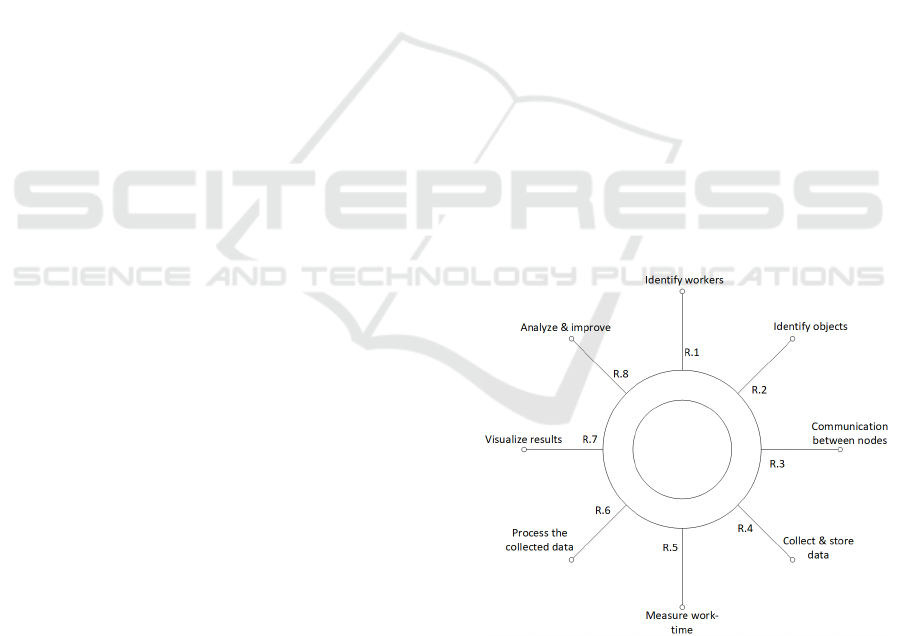
Figure 1: Requirements analysis addressing the challenges
to the system.
In this paper, we present a solution based on low
cost electronic tags that can easily be attached to
physical objects, and do not require power source –
reader in another device (Quan, 2018) initializes
them. Emerging from the determined Factors, the
ICINCO 2019 - 16th International Conference on Informatics in Control, Automation and Robotics
586

requirements to the system are formulated in Figure
1. The different requirements are explained as
follows:
Identify Workers (R.1): Each worker must be
uniquely identifiable by the system. This will assist
with building statistics over user productivity.
Knowing the real-time activity and status of each
worker is viable for tracking an assembly line. There
are a multitude of ways to identify Humans which
range from cheap and quick like a “user-password”-
combination to highly secure and customizable
solutions such as an iris-scanner. The most suitable
option for identifying workers at their workstations is
the RFID-Wristband which can be easily scanned
contactless and with no further doing from the
worker. The installation of a RFID sensor at each
workstation is at a low cost of less than 10 Euros and
directly compatible with the data-collection
technologies of choice.
Identify Objects (R.2): Identifying objects means
in this context to be able to identify parts, products,
tools and other hardware required in the
manufacturing process. These objects can differ
greatly in shape, size and portability. It is important
to therefore find reproducible and flexible ways to
recognize objects throughout the assembly line.
Recognizing objects cannot be done without further
doing. Objects are more versatile in shape
combinations than humans are. This eliminates
options such as fingerprint scanners and leaves us
mostly with option, which require the object to be
marked.
Communicate between Nodes (R.6): Different
nodes of the system need to be able to send data and
triggers over a network to be defined. The less the
latency and complexity of this network, the better the
results.
Collect and Store Data (R4): In order to
electronically process data, it first needs to be
acquired and stored in the system. This process
should be automatized and cost the least amount of
time possible. Each fluctuation in the acquiring of
timestamps will bias the dataset. The Raspberry Pi 3
device offers many possibilities, which are partly
offered by other platforms too but the small form,
factor clearly beats the other options when comparing
compatibility and functionality/size.
Measure Worktime (R.3): The time a worker
spends on a product, a task or which an object in
question is dependent on factors, which cannot
directly be known. It is vital tough to track the
assembly speed for each task and build statistics,
which enable to better understand the challenges of
each assembly line. The events registered when an
RFID-tag is swiped will determine the time-window
used for each operation. For operations, which do not
incorporate any tagged object or product, a physical
button will be introduced within the Users workspace,
which he/she can operate to signalize the start and end
of a timed event.
Process the Collected Data (R.5): The data, which
is stored in the system, needs to be processed in real-
time to be visualized for the assembly-line
supervisors in time. This is taken over by an
electronic component handling all the calculations of
the system.
Visualize Results (R.7): The computed results
finally must be transformed into human
understandable and readable output. There are
different media or transferring information to a
worker. This depends on the complexity of the data
and the capability of the worker. The latter is
influenced by how busy the worker is or how
susceptible he/she is to notice a change in
information.
Analyze and Improve (R.8): Collecting and
visualizing data does not mean the improve of the
productivity. This stage is where you turn your
measurements into insights and actions. Analyzing
the data and knowing what is wrong and the parts of
the process that need fixing, offer you the time to put
improvements in place and get them stick. This is the
best way for continuous improvement.
3 IMPLEMENTATION
This section shows how IoT can be realized to
improve production efficiency by proposing an
approach to support IoT-based assembly processes
through integrating manufacturing data. In order to
test the proposed approach and assess its impact on
improving production efficiency, a pilot study was
carried out in a discrete assembly line in our
university’s Lean Lab. Several smart devices with
sensor have been installed at assembly station level to
collect production data in real-time, and then this data
have been analyzed to see improvements of
production efficiency. The IoT solution platform
proposed in this paper, will address the challenges
An IoT Framework for Assembly Tracking and Scheduling in Manufacturing SME
587

Urgency, Complexity and Security by providing an
approach which
Can be easily introduced in existing production
line (plug-n-play), without disturbing and
interrupting the production capacities,
Is easy to use and based on standard components
and thus affordable for producing SMEs and working
with low configuration efforts, hiding technological
details from the users
Is using standardized security protocols and
assures (at least) the same safety measure to protect
user and customer data like the one given by the
company’s IT infrastructure
The lack of understanding of manual assembly
process behavior “who”, “where”, “when”, and
“how” is the essential reason of the difficulty in
evaluating and improving production efficiency. In
order to improve production efficiency, significant
attention and efforts have to be made to obtain
process data from smart devices, sensors, and other
tools (Saeid, 2017), and then integrate this data in
production management. As a result, the approach to
build a model for supporting IoT-based production
management in sustainable smart factories can be
summarised as follows:
1. Understanding assembly processes and current
manufacturing management practices
2. Monitoring and analysing manufacturing
progress in real-time using IoT technology (e.g. smart
sensors)
3. Integrate process data into factory’s tools for
improving production efficiency
4. Define sustainable strategies and practices in
production management to improve production
efficiency
The first phase involves the understanding of the
production processes, the evaluation of the current
production management practices and the definition
of key performance indicators (KPIs). The second
phase focuses on collecting (possibly) real time data
by means of IoT technology and then analysing them
to understand current practices and limitations. Here
it is required to define and model the assembly
stations to be monitored, define the monitoring
devices for each station, the communication system
and where and how the data will be stored and
analysed. Moreover, the production processes must
be identified (e.g. assembly sequence, processing
time for each product under different configurations),
so as to link and understand the process behaviour and
make the efficient decision. After collecting and
analysing the data, the third phase is to integrate this
data into production management tools to enable the
decision makers to define the waste, where
improvement can be achieved, also select the most
sustainable configuration mode of assembly setup
with considering the production planning. The fourth
phase encompasses the upper level, i.e. the definition
of strategies and practices to improve the production
efficiency of the smart factory “by design”, for
example by integrating production data in production
management practices.
The IoT platform proposed in this paper majorly
consists of four main components and is based on the
architecture proposed by Kranz (Kranz, 2017):
Sensors / Actuators: RFID Sensors collect data from
parts and workers in each assembly station and
measure useful data like process time. Actuators
intervene to change the process flow, for example by
alerting the worker at the assembly station in case of
process errors.
Edge Devices: The device systems build the control
element of the sensors and feed data for data
aggregation on the server. In our case, Raspberry PI3
are used as edge devices, which are physically
attached to the RFID sensors and logically connected
to adjacent gateway device or server for data
forwarding and processing.
Gateways: A gateway provides connectivity between
all elements in the physical world and digitalized
cloud data. In our use case application, we use a
standard Wi-Fi gateway switch.
Cloud/Server: Although edge IT processing systems
may be in remote locations, our server backend
application is in our Lean Lab facility.
The implementation is focussed on the assembly
process of a paper puncher tool. The according
assembly line is composed of seven stations: chassis
assembly – base assembly – marriage – QA &
shipping – receiving product and dismantling 1 –
dismantling 2 – material handling. Each station
consists of many individual sub-assembly tasks. The
last station (Material handling) involves motion,
storage, and delivery of materials throughout the
process.
ICINCO 2019 - 16th International Conference on Informatics in Control, Automation and Robotics
588
In the proposed IoT framework for puncher
assembly processes, the overall objective is to
complete a well-defined life cycle, which will result
in the assembly of a target paper puncher device. To
accomplish this objective, a set of distributed IoT
components and devices including cyber physical
resources and modules collaborate. A well-defined
set of functional activities are accomplished, and they
include the following:
1
Creating the assembly plan
2
Creating of the 3D assembly instructions
3
Analysis of assembly alternatives using prediction
models to assess the assembly
4
Physical assembly of target parts using IoT
These resources are linked via the Internet using
a cloud computing approach. The components of this
cyber physical framework for micro assembly are
shown in Figure 2.
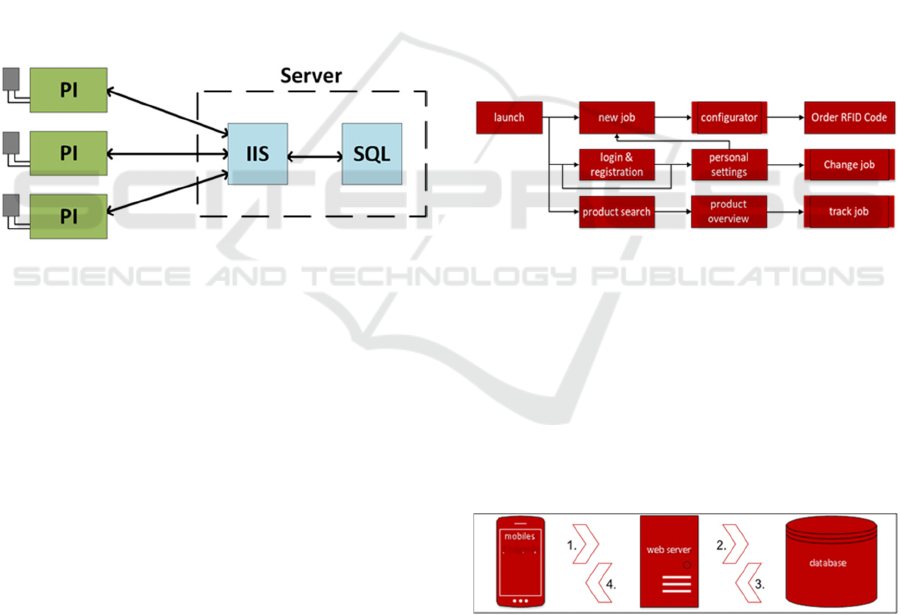
Figure 2: Overall system design and approach.
In our implementation of our IoT framework and
the associated remote collaboration protocols, a
remote client-server approach is realized that is based
on standard Windows setup as a server and Windows
IoT platform (Sabanal, 2016) Provisioned on bare
Raspberry Pi3 hardware for the assembly node
clients.
This application hosts the assembly planning and
real-time tracking (created using C#, Windows IIS)
that would be the target for remote clients interested
in the collaborative analysis in our IoT framework.
Remote users with thin clients are able to connect to
the server applications. Users from different
geographical locations are able to collaborate using
thin clients to propose assembly plans and study
assembly plans.
We will now present implementation of the
previously discussed aspects. The setup is shown in
Figure 2. Each station consists of a combination of
one IoT device (Raspberry Pi3) combined with an
RFID sensor, which is assembled on a PCB, attached
to the top part of the 3D printed frame holding the IoT
device. Each IoT device is equipped with a touch
display to interact with the worker. The
communication between the Pi and the sensor via the
SPI protocol (Spi et al., n.d.).
The basic workflow of one station is as follows:
after an initialization phase, a worker can login and
then start the execution of a task (Figure 3). The
worker moves from one-step of a task to the next,
using one of several methods, as discussed later. At
some points in the workflow, there are interactions
with the server, specifically for validation before
proceeding. The instructions are displayed to the
worker with both text and images, to facilitate the
understanding of the tasks and to ensure a smooth and
productive operation. The application was developed
according to the following structure chart, in which
all basic activities and their correlations are shown,
see Figure 3. When a RFID tag is detected at the
sensor, a request is sent to the server to identify to
which group it belongs (workers, parts, etc.). After
receiving the answer, the station sends a login
request. Finally, it proceeds when receiving a positive
answer.
Figure 3: Sequence for logging in a worker.
The main menu consists of four buttons, which
can be used to place orders, register, search for
products and navigate through the application. In the
activity “new job”, two buttons can be used to decide
for which factory the order is to be created. When the
activity is started, an RFID tag can be scanned. The
RFID code displayed on the contains the component’s
data and the according instructions, which are
displayed on the screen.
Figure 4: Structure of the application.
The second important part of the implementation
is the centralized data communication, see Figure 4.
It is the central element of the assembly network,
interacting with all involved devices, be it for the
storage, validation or retrieval of data. The secure
data communication between the app and the
database is realized by a web server regulating the
An IoT Framework for Assembly Tracking and Scheduling in Manufacturing SME
589
communication between the app and the database and
making the data available directly in a suitable form.
The production data in the production system are
stored in an SQL database in tables, which are divided
into customer data and order data. Both the database
and the web server are located on one server, running
independently. Only a single interface enables
communication between the web server and the
database.
The Database access via the web server takes place in
four steps:
1. The app sends an http request to the web server.
The http request contains the information what is
requested (order, customer, events). Furthermore, the
http request contains attributes that are necessary for
the web server to search (for example, an order
number when requesting an order).
2. The web server checks the syntax of the request.
If the syntax is correct, the web server queries the
desired data in the database using an SQL statement.
3. If there is an entry for the attribute passed (such
as the order number), the web server gets the data
back and creates an xml document. If there is no entry
for the attribute, an empty document will be created.
4. The web server responds to the http request with
the created document containing the desired
information. These are encrypted for security reasons.
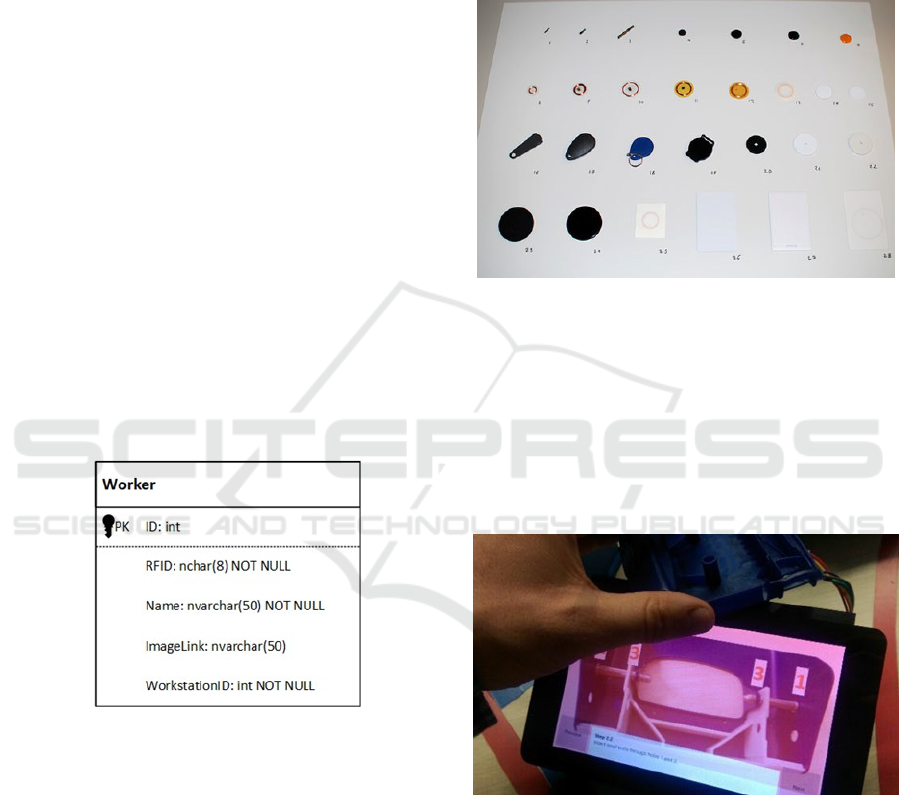
Figure 5: Database table representing a worker.
Objects are identified by RFID stickers (R2), see
Figure 6. Another aspect to be considered in this
context is the detection range of RFID tags. The latter
increases both with the size of the RFID tag and
sensor and with the power of the sensor. A trade-off
between shape, size and power has therefore to be
found, tailored to the specific situation on the shop
floor. It is therefore important that the system can be
adapted to different configurations and types of
sensors.
The components are represented using an SQL
database. The basic structure of the tables involved is
shown in Figure 5. Moreover, each performed step is
associated with an entry in the AssemblyInstance
table. The main information are the start and the end
time of the step. Furthermore, each workstation is
associated to the instructions performed on it, the
workers on that workstation and the scanned objects
(StationFlow table). The latter allows regrouping all
the steps for one specific instance of a product.
Figure 6: Tagged object and several tag alternatives.
The sequence of steps when scanning an object is
like the identification of a worker, with first the
identification of the “owner” of the tag, before
sending a request to the server. When validated, the
station shows the next step of the task. If at any point
in time there is an error, the user receives a visual
feedback, as illustrated in Figure 7. The screen flashes
green in the case of a success.
Figure 7: Visual feedback for user if scanning a part was a
success or an error.
The measurement of the time a worker spends on
a given task is measured for each step. To indicate
that a step is finished, the worker either presses a
button or scans an RFID tag. In both cases, the station
directly sends a request for the validation to the
server. When the server acknowledges the completion
of the step, the station goes on to the next step or starts
ICINCO 2019 - 16th International Conference on Informatics in Control, Automation and Robotics
590
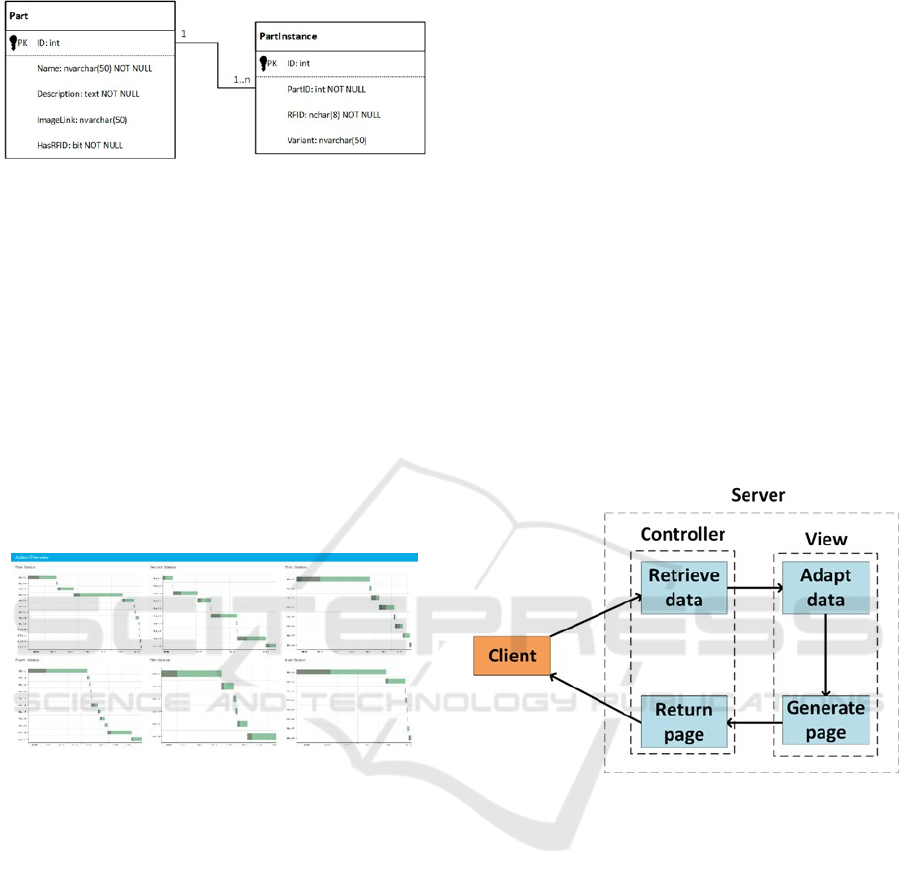
Figure 8: Database tables for saving process data.
An example of recorded data is shown in Figure
9. It is important to note that this is only the raw data
that must be processed before using it to analyze the
process performance. This basic data can be used to
obtain a lot of different information, a simple example
being the cycle time or identifying the best/worst
station.
The processing and visualization of the recorded
data is highly interlinked. Information is extracted out
of the data at the moment it is requested, in order to
always have the newest information available. The
chosen technology for displaying results is an HTML
page, as this makes it easily deployable across
different platforms and media.
Figure 9: Example process data.
When the IIS server receives a request, as
illustrated in Figure 10, a controller first extracts the
data from the database, before passing it on to a view
to setup the page. This is done via data objects that
are independent of the exact visualization of the data.
This allows for an independent development and
testing of both components as well as an easy
exchange of just one part of the program. After
receiving the data, the view then transforms the data
into the exact form it needs it to be, before generating
the whole page with the aid of the Razor technology.
Finally, the page is being returned to the client.
Currently two main pages are in use. Both display
their information per station. The first one presents
some basic statistical information about the process
performance. It includes the average cycle time, the
last cycle time, the number of products finished as
Well as an indication in which state the station is in
(e.g. operational or error). Furthermore, it displays
the stations with the minimum and maximum on the
cycle time and the number of products finished. The
second page displays the times of the different steps
for each station via a Gantt chart. It includes three
bars per step, indicating the minimum, average and
maximum duration of that step. This is a useful tool
to evaluate which steps for one specific station take
the longest, whereas the first page is more useful to
compare between stations. Both pages can be seen on
figures in the next section Discussion and Result.
As previously discussed, the connection method
between the server and the stations is done via WiFi,
which allows for a flexible rearrangement of the
stations, without needing to pay attention to the extra
effort of placing network cables. The topology of the
network is a star-based, with the server in the centre
of a “cloud” of stations. The client displaying the
information pages can be any device with a browser.
It is important though that the display attached to it is
big enough for proper of rendering of the information.
Figure 10: Structure of a request to display live data.
4 RESULTS AND DISCUSSION
The “Lean Assembly Lab” at the University of
Luxembourg is a testbed to practice concepts of Lean
manufacturing and basic concepts of Kaizen. Both
concepts are state-of-the-art methods in industrial
application to help increase efficiency in production.
In this section, we present some results, which shows
the advantages, in terms of efficiency, productivity
and scalability, of using the proposed IOT platform.
Two experiments have been carried out at the lean
assembly lab. Both tests have been performed in the
same environment: process of hole punching tool, six
stations, one worker per station, same process layout,
and same product (Table 1).
Those experiments are aimed to distinguish
between effects resulting from the paper-based
An IoT Framework for Assembly Tracking and Scheduling in Manufacturing SME
591
assembly process and those resulting from a more
comprehensive, systemically transformation by
digitalization of an Assembly process.
The key question we investigate in this section is:
“Given a lean process, what is the impact of applying
the described IoT framework to that process
regarding process improvement?”
The Layout design is an important component of
an assembly line and other operations, both in terms
of maximizing the effectiveness of the production
process and meeting the needs of employees. The
basic objective of layout is to ensure a smooth flow
of work, material, and information through a system.
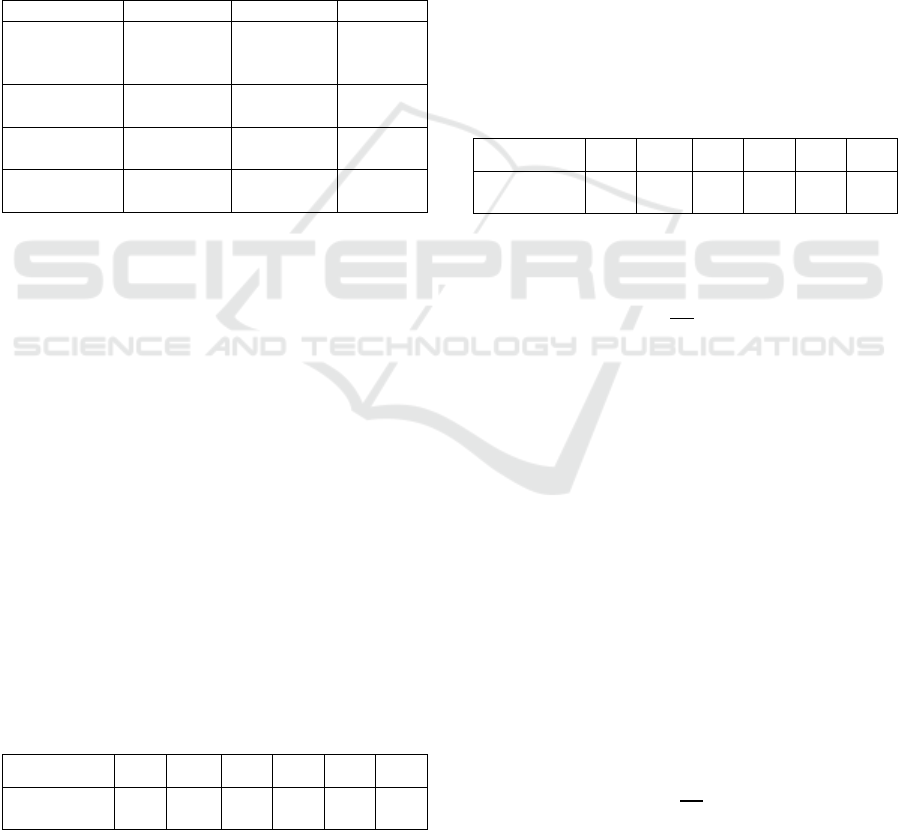
Table 1: Conditions of the experiments.
Condition Value Units Symbol
Net time
available to
work
60 min
T
Customer
demand
20 units D
Number of
worker / station
1 NA NA
Number of
stations
6 NA NA
One worker is required on each station to
complete the job and minimum two auxiliary workers
are needed to support the production while supplying
the raw material and retrieving the finished products.
A manager controls the whole assembly production
according to the order and priority of product. On
each station, there is a small buffer to continue the
stream production and to overcome the bottleneck
and starving condition for the successive one.
a) Collected Data of Paper-based Assembly Process
The initial assembly process is based on paper
instruction. Different paper-based work instructions
are provided to each station. Assembly is followed by
the instructions mentioned on the paper. The papers
explain some critical steps as well. The data was
manually collected in this case, using chronometer.
The workers record the start as well as the end as
precise as possible (Table 2).
Table 2: The manual collected data
S.1 S.2 S.3 S.4 S.5 S.6
Station
Time(s/unit)
159 451 263 243 197 224
b) Collected Data of Assembly Process using IoT
Framework
After having the results of paper instructions, new
modifications are introduced on the lean assembly
line. Instructions are followed by using the IoT
Framework. All these disparate parts of the assembly
are connected via the IoT Framework including RFID
sensors. In the digitized assembly line product, flow
and layout are the same as in paper-based process.
The only parameters changed are the use of RFID
tags, display screens and paperless instructions. An
RFID system is linked with every station, which is
connected to main server and saves the progress of
the assembly. The software records the deviations and
processes the data by showing different process
parameters i.e. cycle time and lead-time. On every
station the RFID tag of a part can be read. After
successfully detecting the tag, the instructions are
displayed on a screen explaining the assembly
necessary steps. At the same time, the station records
the relevant process parameters (Table 3).
Table 3: The collected data of IOT-based process.
S.1 S.2 S.3 S.4 S.5 S.6
Station
Time(s/unit)
159 451 263 243 197 224
Takt Time: the rate at which you need to complete a
product in order to meet customer demand.
(1)
3
Cycle Time: The maximum station time of an
assembly process.
max
,
∈ 1…6
(2)
Cycle time for paper-based instruction is higher
than the digitalized instruction, which is mainly
caused by the work needed at station 2. Station 2
creates a bottleneck in the whole process, which leads
to high flow time and causes line balancing. Figure
11 shows the irregularity of both methods. The paper-
based method has higher irregularity than the
digitalized one. In addition, in the digitalized method,
quality checking is a pacemaker step. Pacemaker
steps create a pull flow in the whole process, which
results in less inventory and less bottlenecks.
Throughput rate: it measures the movements of
outputs within the production process.
(3)
Is the net available production time and is
cycle time as explained in Equation (2).
ICINCO 2019 - 16th International Conference on Informatics in Control, Automation and Robotics
592
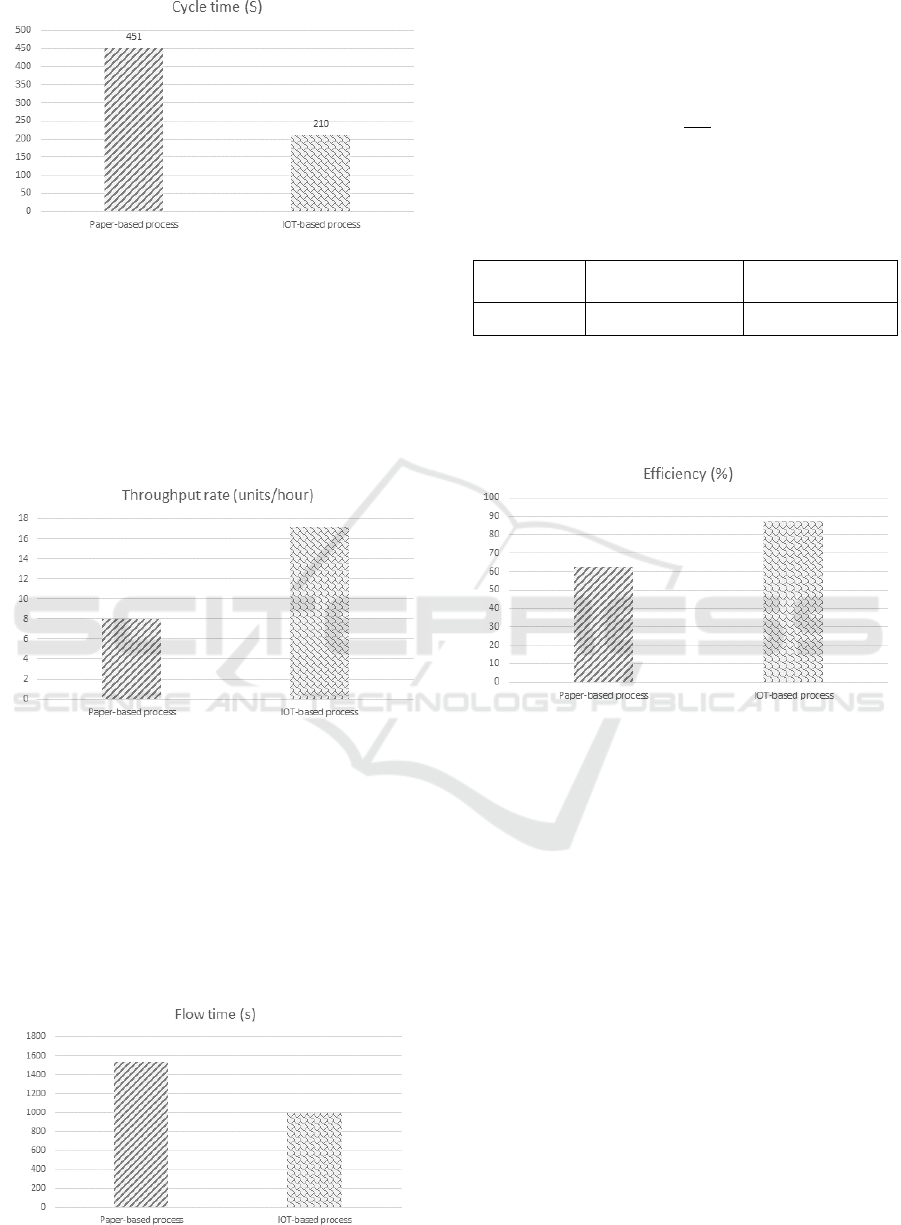
Figure 11: Cycle time comparison.
Eight products were assembled in one hour, but
only five products were useful, three products
defected in the case of paper-based process. On the
other hand, seventeen products were assembled and
only two of them defected. Throughput rate for
digitalized instruction is high because of less cycle
time and less bottleneck. The digitalized process has
a pacemaker with less disorder, see Figure 12.
Figure 12: Throughput rate comparison.
Flow time = total time a unit spends inside a system.
(4)
Flow time (Figure 13) also depends on the
bottleneck step. Due to bottleneck process in paper-
based method, the overall flow time is quite big.
Higher flow time results into the less production.
Figure 13: Flow time comparison.
Efficiency is very often confused with
effectiveness. Efficiency determined by the ratio of
useful output to total output. Effectiveness is being
able to achieve a desired customer demands.
(5)
Tw: useful total working time, Ta: net available work
time
Table 4: Efficiency comparison.
Paper-based process
IOT platform based
process
Efficiency (%) 62.63 87.5
In total, our experiment showed for that for
theconcrete application, the digitalized instructions
were more efficient than paper-based instructions, see
Figure 14.
Figure 14: Efficiency comparison.
Defected Parts: During the whole process, three
defected parts were observed in paper-based
instruction. Whereas in digitalized based method only
two parts were defected. More defected partsresult in
the unclarity of the process steps in the paper-based
instructions. Defected Products If defective articles
are not discovered in an early stage it can create
valueless work and quality shortages on products that
lead to increased cost. If the defected articles are
found before, transferring them to assembly line it
will minimize the valueless work. This can be
received by implement earlier quality controls.
5 CONCLUSIONS
Considering how industries instruct inexperienced
operators today regarding manual assembly tasks, it
is often expensive, time consuming and involve many
personnel. Especially when toady’s products become
more complex and customized, the need of operators
An IoT Framework for Assembly Tracking and Scheduling in Manufacturing SME
593

learning new manual assembly tasks increases when
having more product variants in production. If they
utilize instructions, which do not involve humans,
they often use improperly designed paper instructions
consisting mostly out of text, which is not the most
appropriate way of designing assembly instructions
considering human cognitive processes. Instructions
could be designed by using many different
technologies, but it is about how you design the
instruction that is of most importance. To fully reach
the most benefits, instructions should be effectively
designed, considering both planning and presentation
of instructions. The technology for designing
instructions should be digital, using screens or smart
tablets, to fully utilize the benefits of digitalization.
Regarding instruction performance, assembly
time and achieved product quality, of the two
instruction types (paper & digitalized), it can be
concluded that differences between the instructions
are small. The digital instruction seem to have better
performance than the other regarding both assembly
time and product quality based on our experiments.
The most impressive result of the digital instruction
was its low variation in both performance parameters,
which is reliable and consistent.
Connected to the results from the objective
quantitative measurements from the case study, with
a trend of slightly more positive results towards the
digitalized instruction regarding understanding the
instruction technology and usability during assembly.
It is therefore recommended, based on our
experiments that industries use a properly designed
digitalized instruction on a screen for inexperienced
operators, since it guides the operator how to
accurately place the hands and the technology is
familiar, easy to understand and use. Looking at the
future of manual assembly, technology within
digitalized field will be developed at a rapid pace and
will therefore be interesting to follow within the
upcoming years. Switching instruction technology
into more digital solutions is not a large investment
for companies in general, though it may have a large
impact on future business and it constitute an
opportunity for industry to reach higher
competitiveness globally and become a leader within
the digitalization field.
ACKNOWLEDGMENT
The authors would like to thank the INTERREG V A
de la Grande Région for the support of the depicted
research within the PRODPILOT project.
REFERENCES
Partha Pratim Ray. 2018. A survey on Internet of
Things architectures.
Journal of King Saud
University - Computer and Information Sciences
30, 3, 291-319.
Mohsen Darianian and Martin Peter Michael. 2008.
Smart Home MobileRFID-BasedInternet-of-Things
Systems and Services. In
2008 International Conference
on Advanced Computer Theory and Engineering
.
IEEE, 116–120.
Mohammad Saeid, Mohammadreza Rezvanab 2018.
Machine learning for internet of things data analysis:
a survey.
Digital Communications and Networks
4, 3
(2018), 161–175.
Jayavardhana Gubbi, Rajkumar Buyya, Slaven Marusic,
and Marimuthu Palaniswami. 2013. Internet of Things
(IoT): A vision, architectural elements, and
futuredirections.
Future Generation Computer
Systems
29, 7 (2013), 1645–1660.
Alberto Bucciero, Anna Lisa Guido 2018. Impact of RFID
and EPCglobal on Critical Processes of the Pharma
Supply Chain. Applications and Simulations, InTech,
Croatia
.
Xiaolin Jia, Quanyuan Feng, Taihua Fan, and Quanshui
Lei. 2012. RFID technology and its applications in
Internet of Things (IoT). In
2012 2nd International
Conferenceon Consumer Electronics,
Communications and Networks (CECNet)
. IEEE,
1282–1285.
Hermann Kopetz. 2011. Internet of Things. Springer US,
307–323.
Gerd Kortuem, Fahim Kawsar, Vasughi Sundramoorthy,
and Daniel Fitton. 2010. Smart objects as building
blocks for the Internet of things.
IEEE Internet
Computing
14, 1 (1 2010), 44–51.
Friedemann Mattern and Christian Floerkemeier. 2010.
From the Internet of Computers to the Internet of
Things. Springer Berlin Heidelberg, 242–259.
Daniele Miorandi, Sabrina Sicari, Francesco De Pellegrini,
and Imrich Chlamtac. 2012. Internet of things: Vision,
applications and research challenges. Ad Hoc Networks
10, 7 (2012), 1497–1516.
Maria R. Ebling, Roy Want 2017. Pervasive Computing
Revisited.
IEEE Pervasive Computing
, vol. 16, IEEE
Computer Society, pp 17-19.
Paul Sabanal. 2016. Thingbots: The future of botnets in
theinternet of things. RSA Conference.
Quan Z. Sheng, Xue Li, and Sherali Zeadally. 2018.
Device-Free Human Localization and Tracking with
UHF Passive RFID Tags.
Journal of Network and
Computer Applications,
Elsevier, Vol 104, pp 78-96,
Dieter Uckelmann 2016, RF-based Locating of Mobile
Objects. In: Proceedings of the 6th
International
Conference on the Internet of Things (IoT'16)
. New
York, NY, USA, ACM DL Digital Library, pp 147–
154.
Michael Kranz 2017, Building the Internet of Things,
Hoboken, New Jersey, John Wiley & Sons Inc, 2017
ICINCO 2019 - 16th International Conference on Informatics in Control, Automation and Robotics
594
