
Detection of e-Commerce Anomalies using LSTM-recurrent Neural
Networks
Merih Bozbura
1
, Hunkar C. Tunc
2
, Miray Endican Kusak
1
and C. Okan Sakar
3 a
1
Inveon Digital Commerce Solutions Limited, Istanbul, Turkey
2
Department of Computer and Information Science, University of Konstanz, Konstanz, Germany
3
Department of Computer Engineering, Bahcesehir University, Istanbul, Turkey
Keywords:
Anomaly Detection, Online Retail Sector, Key Performance Indicators, Time-series Prediction, Deep
Learning.
Abstract:
As the e-commerce sales grow in global retail sector year by year, detecting anomalies that occur in the most
important key performance indicators (KPI) in real-time has become a critical requirement for e-commerce
companies. Such anomalies that may arise from software updates, server failures, or incorrect price entries
cause substantial revenue loss in the meantime until they are detected with their root-causes. In this paper, we
present a comparative analysis of various anomaly detection methods in detecting e-commerce anomalies. For
this purpose, we first present the univariate analysis of six commonly used anomaly detection methods on two
important KPIs of an e-commerce website. The highest F1 Scores and recall values on the test sets of both
KPIs are obtained using Long-Short Term Memory (LSTM) network, showing that LSTM fits better to the
dynamics of e-commerce KPIs than time-series based prediction methods. Then, in addition to the univariate
analysis of the methods, we feed the campaign information into LSTM network considering that campaigns
have significant effects on the values of KPIs in e-commerce domain and this information can be helpful to
prevent false positives that may occur in the campaign periods. The results also show that constructing a
multivariate LSTM by feeding the campaign information as an additional input improves the adaptability of
the model to sudden changes occurring in campaign periods.
1 INTRODUCTION
Companies are more eager to point out and follow-up
KPIs (Key Performance Indicators) with rapid growth
on e-commerce business. Each performance met-
ric in e-commerce business directly or indirectly af-
fects the KPIs. Some of them which are directly re-
lated to KPIs like revenue and conversion rate are
price changes, product campaigns/discounts, ship-
ment costs, digital marketing budget, marketing chan-
nels, target segment and so on. Companies can iden-
tify anomalies in a timely manner by closely mon-
itoring the KPIs. Anomaly detection can lead ac-
count managers to notice problematic events like poor
mobile application performance caused by an up-
date or failure in online payment system in the e-
commerce domain and therefore potential issues can
be avoided.(Laudon and Traver, 2016) In return, they
can make necessary mitigation plans, prevent their
a
https://orcid.org/0000000306394867
major revenue losses, and optimize their marketing
budget and tools (Ramakrishnan et al., 2019; Chan-
dola, 2009; Ahmad et al., 2017).
In this study, we present a comparative analysis of
various anomaly detection methods on main KPIs of a
e-commerce website, which are revenue and conver-
sion rate. For this purpose, we apply six commonly
used anomaly detection methods on two-year revenue
and conversion rate data and present the comparative
results using various evaluation metrics. Besides, we
feed the product campaign and shopping cart discount
rate information into the model considering that the
campaigns have significant effects on the values of
KPIs in e-commerce domain. Thus, we aim to prevent
false positive alarms that may occur in the campaign
periods. Although various anomaly detection systems
have been implemented in the e-commerce domain
for different tasks, this study represents a different
aspect that performs anomaly detection by feeding
product campaigns and shopping cart discounts rates.
One of the recent previous works that applied
Bozbura, M., Tunc, H., Kusak, M. and Sakar, C.
Detection of e-Commerce Anomalies using LSTM-recurrent Neural Networks.
DOI: 10.5220/0007924502170224
In Proceedings of the 8th International Conference on Data Science, Technology and Applications (DATA 2019), pages 217-224
ISBN: 978-989-758-377-3
Copyright
c
2019 by SCITEPRESS – Science and Technology Publications, Lda. All rights reserved
217

an anomaly detection approach on e-commerce data
aimed at finding the incorrect data on Walmart online
pricing algorithms (Ramakrishnan et al., 2019). In-
correct price calculations due to data errors can cause
legal problems with suppliers and financial losses.
They used a combination of supervised and unsuper-
vised model to detect price anomalies. In another
study (Yelundur et al., 2018), an anomaly detection
approach was proposed to find the fake product re-
views in an e-commerce website. Counterfeit com-
ments and ratings about products are important prob-
lems that an e-commerce company have to deal with.
Sellers take advantage of reviewers to write fake re-
views on the products for obtaining superiority in the
market. They used Bayesian semi-supervised tensor
decomposition method to find anomalous behaviors
in reviews. In another study (Yang et al., 2011), lin-
ear discriminant analysis is used to detect anomalies
on web transaction data. Besides, several anomaly
detection systems have been carried out for fraud de-
tection in e-commerce context (Massa and Valverde,
2014; Raghava-raju, 2017).
The anomalies can be categorized under three cat-
egories, which are point, contextual and collective
(Chandola, 2009). When a single data point behaves
abnormally from the general pattern of the data, it is
called a point anomaly (Chandola, 2009). For ex-
ample, a sudden and sharp decrease in the number
of purchases compared to the normal range of pur-
chases may represent a point anomaly. A data point
is regarded as a contextual anomaly if it is anomalous
in a certain context (Chandola, 2009; Bhuyan et al.,
2014). Collective anomaly is referred to a group of
data points when they have an abnormal behavior as
a group in contrast to the rest of the data (Goldstein
and Uchida, 2016). The data points in the region of
the collective anomaly may not be anomalous indi-
vidually, however, their occurrence as a group may
be anomalous (Goldstein and Uchida, 2016). Point
anomalies are prioritized in this study since sharp
and sudden changes on data are very important for
e-commerce software platform provider to meet SLA
(Service Level Agreements) (Malik and Shakshuki,
2017; Hiles et al., 2016) with brands.
In this paper, several prediction-based anomaly
detection algorithms are applied on a real e-commerce
dataset including the values of two main KPIs. Firstly,
the algorithms are implemented without campaign
information and the results of these initial experi-
ments are presented with various evaluation metrics.
The obtained results showed that stateful Long-Short
Term Memory (LSTM) network fits better to the dy-
namics of e-commerce KPIs than the other time-series
based prediction methods used in this study. Then, we
feed the campaign information into the LSTM net-
work considering that giving the campaign informa-
tion as input to the prediction model can improve its
ability in predicting the sudden increases caused by
the campaigns launched on the e-commerce website.
The campaign information is represented with prod-
uct campaign and shopping cart discount variables.
The results obtained with multivariate LSTM are an-
alyzed in order to see the effect of campaign infor-
mation on the confidence interval level and anomaly
score. With these variables, it was observed that
LSTM produces better predictions in the campaign
periods and thus shows a better anomaly detection
performance on both of the KPIs used in this study.
The rest of this paper is organized as follows.
Section 2 includes the description of the dataset, the
methods used throughout the study, and the diagram
of the proposed anomaly detection system. Section 3
presents the experimental results. Finally, the paper is
concluded in Section 4.
2 MATERIALS AND METHODS
2.1 Dataset Description
In this study, the anomaly detection methods are ap-
plied to the de-identified values of two important
KPIs, revenue and conversion rate, of an online retail
company. While revenue represents the total sale in-
come of the transaction, conversion rate stands for the
average number of transactions in a session. The two-
year data belonging to 2016 and 2017 are obtained
from Google Analytics which is a web analytic ser-
vice that allows to manage and report website traffic
(Evangelist et al., 2012). The data in this service are
kept in session-based format. When a session takes
place, a record that may contain multiple page views,
events, and e-commerce transactions is created.
Table 1: Campaign Information.
Campaign Campaign Type Discount Rate
Mother’s Day Shopping cart 30%
Father’s Day Shopping cart 30%
Longest Day Product 30%
Black Friday Product 15%
Longest Night Product 30%
One of the most important latent factors whose
absence in a prediction model may cause false posi-
tive alarms in the e-commerce anomaly detection plat-
forms is the campaign information. In this study,
two kinds of campaign information, product cam-
paign and shopping cart discount rate, are fed as ad-
DATA 2019 - 8th International Conference on Data Science, Technology and Applications
218

ditional variables to the anomaly detection algorithm.
The reason of giving campaign information as a ratio
instead of true or false, is the campaign rate has an
important effect on the revenue and conversion rate
KPIs. When the campaign rates change, the predic-
tions and so the upper/lower levels of the confidence
interval will also change, which will directly affect
the anomalies produced by the system.
2.2 Preprocessing
The dataset consists of the finalized transactions per-
formed by the users in different times. Therefore, we
applied an aggregation process in order to convert the
KPI values into time-series signals. After analyzing
the signals in different time-intervals and consider-
ing the dynamics of e-commerce, we have determined
three-hour as the optimal time interval for aggregation
process and calculated the summation of the revenue
and average of the conversion rate data points of ev-
ery three hours. The missing data was determined and
completed with zero. Each dataset was standardized
to have a mean of zero and a standard deviation of
one.
2.3 Anomaly Detection Methods
There are wide range of anomaly detection tech-
niques that can be applied to detect unusual patterns
in a time-series signals. These methods can be cate-
gorized as statistical and learning-based approaches.
In this study, we use both statistical and learning-
based models and present the comparative analyses
of the obtained results. The methods used in this
study, which are Moving Average, Autoregressive In-
tegrated Moving Average (ARIMA), Kalman filter,
Time Series Decomposition, Holt-Winters, Markov
Switching Model, and LSTM-Recurrent Neural Net-
works, are briefly described here.
The moving average method, which is based on
the use of the mean and standard-deviation of a spe-
cific time-window to calculate the confidence inter-
val, is a very commonly used technique for anomaly
detection in time-series signals (Siwoon Son et al.,
2017). In this approach, the main assumption is that
the value of the signal at time t + 1 will be close to
the values of the records in that window. The mov-
ing average of the previous data points is considered
to be the expected value for the present data point.
The moving average method can be applied in two
different ways. While exponential moving average
assigns more weight to recent data in the related time-
window, simple moving average gives equal weight to
all data points. We used simple moving average in our
experiments.
ARIMA is another statistical-based commonly
used model for time series forecasting and data anal-
ysis. ARIMA models incorporate auto-regression
(AR), Moving Average (MA), and integration (I) pro-
cesses and aim to make the time-series stationary us-
ing these mechanisms (Hyndman and Athanasopou-
los, 2018). For anomaly detection, the expected value
for time t + 1 is calculated with ARIMA and a con-
fidence interval is calculated based on the expected
value. An anomaly alarm is produced if the observed
value is outside the confidence interval.
The Kalman filter method uses a series of previ-
ous observations to estimate a probability distribution
and predicts the future values accordingly (Knorn and
Leith, 2008). This approach is commonly used to re-
move the noise in a signal and provide a smoother rep-
resentation. Removal of the noise with Kalman filter
can be considered as a pre-processing step in anomaly
detection process.
The Holt-Winters model, also called as triple ex-
ponential smoothing, is used to build estimation mod-
els for a seasonal time-series. For this purpose, it
divides the time series into three smoothing com-
ponents which are trend, season, and level (Hynd-
man and Athanasopoulos, 2018). The forecast equa-
tion is represented in terms these smoothing equa-
tions. Time series decomposition models, which di-
vide the time-series into seasonality, trend, and resid-
ual components, are also used to deal with season-
ality and trend. The seasonality and trends are re-
moved from the signal and the anomaly detection is
performed over the remaining signal. In this study,
Twitter’s model, which is referred to as Seasonal Hy-
brid ESD (S-H-ESD), is used for time series decom-
position (Hochenbaum et al., 2017).
A recurrent neural network (RNN) is a special
type of neural network architecture that is specifically
designed to process sequential data (Hochreiter and
Urgen Schmidhuber, 1997; Singh, 2017). In addi-
tion to the feedforward connections of a traditional
multilayer perceptron, the units in the hidden layers
of an RNN have self-connections and connections to
units in the previous layers. LSTM-RNN is a spe-
cial variant of RNNs which has been proposed to ad-
dress vanishing gradient problem that occurs when
backpropagating errors across many time steps (Ruiz
et al., 1994). There are two variations of LSTM-RNN
that can be used according to the relations between
batches in a sequence. While stateless LSTM-RNN
initiates the hidden and cell states after each batch,
stateful LSTM-RNN uses the hidden states and cell
states of the previous batch to initiate the states of the
next batch. We use both stateful and stateless imple-
Detection of e-Commerce Anomalies using LSTM-recurrent Neural Networks
219

mentations of LSTM-RNN in our experiments.
We also utilize Markov Switching models (MSM),
which is known as the regime switching models, in
our experiments. MSM includes multiple equations
to characterize the time series behaviors in different
regimes (Chevallier et al., 2014). In this study, the
output of MSM is given as an input to LSTM-RNN
and a multi-variate LSTM-RNN model is constructed
for anomaly detection.
The methods that have been briefly described
above are used to forecast the expected value of the
time-series at t + 1, and then a confidence interval is
calculated based on the expected value. The observed
value at time t + 1 is considered to be an anomaly if it
exceeds the lower or the upper level of the confidence
interval. The confidence interval is calculated with
Con f idence Interval = p ±(z x (
σ
√
n
)) (1)
where p is the prediction produced by the algorithm,
z is a value that is determined according to the desired
level of confidence, σ is the standard deviation of the
actual values, and n is the window size.
2.4 Anomaly Scoring
Any observed value outside of the confidence interval
is an anomaly; however, not all anomalies are equal
from the business point of view. A company may pre-
fer to define different sensitivity levels for anomalies
detected in different KPIs. The threshold can be de-
creased to increase the sensitivity of the anomaly de-
tection system for some critical KPIs. On the other
hand, a higher threshold can be determined to prevent
high false positive rates.Therefore, when an anomaly
is detected, we propose to assign an anomaly score
of 0-100 to the related data point with the anomaly
scoring method expressed by
Anomaly Score =
|x −c|
|(a x c) −c)|x 100
(2)
where x is the data point, c is the boundary value
of the confidence interval, and a refers to the hyper-
parameter with which the sensitivity to the level of
deviation is controlled. Anomaly scoring system pro-
vides direction of anomalies which are up and down
anomaly scores. The reason for two kind of score
is that the decrease in revenue and conversion rate is
more important than the increase since any kind of de-
crease in these KPIs indicates a revenue loss. There-
fore, in our experiments, for the upper level of the
confidence interval the value of hyper-parameter a is
determined as 4, whereas a smaller value, 2, for the
lower level is determined to increase the sensitivity of
the model.
2.5 Performance Measures
The anomaly detection algorithms used in this study
have many hyper-parameters to be optimized to con-
struct a reliable model. This process brings the need
of using a labeled dataset. To optimize the algo-
rithms and also evaluate their performances, the data
points are labeled as non-anomalous and anomalous
points. Recall, precision and F1 Score performance
metrics, which are the most commonly used measures
in anomaly detection studies, are calculated in our
experiments. The formulations of these performance
metrics are given below:
Recall =
True Positives
True Positives + False Negatives
(3)
Precision =
True Positives
True Positives + False Positives
(4)
F1 Score =
2 x Recall x Precision
Recall + Precision
(5)
2.6 Proposed Anomaly Detection
System
The system diagram of the proposed anomaly de-
tection system is given in Figure 1. The opera-
tions described above are performed in five layers.
The required data is read from the dataset layer and
pre-proecessing operations including aggregation and
standardization are applied on the KPI values. The
processed values in the pre-determined window size
are fed to anomaly detection layer, in which the pre-
diction algorithm is used to estimate the value of
KPI at time t + 1. We should note that many pre-
diction algorithms are applied on the related KPIs as
described in Section 2.3 and the best-performing al-
gorithm, LSTM-RNN, on both KPIs is shown in the
system diagram. Then, the estimated value is used
to determine the confidence interval and the observed
value at time t +1 is compared to the confidence inter-
val. If the estimated value is outside the confidence in-
terval, the required inputs are passed to anomaly scor-
ing function and an anomaly score is produced using
Equation 2. Then, the finding is written to the output
layer and the anomaly score is compared to the pre-
determined threshold value. Finally, if the anomaly
score is higher than the threshold, the related anomaly
information is displayed in the customer dashboard.
DATA 2019 - 8th International Conference on Data Science, Technology and Applications
220
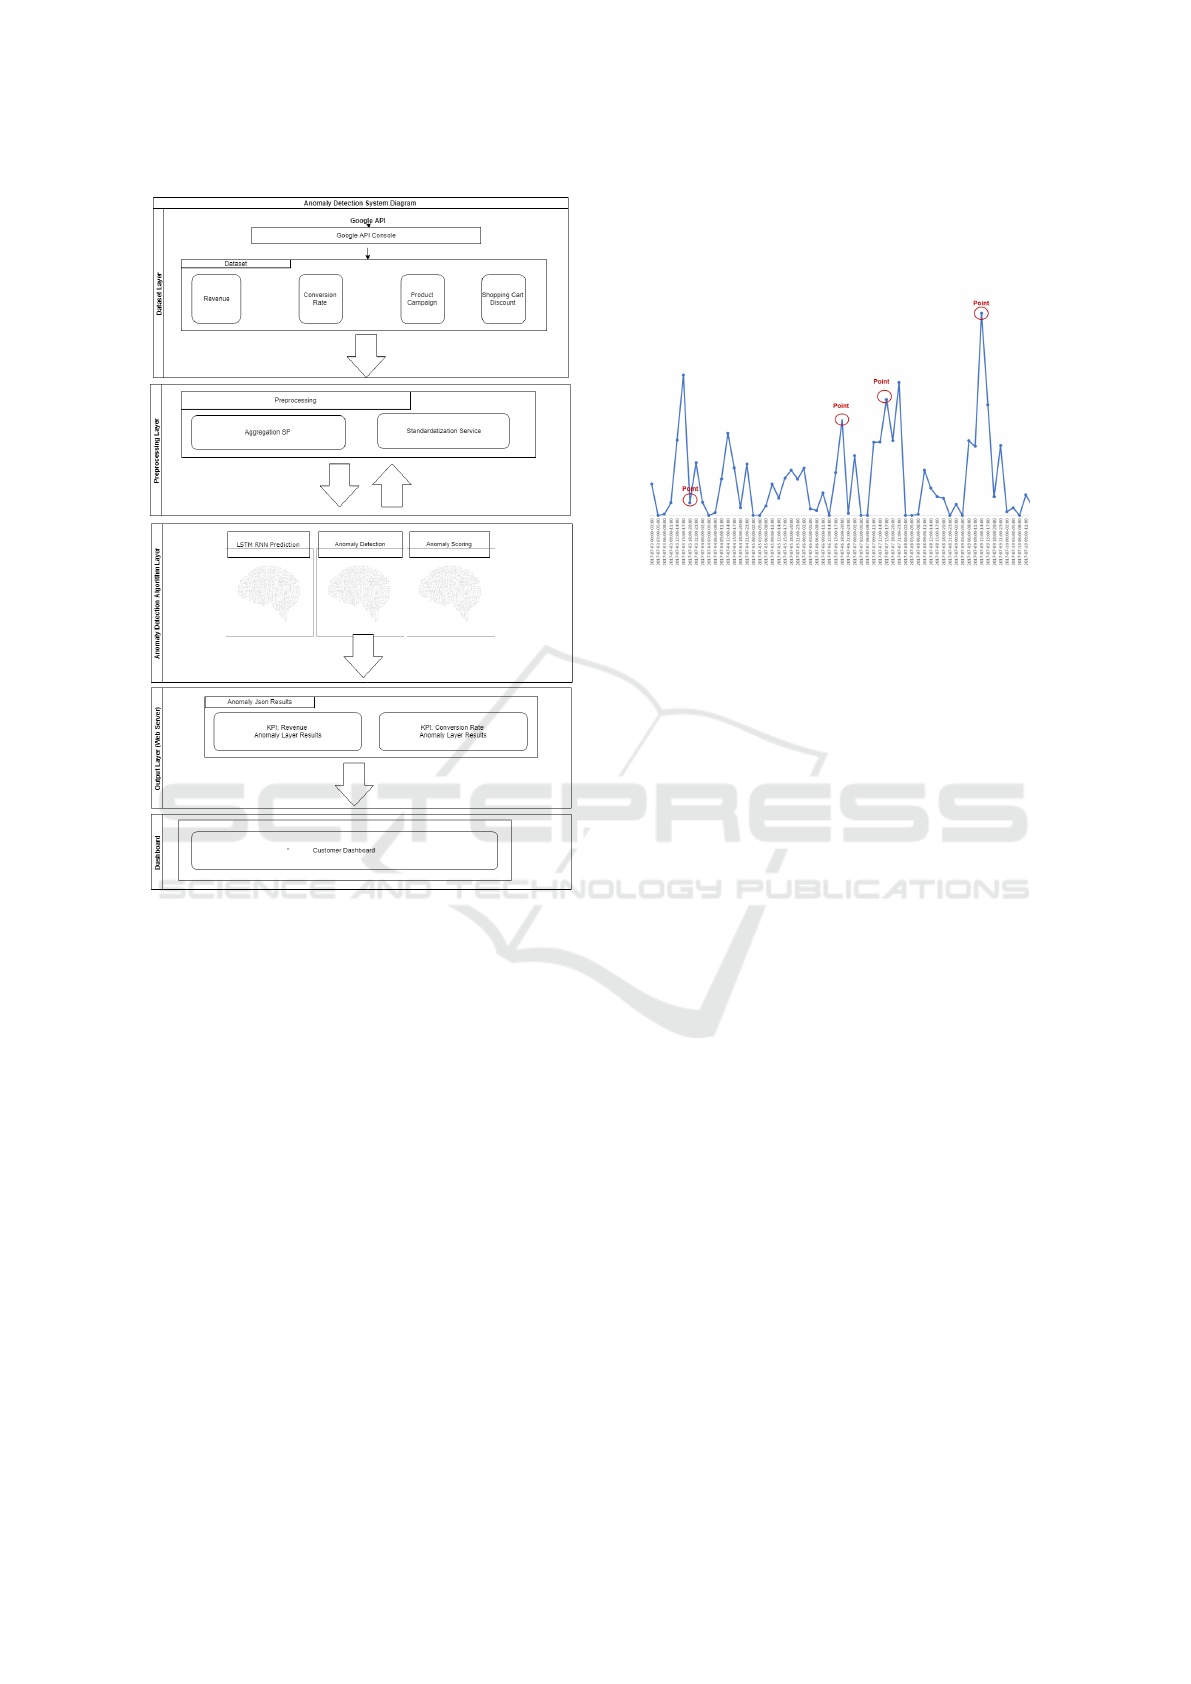
Figure 1: System diagram of the e-commerce KPI anomaly
detection system.
3 EXPERIMENTAL RESULTS
In this section, the labeling process is conducted to as-
sess and optimize the algorithms, experimental setup
including the time-series cross-validation procedure,
and the experimental results are presented.
3.1 Labeling Process
As mentioned in Section 2.5, a labeled dataset is re-
quired to evaluate and compare the anomaly detection
algorithms. Labeling all data points in a time-series
requires significant domain knowledge and is a very
time-consuming process. As it is seen in the Figure 2,
each data point for both KPIs is examined by four ex-
perts. The anomalous points that have been detected
by each of the experts have been analyzed by the other
experts and full-consensus on the anomalous points
has been reached. However, we are aware that some
anomalous points may have been missed out during
this labeling process. Therefore, we have evaluated
the results using both F1 Score and recall evaluation
metrics as detailed in Section 3.2.
Figure 2: Labeling process.
3.2 Experimental Setup
The first 18 months of two-year data of both KPIs are
used as training data and the remaining six months
were used for testing. Several window sizes and
hyper-parameter values are tried for all models. Com-
binations of 5 x e
−1
and e
−1
for Covariance (Q) and
Environmental (R) uncertainty parameters are applied
on Kalman Filter models. When building stateless
and stateful-LSTM models, a network of 2 hidden
layers and 50 neurons per-layer are found to be the
optimal architecture.
The time-series decomposition method used in
this study requires the maximum number of anoma-
lies that the algorithm will detect as a percentage of
the data as an input. In our experiments, 5%, 10%,
and 20% are tried to find the optimum value of this
hyper-parameter. Due to the nature of e-commerce
data, there may be multiple regimes in the time-series
signals analyzed in this study. Considering that the
regime switching information can improve the learn-
ing ability of LSTM, the output of MSM is given to
LSTM algorithm as input and a multivariate LSTM
is trained. The optimal value of the number of the
regimes is found to be 2.
3.3 Results on Initial Experiments
Initial experiments are conducted to optimize the al-
gorithms and compare their anomaly detection per-
formances without the campaign information on the
e-commerce KPIs. Moving Average, Autoregressive
Integrated Moving Average (ARIMA), Kalman Filter,
Time Series Decomposition, Holt-Winters, hybrid al-
gorithm combining Markov Switching Model (MSM)
Detection of e-Commerce Anomalies using LSTM-recurrent Neural Networks
221

Table 2: Best results of the initial experiments for revenue.
Window Size Model Precision Recall F1 Score TP FN FP TN
350 ARIMA 0.31 0.10 0.15 16 148 35 1270
150 Holt Winters 0.91 0.24 0.38 39 125 4 1301
250 Kalman Filter 0.66 0.35 0.46 57 107 29 1276
56 Stateful LSTM 0.73 0.49 0.58 80 84 30 1275
56 Stateless LSTM 0.68 0.43 0.53 71 93 34 1271
48 Moving Average 0.85 0.3 0.45 50 114 9 1296
8 S-H-ESD 0.67 0.47 0.55 77 87 38 1267
56 MSM + LSTM 0.59 0.38 0.46 63 101 44 1261
Table 3: Best results of the initial experiments for conversion rate.
Window Size Model Precision Recall F1 Score TP FN FP TN
350 ARIMA 0.10 0.01 0.03 2 132 18 1317
150 Holt Winters 0.84 0.16 0.26 21 113 4 1331
250 Kalman Filter 0.40 0.25 0.30 33 101 50 1285
56 Stateful LSTM 0.60 0.69 0.64 93 41 62 1273
56 Stateless LSTM 0.40 0.37 0.38 49 85 75 1260
48 Moving Average 0.91 0.30 0.45 40 94 4 1331
8 S-H-ESD 0.81 0.31 0.45 42 92 10 1325
56 MSM + LSTM 0.53 0.45 0.48 60 74 54 1281
and LSTM referred to as MSM+LSTM, stateful-
LSTM, and stateless-LSTM are applied on the labeled
datasets.
The best results together with the corresponding
optimal window size for each algorithm obtained on
the test sets for KPI revenue and conversion rate are
shown in Tables 2 and 3, respectively. As seen in
Table 2, the highest F1 Score of 0.58 is obtained
with stateful LSTM for KPI revenue. We should note
that these results are obtained on the labeled dataset
which may contain anomalous points that have been
missed out during labeling as explained in Section
3.1. Therefore, recall is also an important perfor-
mance measure that should be used to assess the per-
formance of the algorithms on this task. As seen in
Table 2, the highest recall of 0.49 is also obtained
with stateful LSTM. S-H-ESD and Stateless LSTM
give the second and third best F1 Score of 0.55 and
0.53, respectively. The results show that combin-
ing LSTM with MSM does not improve the accu-
racy of individual LSTM. Although Kalman filter,
MSM-LSTM, and Moving Average perform similarly
with F1 Scores of 0.46, 0.46, and 0.45 respectively,
it is seen that MSM-LSTM gives higher recall than
Kalman filter.
As seen in Table 3, on KPI conversion rate, the
highest F1 Scores are again obtained with LSTM net-
works. The F1 Score of stateful LSTM (0.64) is
significantly higher than that of stateless LSTM and
MSM + stateful LSTM (0.38 and 0.48). These find-
ings show that, similar to KPI revenue results, best
anomaly detection performance in terms of both F1
Score and recall measures is obtained with stateful
LSTM and giving the output of MSM as input to
LSTM has a negative effect on the performance of
individual LSTM. MSM-LSTM, after Stateful LSTM
network, provides the highest F1 Score of 0.48. The
ARIMA model has the lowest F1 score on both of the
KPIs.
3.4 Results of Mutivariate LSTM with
Campaign Information
As given in Section 3.3, the stateful LSTM network
gave the best results on labeled dataset for both KPI
revenue and conversion rate. Therefore, Stateful
LSTM algorithm has been chosen to be tested on the
campaign information appended dataset. In addition
to the initial experiments, we incorporate the cam-
paign information into the network considering that
campaigns have significant effects on the values of
KPIs in e-commerce domain. Thus, we expect the
network to learn instantaneous increases that occur
due to campaigns launched in website and thus pro-
duce better estimations. The campaign information is
represented with two exploratory variables indicating
the discount rate on the shopping cart and discount
rate on specific products as a percentage. These val-
ues are set to zero if the corresponding date is not a
campaign period.
The stateful LSTM with multivariate input has
DATA 2019 - 8th International Conference on Data Science, Technology and Applications
222
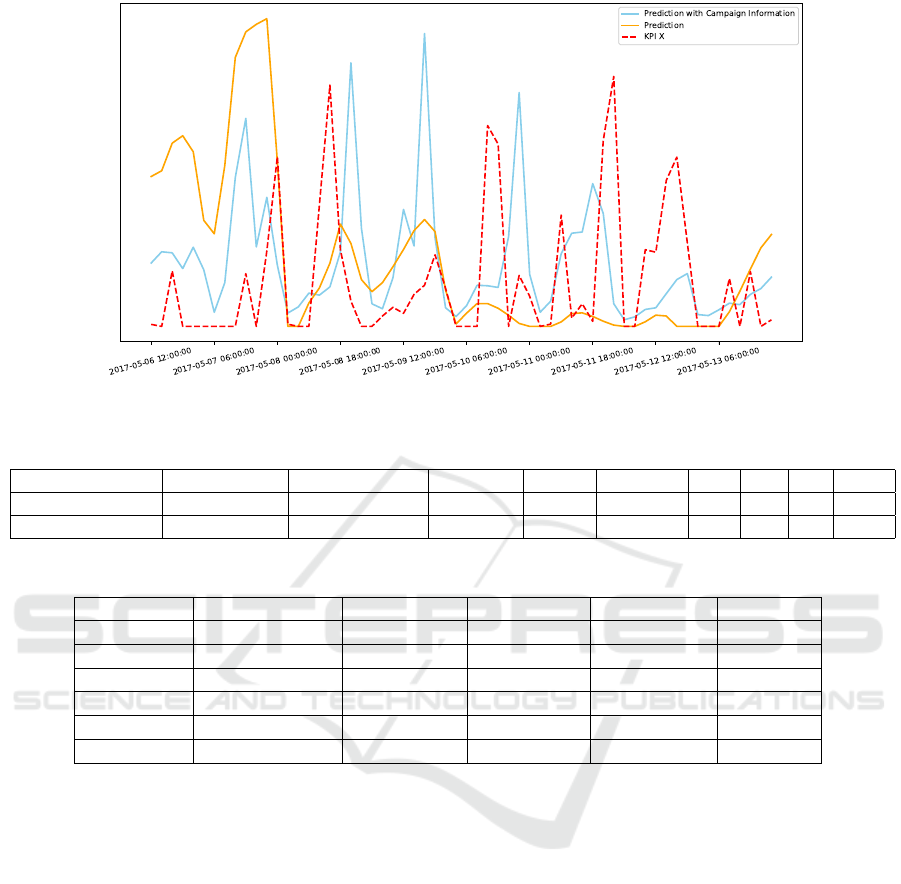
Figure 3: Prediction of univariate LSTM and multivariate LSTM with the campaign information in a specific campaign period.
Table 4: Results obtained with the use of campaign information for KPIs.
KPI Window Size Model Precision Recall F1 Score TP FN FP TN
Revenue 56 Stateful LSTM 0.85 0.67 0.75 110 54 19 1286
Conversion Rate 56 Stateful LSTM 0.85 0.90 0.87 120 14 22 1313
Table 5: Anomaly scoring sensitivity to the level of deviation for revenue.
Anomaly Id Anomaly Score Lower Level Upper Level Actual Value Deviation
Down-5 31.93% 80,343.42 380,261.53 70,188.00 10,155.42
Up-6 2.24% 53,839.01 280,687.68 290,852.00 10,164.31
Down-4 97.15% 88,095.09 300,796.90 59,776.00 28,319.09
Up-19 15.20% 0 134,370.79 161,274.00 26,903.20
Down-2 100% 61,698.76 399,689.40 0 61,698.76
Up-38 23.75% 0 157,332.60 218,364.00 61,031.39
been implemented both on revenue and conversion
rate. Table 4 shows the results obtained with the use
of campaign information for both KPIs. It is seen that
the success of the LSTM networks on revenue and
conversion rate have increased from 0.58 and 0.64 to
0.75 and 0.87, respectively. The recall values of the
both networks have significantly improved from 0.49
and 0.69 to 0.67 and 0.90 for revenue and conversion
rate, respectively. In Figure 3, the predictions of uni-
variate LSTM and multivariate LSTM with campaign
information along with the actual values of revenue
in a Mother’s Day campaign period is shown. It is
seen that with the the start of the campaign period
on May 8, the multivariate LSTM with the additional
campaign information starts to produce higher predic-
tions which are closer to actual KPI values.
Examples of anomaly scores along with their di-
rection and deviation information for revenue KPI
are given for in Table 5. The deviation represents
the difference between the actual values and the up-
per/lower level of the corresponding confidence in-
terval for anomalies having up/down directions, re-
spectively. Since the loss of revenue is more im-
portant in the e-commerce sector, the sensitivity of
the downward anomalies in the anomaly scoring sys-
tem is increased according to the ones upward as it
is mentioned in Section 2.4. Although the deviation
of Down-5 and Up-6, Down-4 and Up-19 or Down-2
and Up-38 are almost same, anomaly scores of down-
ward anomalies are significantly higher than upward
ones.
4 CONCLUSIONS
In this paper, we compared several anomaly detec-
tion methods in the context of e-commerce domain.
Our experimental evaluation has shown that stateful
LSTM outperformed the other models that have been
tested in this paper. The findings also showed that
Detection of e-Commerce Anomalies using LSTM-recurrent Neural Networks
223

LSTM can successfully use the additional campaign
information in a multivariate manner to learn the sud-
den increases in campaign periods. Even if some of
the data points in such periods are labeled as anomaly,
smaller anomaly scores will be produced by the mul-
tivariate LSTM and thus prevent some of the false
alarms depending on the pre-determined sensitivity
level of the system.
Our results suggest that the proposed anomaly de-
tection method is able to accurately detect the anoma-
lies that occur in the predetermined KPIs. Although
a carefully designed labeling process is performed by
four experts in our study, the human bias during the
labeling process can be regarded as a limitation. How-
ever, we should note that this limitation is not specific
to our study but a limitation of the time-series based
anomaly detection studies in general. As a future di-
rection, multiple anomaly detection algorithms can be
used in a hybrid way to improve the general success
rate.
ACKNOWLEDGEMENTS
This study is supported under project number
3170803 by The Scientific and Technological Re-
search Council of Turkey (T
¨
UB
˙
ITAK) Technology
and Innovation Grant Programs Directorate (TEY-
DEB).
REFERENCES
Ahmad, S., Lavin, A., Purdy, S., and Agha, Z. (2017). Un-
supervised real-time anomaly detection for streaming
data. Neurocomputing, 262(June):134–147.
Bhuyan, M. H., Bhattacharyya, D. K., and Kalita, J. K.
(2014). Network anomaly detection: Methods, sys-
tems and tools. IEEE Communications Surveys and
Tutorials, 16(1):303–336.
Chandola, V. (2009). Anomaly Detection : A Survey. ACM
Computing Surveys, 41(3):1–72.
Chevallier, J., Goutte, S., Chevallier, J., and Goutte, S.
(2014). Detecting jumps and regime switches in in-
ternational stock markets returns. Applied Economics
Letters, 22(13):1011–1019.
Evangelist, M., Editor, E., and Land, S. E. (2012). Ad-
vanced web metrics with Google Analytics. John Wi-
ley & Sons.
Goldstein, M. and Uchida, S. (2016). A comparative eval-
uation of unsupervised anomaly detection algorithms
for multivariate data. PLoS ONE, 11(4):1–31.
Hiles, A., Hon, F., et al. (2016). E-Business Service
Level Agreements: Strategies for Service Providers,
E-Commerce and Outsourcing. Rothstein Publishing.
Hochenbaum, J., Vallis, O. S., and Kejariwal, A. (2017).
Automatic Anomaly Detection in the Cloud Via Sta-
tistical Learning. arXiv e-prints. arXiv:1704.07706.
Hochreiter, S. and Urgen Schmidhuber, J. (1997). Long
short-term memory. Neural Computation, 9(8):1735–
1780.
Hyndman, R. J. and Athanasopoulos, G. (2018). Forecast-
ing: Principles and Practice. OText.
Knorn, F. and Leith, D. J. (2008). Adaptive Kalman fil-
tering for anomaly detection in software appliances.
Proceedings - IEEE INFOCOM.
Laudon, K. C. and Traver, C. G. (2016). E-commerce 2016:
business. technology. society. Pearson Education.
Malik, H. and Shakshuki, E. M. (2017). Detecting per-
formance anomalies in large-scale software systems
using entropy. Personal and Ubiquitous Computing,
21(6):1127–1137.
Massa, D. and Valverde, R. (2014). A Fraud Detection Sys-
tem Based on Anomaly Intrusion Detection Systems
for E-Commerce Applications. Computer and Infor-
mation Science, 7(2):117–140.
Raghava-raju, A. (2017). Predicting Fraud in Elec-
tronic Commerce : Fraud Detection Techniques in E-
Commerce. International Journal of Computer Appli-
cations, 171(2):18–22.
Ramakrishnan, J., Shaabani, E., Li, C., and Sustik, M. A.
(2019). Anomaly Detection for an E-commerce Pric-
ing System. arXiv e-prints. arXiv:1902.09566.
Ruiz, C. W., Perapoch, J., Castillo, F., Salcedo, S., and
Gratac
´
os, E. (1994). Learning Long-Term Dependen-
cies with Gradient Descent is Difficult. IEEE TRANS-
ACTIONS ON NEURAL NETWORKS, 5(2):157–166.
Singh, A. (2017). Anomaly Detection for Temporal Data
using Long Short-Term Memory ( LSTM ). Master’s
thesis, KTH Information and Communication Tech-
nology.
Siwoon Son, Myeong-Seon Gil, and Moon, Y.-S. (2017).
Anomaly detection for big log data using a Hadoop
ecosystem. 2017 IEEE International Conference on
Big Data and Smart Computing (BigComp), pages
377–380.
Yang, Z., Cao, S., and Yan, B. (2011). Using linear discrim-
inant analysis and data mining approaches to identify
E-commerce anomaly. Proceedings - 2011 7th Inter-
national Conference on Natural Computation, ICNC
2011, 4:2406–2410.
Yelundur, A. R., Sengamedu, S. H., and Mishra, B. (2018).
E-commerce Anomaly Detection: A Bayesian Semi-
Supervised Tensor Decomposition Approach using
Natural Gradients. arXiv e-prints. arXiv:1804.03836.
DATA 2019 - 8th International Conference on Data Science, Technology and Applications
224
