
Modelling, Optimization, and Simulation of Several First Aids in
an Area with Plant Simulation
Jolana Sebestyénová
a
and Peter Kurdel
b
Institute of Informatics, Slovak Academy of Sciences, Bratislava, Slovakia
Keywords: Discrete-event Systems, Modelling, Optimization, Simulation, Genetic Algorithm, Distributed Computing,
Plant Simulation.
Abstract: Plant Simulation software comprises all the features needed to model the functional aspects of most real-
world systems. Specification of complex optimization problem (in sense of many optimization parameters)
and its solving in Plant Simulation by genetic algorithm is possible, but it leads to significantly ascending
simulation time. The paper presents division of the optimization to two parts: first part of the optimization via
GA using distributed computing, and the second part of optimization parameters that will be used in the
second stage of the optimization. Modelling, optimization, and simulation procedure proposed for Plant
Simulation is presented and tested on a simple use case. In the first stage, the placement of several first aid
posts in the area where distinct happenings can go on is optimized, the second stage of the optimization is
done using Experiment manager with the aim to select the best solution, i.e. optimal number of first aids in
the area depending on additional optimization parameters.
1 INTRODUCTION
Dynamic systems modelling and discrete event
simulation represents a very wide range of research
and development effort for many years. In 1998, the
authors of this paper presented their modelling and
simulation tool for discrete event dynamic systems
with statecharts formalism used for description of the
system’s behaviour in (Sebestyénová, 1998). Matlab
Stateflow was used in (Kurdel and Sebestyénová,
2010, 2011) for application-based heuristic
scheduling of a production process in flexible
manufacturing.
Plant Simulation software based on discrete-event
simulation contains all the necessary required to
model the operational facets of real-world systems
(Bangsow, 2015). As it abstracts to deal with just
important aspects, it is able to simulate months of
factory operation in just seconds. Its primary role is
to provide for integrated, graphic and object-oriented
modelling, simulation and animation. A lot of
complicated and sophisticated systems may be
modelled and displayed in great detail closely
corresponding to reality using 2D/3D simulation.
a
https://orcid.org/0000-0003-4677-9972
b
https://orcid.org/0000-0002-8080-2411
Plant Simulation is well equipped for animation
and visualisation of results, which are used in great
extent in commercial applications to provide for
communication with the user. Quite often, it is
adequate to concentrate on functional aspects, as the
model itself is not of the primary importance. This
enables to use animation only at the debugging phase,
so as to accelerate the model performance in other
circumstances.
Well-structured simulation models reflect the
natural hierarchy of systems to be simulated. The
basic object Frame can be put into the RootFrame or
in another Frame, and create thus a dynamical
hierarchy of models. Moreover, one can in this way
break down complex tasks into manageable parts. In
a case of several similar processes, setting up of the
Frame of this process and adding multiple instances
of this Frame on the RootFrame enables to structure
the models and make them easier to maintain, with
the help of modular design and object-oriented
programming.
Survey on the use of simulation for manufacturing
system design and operation are given in (Smith,
2013). Blaga et al. (2018) compares modelling with
Petri nets to Tecnomatix Plant Simulation in the field
Sebestyénová, J. and Kurdel, P.
Modelling, Optimization, and Simulation of Several First Aids in an Area with Plant Simulation.
DOI: 10.5220/0007927602850292
In Proceedings of the 9th International Conference on Simulation and Modeling Methodologies, Technologies and Applications (SIMULTECH 2019), pages 285-292
ISBN: 978-989-758-381-0
Copyright
c
2019 by SCITEPRESS – Science and Technology Publications, Lda. All rights reserved
285
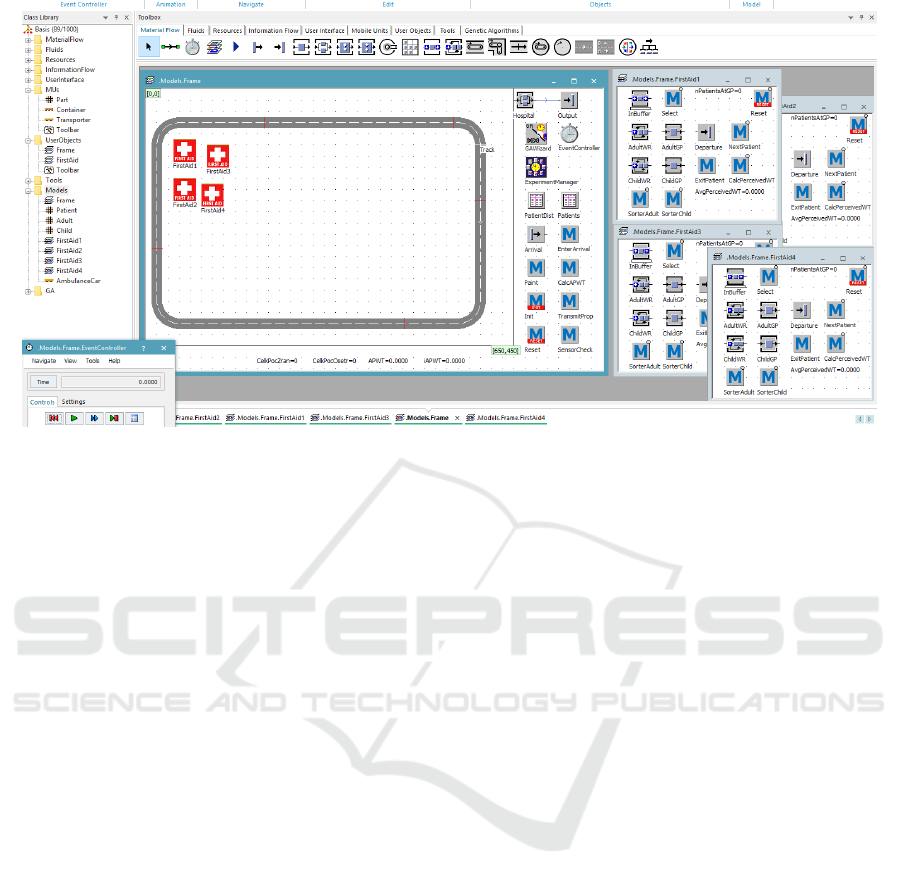
Figure 1: A frame of the model with an area, and sub-frames of four first aids (represented as icons in the area).
of manufacturing process management. In order to
organize the smart manufacturing, and flexible and
efficient production processes, Kokareva, Malyhin &
Smelov (2015) used Plant Simulation for optimizing
and validating process performance. Possibilities and
examples of using Tecnomatix Plant Simulation to
simulate the production and logistics processes was
presented in (Siderska, 2016). Vavrík, Gregor &
Grznár (2017) described Computer simulation as a
tool for the optimization of logistics. This paper
comes up with modelling, optimization and
simulation schema proposed for Plant Simulation and
testing it on the use case taken from the Plant
Simulation manual (Mes, 2017, pp. 88-91); the use
case was extended to comply to the purpose.
As a problem description, one can suppose there
is a festivity terrain for which it is necessary to setup
first aid posts. One needs to distribute first aid posts
with efficiency in order to get a good coverage over
the whole area. In certain cases the modelled process
involves the transportation of entities (e.g., patients)
and the transportation might necessitate a vehicle.
The use of the Track object and the Transporter object
seems to be in this case a reasonable choice.
Specification of complex optimization problem
(in sense of many optimization parameters) and its
solving in Plant Simulation by genetic algorithm is
possible, but it leads to significantly ascending
simulation time. The paper presents division of the
optimization parameters to its first part used in the
first stage of the optimization using GA, whereas the
second part of parameters will be used in second stage
of the optimization using Experiment Manager.
The programming language SimTalk extends the
ways of modelling and control of the simulation. The
Interpreter executes the source code entered into the
Method. SimTalk 2.0 is used in presented model.
In the second section, a generic model of a first
aid post is created. Instances of the model will then
be used in three area frames representing placement
of two, three, and four first aid posts in the areas,
where many people are moving and passing their
time. Some of them sometimes suffer an accident, and
require a medical treatment. The third section
presents the first step of two stages of optimization of
the number and placement of the first aids in the area.
In the section 4, some simulation results are given,
and the second stage of optimization is presented.
2 FRAMES OF A MODEL
At first, a model of a first aid post is created in Class
library under User objects, followed by a model of an
area where some events may go on with different
number of incoming people. EnterArrival method of
the frame of the model, in which the area is presented,
generates random appearance of some accidents in
the area.
The Fig. 1 presents the frame containing the area
with four derived first aids (FAs) from the user object
FirstAid (see in Class Library at the left). In the frame
with the area, the FAs are represented by icons, and
in the right part of the picture, they are open. Some of
the methods in this sub-frames are inherited, which is
visualized by a little grey circle at the upper right
SIMULTECH 2019 - 9th International Conference on Simulation and Modeling Methodologies, Technologies and Applications
286

corner of the method (to be seen in the sub-frames at
the right).
The arrival rate of adults and children is given in
a PatientDist tablefile of the frame with the area. A
visitor having an accident selects to go to the nearest
FA. Here, he/she will wait in a waiting room or move
to a general practitioner (in a case that he/she is free)
according to patient's urgency or time of arrival. The
patients are sorted to a general practitioner (GP) for
adults and GP for children. The treatment times of
patients are random, some 20 minutes for adults and
30 minutes for children.
In each of the FA frames, an inherited method
NextPatient moves a patient (modelled as a mobile
unit Adult/Child) to the appropriate GP if free, and
then moves treated patients to an exit. In a case the
patient needs any further treatment in a hospital, an
ambulance car appears on a track and transports the
patient from one of the FA posts to the hospital. The
car stops near the calling FA at the place specified by
a sensor and boards the patient.
During the testing or presentation of the model, it
is advantageous to animate movements of the mobile
units, but as expected, eventual animation slows
down optimization run.
The procedure proposed to face up to complex
optimization problem (with many optimization
parameters) describes all steps from starting with
creation of some useful objects ... up to creation and
simulation of the root frame containing the whole
model. Some simulations can run simultaneously,
which saves simulation time. Trying to use all
optimization parameters in GA wizard (which could
be done only for the version with 2 FAs, because of
our educational licence with limits, specification of
all optimization parameters for 3 / 4 FAs was not
possible), the simulation time rose significantly.
Modelling, optimization and simulation of the
use-case follows the procedure:
Create model of an FA (mobile units MUs created
here: Patient -adult, -child, General practitioner
GP -for adults, -for children).
Create the frame with an area where sub-frames
of the FAs will be placed (MUs created here: an
ambulance car AC on a track).
Make separate/simultaneous optimization of
placements of FAs in the area, first with 4 FAs,
then with 3 FAs, and finally with 2 FAs placed in
the area. (Though in simple cases one could
relatively easily guess the best placements, in case
of more complicated models such as e.g.
workshops or logistics in a factory such an
optimization can appear to be indispensable.)
Create a root frame (main frame of the model)
containing in our test 3 area frames (mobile units
created here: GP that in last step after the
optimizations will move to the AC of the area with
optimal number and placement of the FAs, so
called winner area).
Make simulations using best placements of FAs in
three different areas (modelled as sub-frames of a
root frame) - this can be done simultaneously.
The second stage of optimization runs (also
simultaneously) some experiments based on
additional optimization parameters, in order to get
the best solutions from usage of 4, 3, or 2 FAs.
This approach can bring useful results in various
situations, such as in a case of planned
reconstruction of a workshop, where one can
acquire knowledge about how many stations of
different types is optimal to use, or how many
workers of different qualifications is optimal to
use after the reconstruction.
Make simulation of the whole model comprising
the winner area with its FAs. In the presented
case, the GP starts from the input of the root frame
to move to the AC of the winner area (as it can be
seen in the last figure in section 4). But in a more
complicated situation, input from the root frame
may be changed for interfaces connecting outputs
from a number of different previous frames to this
frame. Modelling, optimization and simulation
schema of that kind could be helpful for a
designer.
In the following, an event starting at noon with
duration time 6 hours, attendance about 1000 people
(40% of them being children) are supposed.
Approximately 70 accidents are expected to occur
during the event.
3 OPTIMIZATION USING GA
The popularity of genetic algorithms (GA) stems
from the fact that they return good results while being
task-independent. The GAs are therefore perfectly
convenient in miscellaneous simulation-based
optimization tasks. For example, routing optimization
for ATM cash replenishment with many optimization
parameters using GA is described in (Kurdel and
Sebestyénová, 2013a, 2013b), with optimization pa-
rameters divided to pattern and route chromosomes.
The Plant Simulation wizard for GA (GAWizard)
integrates GA into an existing simulation model.
At first, the definition of the optimization problem
was done using fitness function specified in Optim
method, which returns the fitness value. An
Modelling, Optimization, and Simulation of Several First Aids in an Area with Plant Simulation
287
individual representation consists of two
chromosomes. The user defined optimization
parameters (a number of FAs and their positions)
create a placements chromosome. The fitness
function used in this test:
f = max (w
1
Treated) + min (w
2
APWT)
(1)
where Treated is number of the patients treated to the
end of the event in the area with given number of the
FAs posts (4 / 3 / 2); APWT is average waiting time
calculated from waiting times of the patients at the
FAs in the given area.
Further, the individual representation was
enlarged by creating a second chromosome consisting
of three more optimization parameters: fee of one FA
service, and penalty cost for the number of patients
not cared to the end of the event (NoWP), and penalty
cost for average waiting time of the patients (APWT).
The fitness function was modified to:
f = min (α cost
1
+ β cost
2
+ ϒ cost
3
)
(2)
where α, β, ϒ are weights,
cost
1
... cost of still waiting patients at end of the event
calculated: NoWP * penalty
1
cost
2
... cost of average waiting time of the patients
calculated: APWT * penalty
2
cost
3
... cost of the FA posts calculated: number of
FAs * penalty
3
(fee of one FA service).
As more than 20 user defined optimization
parameters were set, the specification of appropriate
lower and upper bounds of the parameters has been
complicated, and the work was slow. So the decision
was made to use the above proposed modelling,
optimization and simulation schema.
In the first stage, the placement of 4 / 3 / 2 FAs in
the area of the event is optimized using as
optimization parameters the total number of treated
patients in 6 hours duration of the event, and
minimization of the waiting time of the patients. This
optimization is done using fitness function (1). (The
optimization according to the second chromosome
will be described later using Experiment manager.)
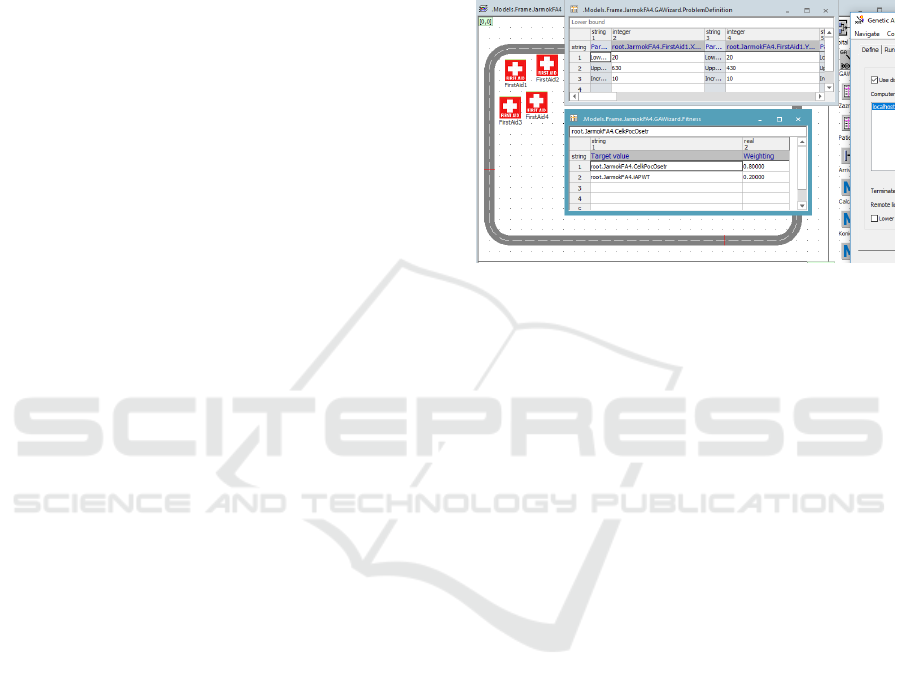
For the optimization problem, fitness calculation
is specified by table in GA wizard, which can be seen
at the bottom part of Fig. 2. Weights w
1
, w
2
of this
fitness calculation are set to 0.8 for number of treated
patients and to 0.2 for inversion of the waiting time.
GA wizard enables to maximize/minimize all parts of
the fitness, but needing to maximize the first of them,
and minimize the second, inversion was used.
Optimization parameters are x, y positions of the FAs
- their ranges are defined by lower and upper bounds
and an increment as given in the top part of Fig. 2.
The number of required simulation runs for an
optimization can become quite large. The number of
individuals to be evaluated depends on the number of
generations and size of a generation. In the first
generation, Plant Simulation evaluates the specified
size of generation, and in each of the following
generations it has to evaluate twice as many
individuals. Length of an individual is given by the
Figure 2: Problem definition in GA wizard.
length of the above mentioned chromosomes.
In the realized test case, number of generations
was set to 20, size of generation was set to 30, and a
number of observations per individual was set to 10.
More people arriving to the event or happening,
more accidents can occur, and more FAs will be
needed. The second stage can optimize the selection
of the number of the FAs placed on the area according
to the number of people arriving to the given event
and FA service fee, which will be described later after
some simulations in section 4.
3.1 Results from GA
In the test case, running times of optimizations ranged
approximately from 3 to 5 minutes. As Plant
Simulation provides possibility of distributed
computing, it has been used to run GA wizard.
Usage of distributed computing on PC with 4
cores reduced the optimization running times
approximately to half of the values without the usage
of distributed computing. In presented simple use
case this speedup makes only a small difference, but
the gain in complex models can be important.
Placement of 4 FAs in the area: Left part of Fig. 3
presents the best individual for 4 FAs in the area and
a performance graph, where no further improvement
can be observed after about the 10th generation. For
illustration, a screenshot of evaluated best individuals
is given at the bottom part of the picture. Best
achieved fitness value is 52.1600. One can see that
the best individual did not place the FAs
SIMULTECH 2019 - 9th International Conference on Simulation and Modeling Methodologies, Technologies and Applications
288
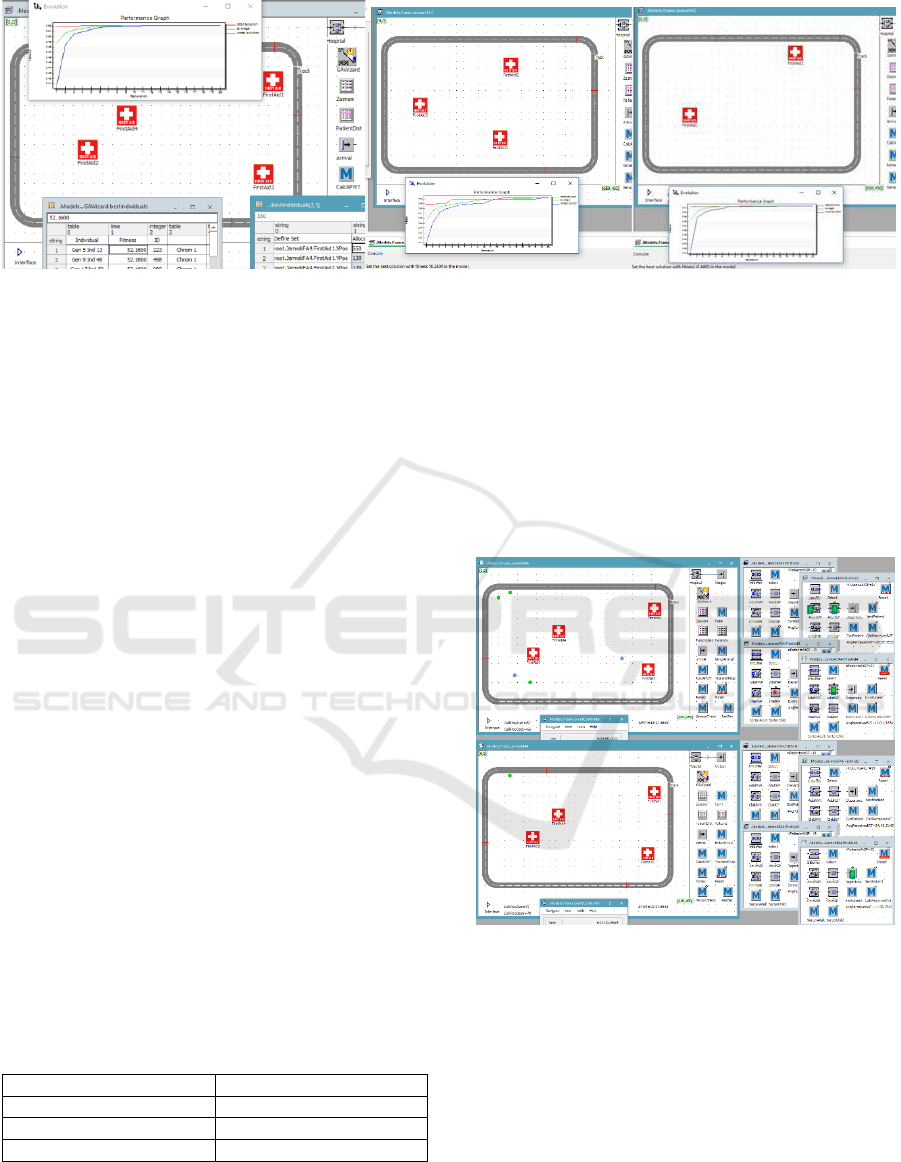
Figure 3: Best individuals for 4 / 3 / 2 FAs with performance graphs of GA.
symmetrically around the centre of the area, which
seems to be apparently their best placement. This
result can be partly due to random appearance of the
accidents as well as to the fact that working with
Educational license does not allow to improve GA
settings via GA Optimization wizard.
Placement of 3 FAs in the area: In the middle part,
Fig. 3 presents the best individual for 3 FAs in the
area and a performance graph, where improvement
can be observed in about 18th generation. Best
achieved fitness value is 50.2400, which is less than
in previous case, because more patients still wait for
treatment in the FAs in this case. The bottom part of
the picture contains a console with information about
setting of the best solution in the model after the end
of GA optimization, via configuration method
TransmitProperties.
Placement of 2 FAs in the area: Right part of
Fig. 3 presents the best individual for 2 FAs in the
area and a performance graph. Best achieved fitness
value is 41.4400, which is less than in previous two
cases, because more patients still wait for treatment in
the FAs in this case.
3.2 Best Fitness
For smooth comparison, a summary of the best fitness
values of the three GA optimizations are given in
table 1.
Table 1: Summary of best fitness of the 3 optimizations.
No of FAs in the area
Best fitness
4
52.1600
3
50.2400
2
41.4400
4 SIMULATION RESULTS
Simulations were run for all versions, i.e. for the
event in the area with 4 / 3 / 2 FA posts, using their
previously optimized positions. From the following
simulations, one receives values of the variables:
average waiting time of the patients, number of the
patients still waiting for care at the closing time of the
Figure 4: Top part of the picture presents situation at the
closing time of the event with 4 FAs, bottom part of the
picture presents situation when last patient goes away.
event, time when the last patient leaves the area.
Fig. 4 presents simulation results in the case of 4
FAs in the area. Top part of the picture presents
situation at the closing time of the event (6:00:00
[h:m:s]). The blue and green circles in the area
represent locations where these last patients suffered
accidents. These circles representing the accident
placements are removed after any patient leaves any
FA. At the end of the event, 4 patients remain to be
cared for. In the opened frames of the FAs, the
Modelling, Optimization, and Simulation of Several First Aids in an Area with Plant Simulation
289
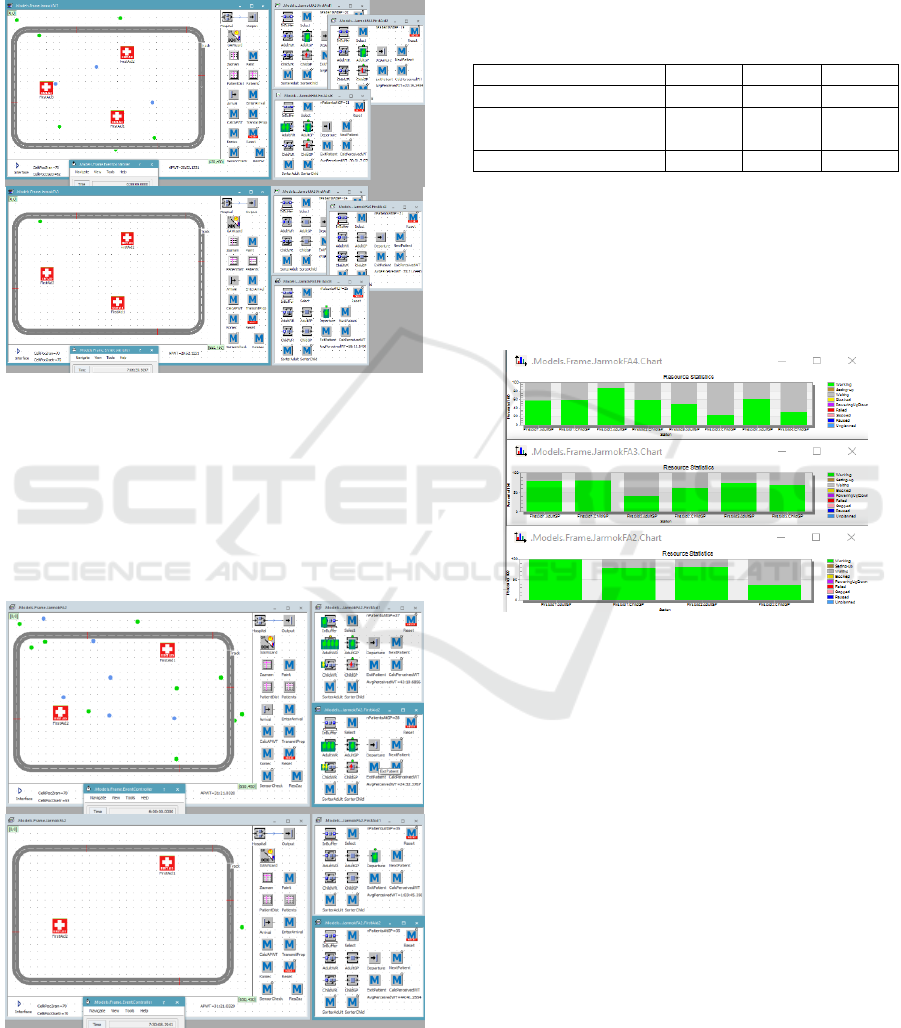
patients are animated at the closing time of the event.
The last patient goes away at 6:11:13, and one can see
this last patient animated on the departure in the open
frame of the FA. Average waiting time of all the
patients is 13:27 in this case.
Figure 5: Top part presents situation at the closing time of
the event with 3 FAs, bottom part presents time when last
patient goes away.
Fig. 5 presents simulation results in the case of 3
FAs in the area. At the end of the event 8 patients
remain to be cared for. The last patient goes away at
7:06:39. Average waiting time of all the patients is
20:52.
Figure 6: Top part presents situation at the closing time of
the event with 2 FAs, bottom part presents time when last
patient goes away.
Fig. 6 presents simulation results in the case of 2
FAs in the area. At the end of the event 15 patients
remain to be cared for. The last patient goes away at
7:30:08. Average waiting time of all patients is 31:21.
To make some comparison, part of the simulation
results are summarized in table 2.
Table 2: Simulation results.
Area with:
4 FAs
3 FAs
2 FAs
Average waiting time
13:27
20:52
31:21
No of waiting patients
at closing time
4
8
15
Time of last departure
6:11:13
7:06:39
7:30:08
4.1 Resource Statistics
Resource statistics charts in Fig. 7 present GPs
working (green) and waiting (grey) times for all three
cases (top for 4 FAs, middle for 3 FAs, bottom for 2
FAs).
Figure 7: Statistics of the working time of the adult/child
GPs.
4.2 Second Stage of Optimization
In case of too expensive service fee of the FA post, it
may sometimes be better to provide fewer FAs. One
will select the best solution (number of FAs in the
area) depending on the following parameters: service
fee of one FA, average waiting time of the patients,
number of patients still waiting for treatment at the
closing time of the event. The second stage of the
optimization is done using Experiment manager of
Plant Simulation. Optimization using Experiment
manager is a good option in cases similar to tested
one, as one can add on a step by step basis new
experiment specifications based on formerly found
best solutions. Results from Experiment manager are
given in Fig. 8 in a form of a screenshot, but it is also
possible to export results from the Plant Simulation
model to Excel file and continue analysis of achieved
big data using another approaches.
SIMULTECH 2019 - 9th International Conference on Simulation and Modeling Methodologies, Technologies and Applications
290
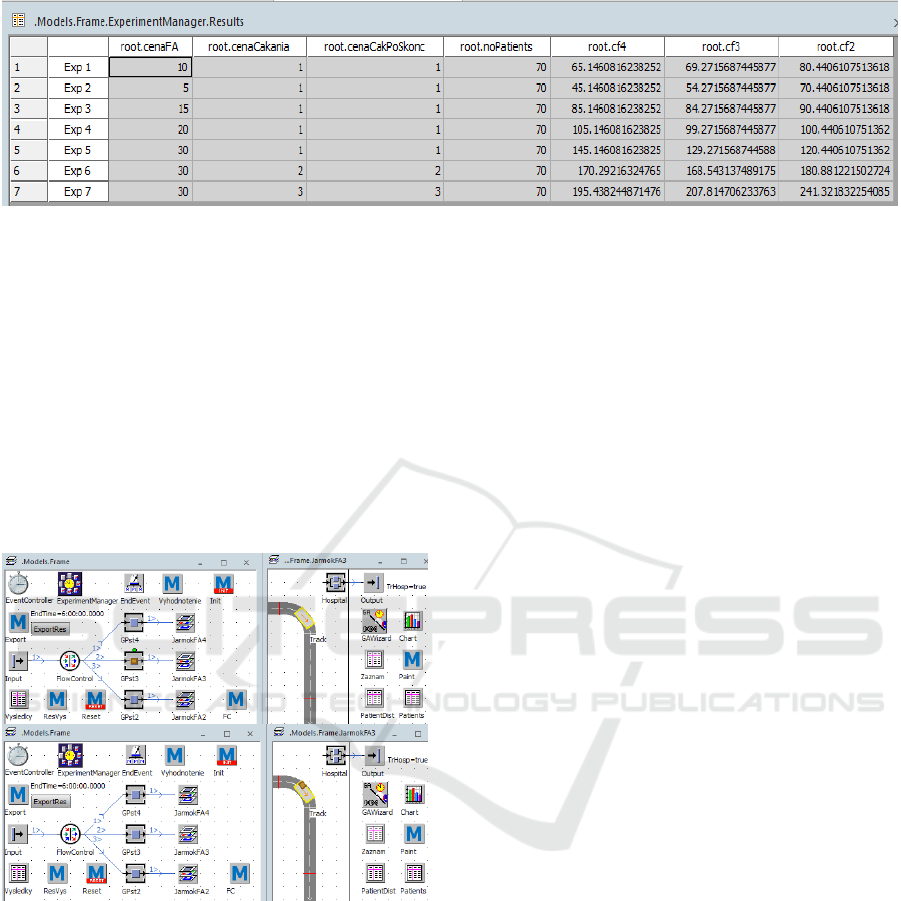
Figure 8: Results from Experiment manager.
In the first three columns, the fee of one FA
service, the fee of the waiting time of the patients, and
the fee of number of the patients still waiting for
treatment after the end of the event are set. (In the 4th
column, a total number of the patients was in all
experiments equal.) Last three columns give the best
fitness in cases of 4 / 3 / 2 FAs. Thus, the experiment
6 e.g. reveals that the best solution is to place 3 FAs
in the area, because in this second stage of
optimization a minimum total cost is the best one.
Finally, the presentation of the complete model
follows, where the GP working in the AC moves to
Figure 9: Start of the complete model simulation.
the AC created in the frame with the best result, which
is for example (according to above mentioned
experiment 6) the area frame with 3 FAs. Top part of
Fig. 9 presents movement of the GP serving in the AC
from Input in direction to the frame with 3 FAs
(represented by a small brown square icon). The
bottom part presents him/her sitting in the AC on the
Track (the small brown square icon moved from the
root frame to AC parking close to the hospital on the
Track in the winner area frame), in the next step of
the simulation.
Program code of FC method applied as exit
strategy in Flow control object (move of the GP to the
AC is based on it):
-> integer
-- @ is the movable unit
var r:integer
if bestNoOfFA = 4
if .Models.Frame.JarmokFA4.TrHosp =
true
r := 1
end
elseif bestNoOfFA = 3
if .Models.Frame.JarmokFA3.TrHosp =
true
r := 2
end
elseif bestNoOfFA = 2
if .Models.Frame.JarmokFA2.TrHosp =
true
r := 3
end
end
return r
In presented test case, the necessity of the
transport is represented by a boolean variable
TrHosp. Its value is set by the FA that provided the
treatment of the patient needing the further care in the
hospital. For simple test purpose, the patients with
highest urgency are all supposed to need the transport.
5 CONCLUSIONS
Dynamic systems modelling and discrete event
simulation represents a very wide range of the
research and development effort for many years.
Plant Simulation software comprises all the features
needed to model the functional aspects of most real-
world systems. The procedure proposed to face up to
complex optimization problem (with many
optimization parameters) describes all steps from
starting with creation of some useful objects ... up to
creation and simulation of the root frame containing
Modelling, Optimization, and Simulation of Several First Aids in an Area with Plant Simulation
291

the whole model. Some simulations can run
simultaneously, which saves simulation time. The
proposed modelling, optimization and simulation
schema for Plant Simulation was tested on a simple
use case taken from the Plant Simulation manual.
Two optimization steps are used according to
proposed schema. In the first stage, three
optimizations of several FAs placement in the area
are separately done using GA with distributed
computing. Subsequent simulations of the three
distinct happening areas with their movable objects
can be done simultaneously. Acquired results, such as
e.g. average waiting time of the patients, are used in
the second stage of the optimization besides some
additional optimization parameters, e.g. fee of FA
service. This second stage of optimization is done by
Experiment manager.
In final simulation, the Flow control directs the
GP serving in the ambulance car to the winner area
frame, and only this area frame with its FAs frames
works in this simulation besides the root frame.
Presented results can be seen as the first part of
the project research. In further work, the authors plan
to examine in more detail some logistics problems,
a.o. the movement of the ambulance car transporting
the patients to the hospital if they need further
treatment. The proposed modelling, optimization and
simulation procedure (tested on a simple use case)
can prove its usefulness when dealing with more
complex processes.
ACKNOWLEDGEMENTS
The authors are grateful to Scientific Grant Agency
of Slovak Republic and Slovak Academy of Sciences
for partial support of this work by projects VEGA
2/0167/16 and VEGA 2/0155/19.
REFERENCES
Bangsow, S, 2015, Manufacturing Simulation with Plant
Simulation and SimTalk- Usage and Programming
with Examples and Solutions, Springer-Verlag,
Berlin Heidelberg, viewed 10/12/2018
https://link.springer.com/content/pdf/10.1007%2F978-
3-319-19503-2.pdf
Blaga, F, Stanasel, I, Pop, A, Hule, V & Karczis, A, 2018,
´The use of modeling and simulation methods to
improve the performance of manufacture lines´ in
ModTech2018 IOP Conf. Series: Materials Science and
Engineering 400 (2018) 042006, viewed 20/2/2019
https://www.researchgate.net/publication/327731392_
The_use_of_modeling_and_simulation_methods_to_i
mprove_the_performance_of_manufacture_lines
Kokareva, V, Malyhin, A & Smelov, V, 2015, ´Production
Processes Management by Simulation in Tecnomatix
Plant Simulation´ in Applied Mechanics and Materials,
Vol 756 (2015), pp. 604-609, Trans Tech Publications,
Switzerland, viewed 20/2/2019
https://www.researchgate.net/publication/277662116_
Production_Processes_Management_by_Simulation_i
n_Tecnomatix_Plant_Simulation
Kurdel, P, Sebestyénová, J, 2010, ´Statecharts model for
application based scheduling of a manufacturing
process´ in Process Control 2010, pp. C059a-1-C059a-
8. ISBN 978-80-7399-951-3.
Kurdel, P, Sebestyénová, J, 2011, ´Statecharts model and
heuristic scheduling of a production process´ in IEEE
INES 2011 - Budapest, pp. 309-314. ISBN 978-1-4244-
8955-8.
Kurdel, P, Sebestyénová, J, 2013a, ´Routing optimization
for ATM cash replenishment´ in International Journal
of Computers, 2013, vol. 7, pp. 135-144. ISSN 1998-
4308.
Kurdel, P, Sebestyénová, J, 2013b, ´Parallel genetic
algorithm for periodic vehicle routing and scheduling
problem´ in IEEE ICSSE 2013 - Budapest, pp. 111-116.
ISBN 978-1-4799-0007-7.
Mes, M, RK, 2017, Simulation Modelling using Practical
Examples. A Plant Simulation Tutorial. University of
Twente, viewed 15/10/2018
https://www.utwente.nl/en/bms/iebis/staff/mes/plantsi
mulation/tutorialplantsimulation13v20170726.pdf
Sebestyénová, J, 1998, ´Stacha: a computerized modelling
tool for DEDS´ in Advances in Systems, Signals,
Control and Computers. Edited by V. J. Bajic.
IAAMSAD. Vol III, 1998 Durban, pp. 389-393. ISBN
0-620-23136-X.
Siderska, J, 2016, ´Application of Tecnomatix Plant
Simulation for Modeling Production and Logistics
Processes´ in Business, Management and Education,
ISSN 2029-7491/eISSN 2029-61692016, 14(1), pp.
64-73, viewed 20/2/2019
https://www.researchgate.net/publication/305269846_
Application_of_Tecnomatix_Plant_Simulation_for_M
odeling_Production_and_Logistics_Processes, DOI:
10.3846/bme.2016.31
Smith, JS, 2013, ´Survey on the use of simulation for
manufacturing system design and operation´ in Journal
of Manufacturing Systems 22(2), pp. 157-171, viewed
20/2/2019 http://dx.doi.org/10.1016/S0278-
6125(03)90013-6
Vavrík, V, Gregor, M & Grznár, P, 2017, ´Computer
simulation as a tool for the optimization of logistics
using automated guided vehicles´ in Procedia
Engineering 192, pp. 923-928.
SIMULTECH 2019 - 9th International Conference on Simulation and Modeling Methodologies, Technologies and Applications
292
