
Optimized Sleep Apnea Detector using UWB Signals
Jesús G. Servín-Aguilar
a
, Jorge A. Pardiñas-Mir
b
and Luis Rizo-Dominguez
c
Department of Electronics, Systems and Informatics, ITESO University, Tlaquepaque, Mexico
Keywords: Sleep Apnea, UWB Technology, Optimization, Parametric Multidimensional Search, eHealth.
Abstract: Sleep apnea is a syndrome defined as the pause of breathing for more than 10 seconds while the patient
remains asleep. Diseases such as strokes, coronary heart attacks or diabetes could be associated with an
untreated sleep apnea. UWB is an alternative technology to help treat this condition. It is a non-invasive
technology, with low power and low radiation. In this article we present a system based on UWB signals to
detect sleep apnea. It is shown that the proposed algorithm correctly detects apnea. Once this is done, an
experimental optimization is performed to find the parameters that produce the best results.
1 INTRODUCTION
The main cause of death in the world is chronic
diseases (WHO, 2014). 70 % of deaths in the world
are diseases like diabetes, heart diseases, strokes, or
cancer (WHO, 2018). Half of these deaths correspond
to people over 70 years old (WHO, 2014). It is
expected that between 2000 and 2050 the population
over 60 years old will increase from 11% to 22% with
respect to the world population (WHO, 2015). This
data indicates that the world population has become
old. If we focus on elderly people, we find that most
of our seniors prefer to live alone in their own homes,
than living with their families or in a care center (Hou,
2009). The risk is that, if they live alone, they may
have an accident caused by a health problem and there
would be no one around to help them. Therefore, the
time it takes a family member or medical assistant to
know that the elderly have had an accident can be too
long and can cause irreversible damage.
Another alarming problem around the world is the
overpopulation of hospitals. A solution to reduce the
number of patients attending hospitals every day is to
design a system to monitor vital signs and send the
information to a remote database. From there, doctors
can review, make a diagnosis, and give or modify the
treatment of a patient via internet. This could be in
fact a remote medical appointment (Hou, 2009). This
situation has represented in the last years a good
a
https://orcid.org/0000-0002-1908-3171
b
https://orcid.org/0000-0002-0972-3980
c
https://orcid.org/0000-0001-9393-5320
opportunity for research work aimed to develop
solutions in this area. In this scope, Wireless Sensor
Networks (WSN) and Wireless Body Area Networks
(WBAN) have been considered to be applied to
monitor patient vital signs constantly like the
patients’ breathing to detect sleep apnea.
The sleep apnea (SA) is a syndrome which affects
at least 6% of the adult population (WHO, 2017). SA
is the breathing pause for 10 seconds or more while
the patient is asleep. Occasionally, a normal person
can have apnea. However, a health damage is
considered when the patient has at least 300 sleep
apneas per night or its duration is around 5 minutes
(Varady, 2003), (AASM, 2017), (Guyton, 2011). SA
is caused by the obstruction of the airways [8] and it
is divided into two types: central sleep apnea (CSA)
and obstructive sleep apnea (OSA). In the CSA, the
nervous central system does not send the impulse
information to the airway muscle and they block the
air conduct in the pharynx. On the other hand, the
OSA is caused by soft tissues of muscle that block the
airway conduct (Varady, 2003), (Guyton, 2011). In
both cases, it could be accompanied by loud snoring
(WHO, 2017). After that, the snore is interrupted by
a long silence. Finally, the brain sends an impulse to
the patient to open the airway or move the body to
continue breathing (Guyton, 2011). A patient with SA
could present different symptoms such as feeling
sleepy or sleep during the day, be forgetful, having
strong headaches, fall asleep while the patient is
Servín-Aguilar, J., Pardiñas-Mir, J. and Rizo-Dominguez, L.
Optimized Sleep Apnea Detector using UWB Signals.
DOI: 10.5220/0007931103610369
In Proceedings of the 16th International Joint Conference on e-Business and Telecommunications (ICETE 2019), pages 361-369
ISBN: 978-989-758-378-0
Copyright
c
2019 by SCITEPRESS – Science and Technology Publications, Lda. All rights reserved
361
watching TV, working, driving, reading, or waking
up tired in the morning (MedlinePlus, 2017).
Currently, the medical method to diagnose sleep
apnea is performed with a polysomnography (AASM,
2017), (Guyton, 2011), (MedlinePlus, 2017). In this
technique, an oxygen mask is placed on the nose and
mouth of the patient while sleeping. Then, the device
records the patient’s breathing and it detects when the
sleep apnea occurs, as well as its duration. There are
other complementary tests that confirm SA, such as
electrocardiography (ECG), echocardiography,
thyroid test, or arterial blood test (MedlinePlus,
2017). Also, a non-invasive technique to detect sleep
apnea is to measure the patient chest movements. For
example, pressure transducers are placed on the
patients’ bed. When the patient inhales or exhales, the
pressure exerted on the bed changes. When a sleep
apnea occurs, the pressure of the body on the bed is
still for more than 10 seconds (Waters, 2019).
However, the patient must be in a specific position for
the breathing frequency detection. Another technique
is the Doppler radar, which measures the distances
between the radar and the chest of the patient. If
distances don’t change for more than 10 seconds, then
the sleep apnea alert is activated. Unfortunately, this
technique, in some cases, tends to be inaccurate (Lai,
2011). Recent experiments show that sleep apnea can
be detected using the Ultra-Wide Band (UWB)
technology (Fedele, 2015). UWB signals are used to
measure the distance between the target and the
device and the variations caused by the breathing
movement, (Abib, 2014), (Muller, 2015). An
advantage is that the power required to send a UWB
pulse is lower than other technologies (Muller, 2015).
In these papers, the method to detect sleep apnea is
through the detection of the breathing signal of the
patient. It is analyzed, and the sleep apnea is detected.
This process could be optimized in order to reduce the
time consumption of the process.
In this paper, a methodology to detect sleep apnea
is proposed using UWB signals without the need of
first obtaining the breathing signal. The rest of the
paper is divided as follows: Section II shows an
overview of the UWB technology to detect SA in
patients. Section III describes the proposed
methodology to detect sleep apnea. Section IV
presents the optimization of the proposal. Finally,
section V remarks some conclusions.
2 UWB TECHNOLOGY AND
BREATHING SIGNAL
The Federal Communications Commission (FCC) of
the United States of America (USA) defines UWB
technology as that employing devices that transmit
very short pulses that result in very wide transmission
bandwidths (Waters, 2009), (Pardiñas, 2017).
Typically, the largest pulse length considered as a
UWB pulse is on the order of nanoseconds. The
received energy signal is spread from close to dc to a
few GHz (Pardiñas, 2017). Another advantage of this
technology is that multipath effects can be
diminished, and it can penetrate through materials
such as walls, doors, and windows (Pardiñas, 2017).
When a signal is transmitted in an ideal
environment from point A to point B and is reflected
back to point A in a direct path without additional
reflections, it is called the direct path. The total
traveling time is known as time of flight T
R
. In a real
environment, the signal that arrives at point B is
composed of the direct path plus additional signals
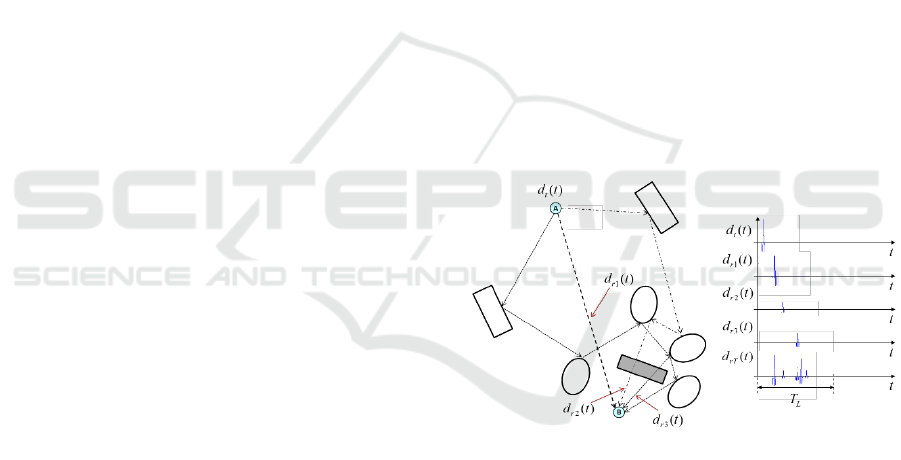
reflected from different objects, as seen in Figure 1,
traveling longer paths and lasting for more than T
R
⁄2
seconds.
Figure 1: Received signal constructed from reflections of
the original signal off of scatterers.
Figure 1 shows the way that the received signal,
d
rT
(t), is constructed from different reflected signals
or paths d
r1
(t), d
r2
(t), d
r3
(t), etc. In the case of a
transceiver acting as a radar, the signals at point B are
reflected and redirected to point A, where they are
collected. This kind of UWB radar can be used to
obtain a breathing signal of a person, as shown in
Figure 2.
The transceiver targets the person and sends one
pulse, recording the reflected signal, called a
realization, for T
L
seconds, ensuring that all paths
have arrived. Doing this very fast and as many times
as needed, a signal representing the breathing can be
obtained. Figure 3 shows the waveform of a UWB
WINSYS 2019 - 16th International Conference on Wireless Networks and Mobile Systems
362
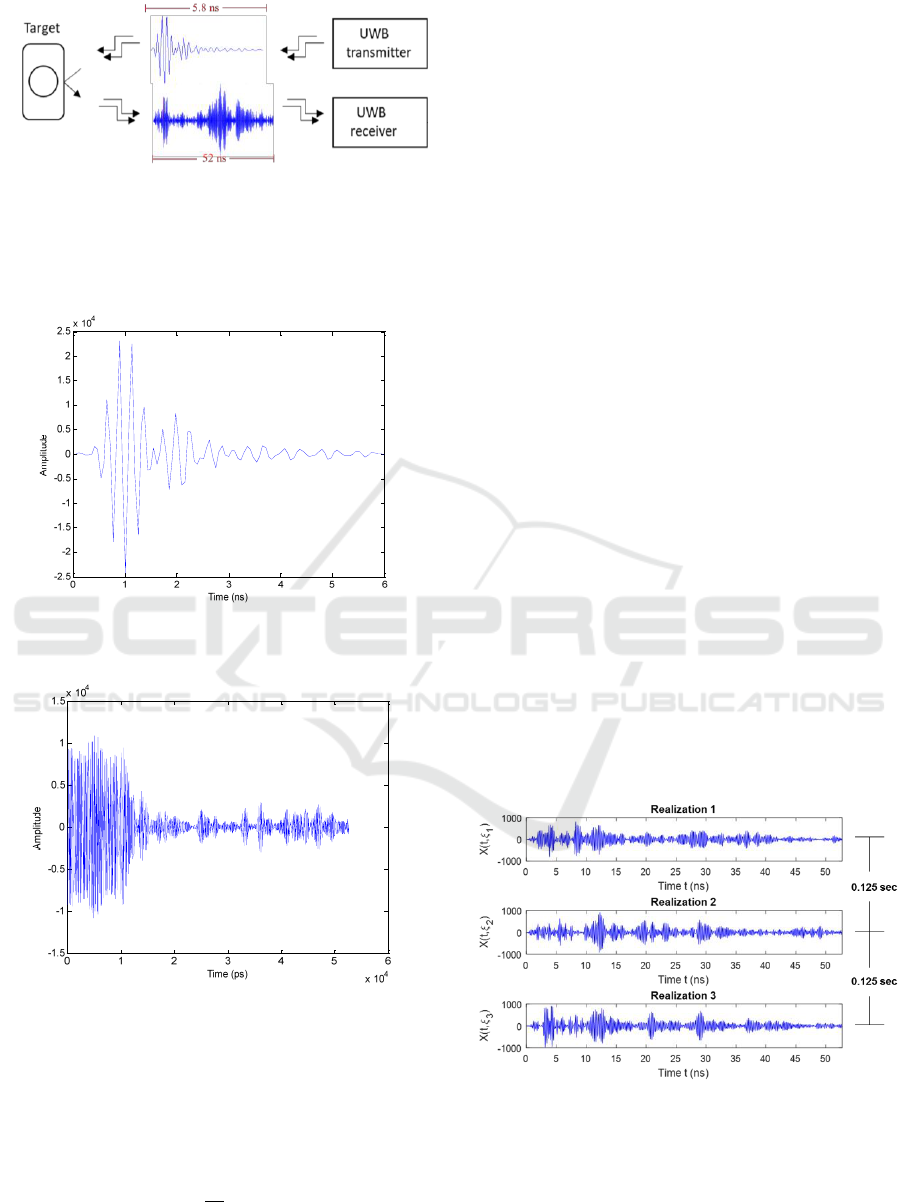
Figure 2: UWB system targeting a patient.
pulse transmitted and Figure 4 shows the received
signal, called realization, of around 52 nanoseconds
long.
Figure 3: The waveform of an UWB pulse produced by the
transmitter.
Figure 4: Waveform of a realization collected from a range
of 15.6 meters using the UWB device.
The time T
L
is dependent on the longest distance
to the object on which the signal is reflected. Hence,
T
L
corresponds to the time of flight of the longest
signal path, so the maximal distance d
max
that the
transceiver can detect is half of that time:
(1)
where V
p
is the velocity of propagation. For example,
a typical value of T
L
for the transceiver used during
the experiments presented in this document is 54 ns,
so the maximum distance at which a target can be
from the transmitter for being recorded is around 8
meters. As stated before, in order to detect the cycle
of the breathing signal of a person, it is necessary to
analyze the signals corresponding to several cycles of
breathing, which means a set of many realizations.
The aim is to identify, in those signals, the
information associated with the x axis value to the
time position that indicates where the target is
positioned. In order to standardize the identification
concept, this method will be called the target position.
The analysis of the target position is made through
all realizations. The normal breathing frequency of a
patient is approximately 12 times per minute, which
means that the patient inhales and exhales every 5
seconds. However, the breathing frequency could
change according to the patient and his status, where
the minimum breathing frequency to live for a short
time is 2 times per minute and the maximum is 40
times per minute (Guyton, 2011).
According to the sampling theorem, the minimum
sampling frequency must be at least twice the
frequency of the signal. In this case, the breathing
frequency is 0.2 Hz and the sampling frequency is
normally set to 8 Hz, which is the repetition
transmission frequency of the set of pulses produced
by the UWB system. One set usually consists of 20
realizations in order to detect one respiratory cycle of
around 5 seconds. Figure 5 illustrates three
realizations from a set, where the time between them
is 0.125 s.
Figure 5: Three realizations from a set of signals from the
UWB system.
Optimized Sleep Apnea Detector using UWB Signals
363
3 APNEA DETECTOR
PROPOSAL
The method presented in this section is based on a
UWB transceiver acquiring the reflected signals from
a human body.
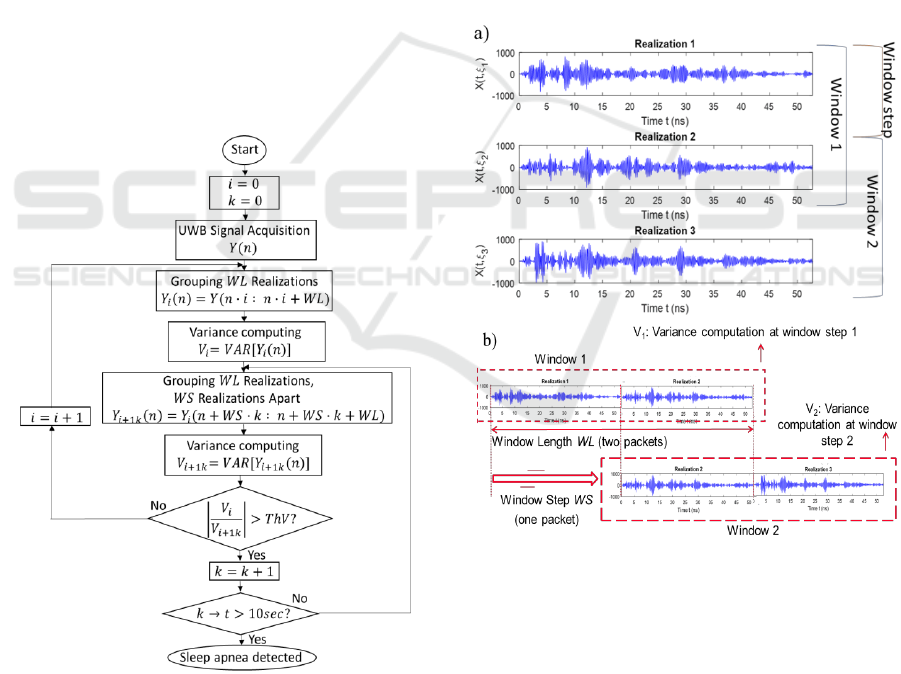
3.1 Detection Methodology
Instead of trying to identify the breathing cycle, the
received signals (realizations) are processed to detect
signal variations corresponding to a change of
breathing. This is made by computing its variance and
comparing the values from one realization to the next
one, no matter at what point in the signal this variation
occurs. While a person is breathing, the variance of
realizations does not change suddenly, but when the
person stops breathing, the variance has a big change,
signalling that apnea has occurred if it lasts for more
than 10 seconds. Note that the breathing frequency of
a patient is around 0.2 Hz or a breathing period of 5
seconds. The flowchart of this method is shown in
Figure 6.
Figure 6: Flowchart of sleep apnea detection using the
variance of realizations.
The variance of a signal, as used in this work,
provides a measure of the amplitude dispersion of the
signal with respect to its average in a determinate time
(Leon-Garcia, 2008), and is given by:
(2)
where m
x
(t) is the mean function of the random
process X(t), and f
x(t)
(x) is the probability density
function (PDF) of X(t).
For signal processing, a set Y
1
(n) consisting of a
certain number of realizations, WL, is grouped into a
“window” and its variance V
1
is calculated. A new
window Y
2
(n) is analyzed by grouping other WL
realizations located WS realizations apart from the
start of the previous window: Y
2
(n) = Y
1
(n+WS). Its
variance is V
2
. WS corresponds to the number of
realizations or window step where the new window is
defined. Construction of the grouping of realizations
and window step is illustrated in Figure 7.
Figure 7: Construction of realization windows and
definition of window step: a) Three consecutive
realizations. b) Windows shifting.
This procedure, computing the variance of shifted
windows, is executed continuously. The result is a
signal containing the amplitude of variances, as it is
shown in Figure 8.
In this figure, note that there is a time interval
when breathing ceased, and the amplitudes of the
variances decreased abruptly. A comparison between
consecutive variance amplitudes is also continuously
WINSYS 2019 - 16th International Conference on Wireless Networks and Mobile Systems
364
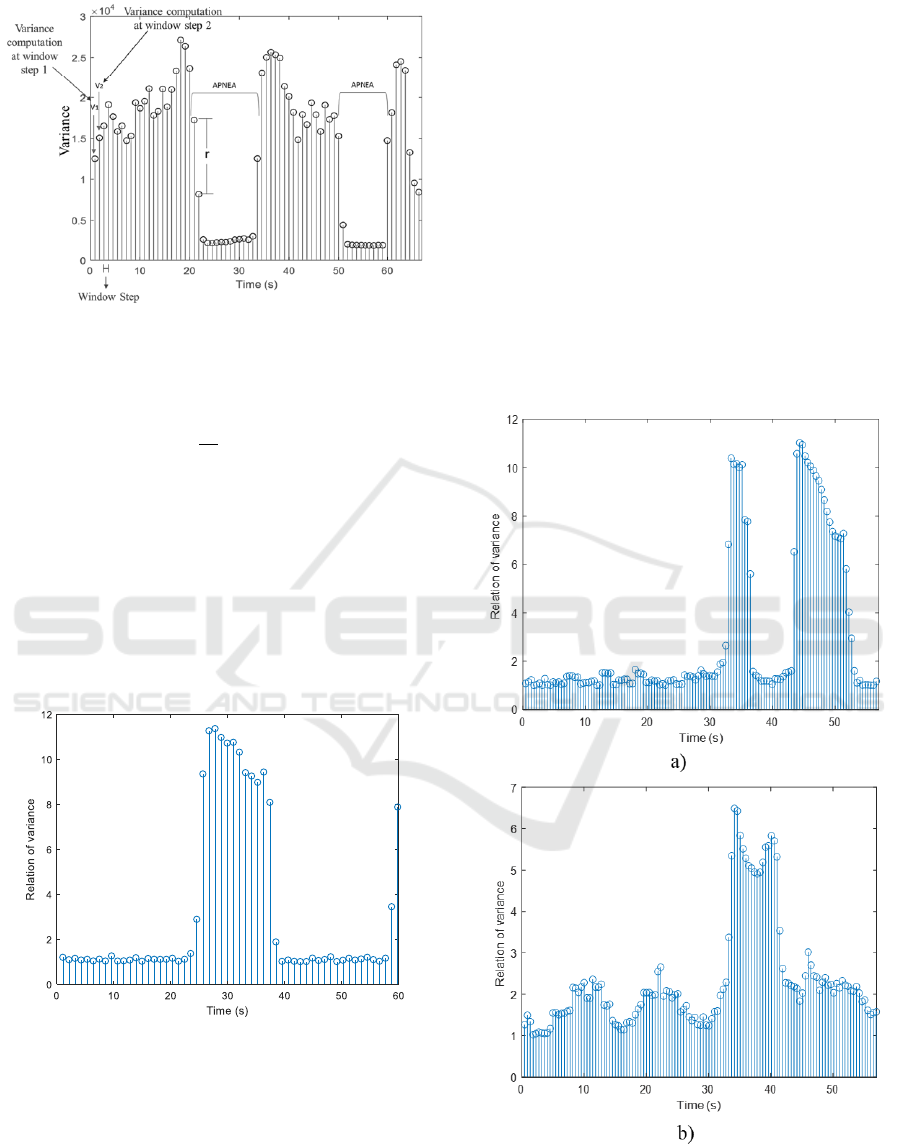
Figure 8: Elements of variance computation by windows.
computed, searching for this abrupt change by
calculating:
(3)
When the relation r between them is greater than
a threshold value ThV, this point of time is considered
as a potential start of apnea. Then, if the relation
between subsequent variance amplitudes and the one
at the start point is kept greater than the threshold
value for more than 10 [Guyton-11], [Servin-Aguilar-
18], apnea is declared. Computation of the relation
factor r for a signal lasting 60 seconds and apnea at
25 seconds is shown in Figure 9.
Figure 9: Relation of variance amplitudes with a sleep
apnea at 25 seconds.
Finally, when the relation r is lower than the
threshold, then the patient is breathing again. This
process is repeated until the complete signal is
analyzed.
3.2 Detection Results
In order to evaluate the performance of the algorithm,
we analysed signals corresponding to two
environments: a laboratory and a dormitory. We used
a UWB monostatic radar module (MRM) model 410
from PulsOn which works in a frequency band
between 3.1 and 4.8 GHz, transposing the UWB pulse
to a center frequency of 4.3 GHz. This device has two
antennas (Tx and Rx) in the same package. The UWB
transmitter sends a pulse of 5.6 nano-seconds every
0.125 seconds targeting directly the chest of a patient.
In a first experiment, the laboratory environment
is analysed. The distance between the patient and the
UWB transceiver is varied from 20 cm to 100 cm.
Some results are presented in Figure 10 for values of
comparison factor r.
Figure 10: Relation of variance amplitude for signals at
different distances between the UWB device and the
patient: a) 20 cm and b) 80 cm.
Optimized Sleep Apnea Detector using UWB Signals
365
Here, a threshold ThV of 5 is chosen. We correctly
detected apnea at distances of 20 cm, 60 cm, 80 cm,
and 100 cm. For distances greater than 100 cm, the
signal is not suitable for processing.
When the threshold value ThV is changed to 2,
sleep apnea is wrongly detected at 50 seconds. If
distance between the UWB device and the patient is
grater, then the threshold ThV must be lower to detect
sleep apneas, because the amplitude of variances are
lower.
In a second experiment, the signal processed
corresponded to a patient wearing two different
clothes: a shirt and a jacket. In order to illustrate the
results, we present in Figure 11 the relation of
variance amplitude at a distance of 60 cm from the
patient.
Figure 11: Relation of variance amplitudes for signals in
two scenarios: a) the patient is wearing a shirt, b) the patient
is wearing a jacket.
When the patient wears a shirt, a sleep apnea
occurring at 23 seconds is correctly detected using a
ThV equal to 10, while when the patient wears a
jacket, a sleep apnea at 42 seconds is correctly
detected with a threshold ThV equal to 3. The range
of values is different for each case, so the amplitudes
must be normalized to achieve a reliable threshold
regardless of, in this case, the type of clothing that the
patient uses.
In a third experiment, the signal to process is
acquired in a dormitory, where the patient is laying
down on his side in a bed. The UWB device is
directed toward to the chest of the patient. Two
scenarios are considered: the patient wearing a shirt
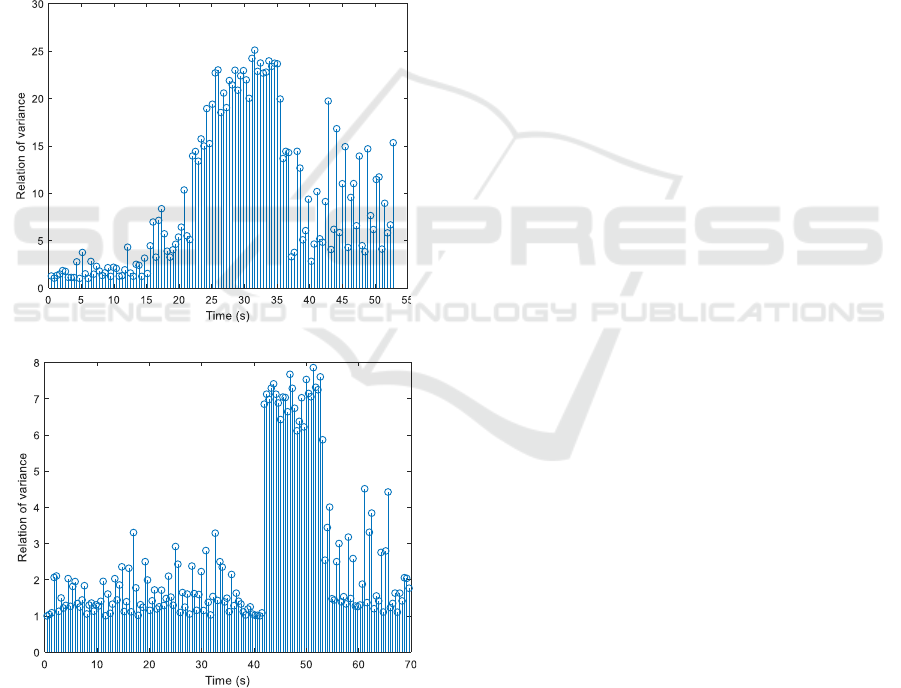
and the patient covered with a thick blanket. In this
case, an apnea present at 45 seconds for the patient
wearing a shirt is detected correctly, while for the
patient with a thick blanket, an apnea present at 47
seconds is correctly detected but another non-existent
is detected at 75 seconds. Once the proof of concept
of the method has been carried out, it is necessary to
optimize it to detect apnea with greater precision.
4 DETECTION OPTIMIZATION
In order to find the conditions with the best
performance of the proposed apnea detection method,
the main parameters involved in the computation are
changed in a series of executions of the algorithm.
The targeted parameters are the window length, WL,
the shift or step between consecutive windows, WS,
and the threshold value, ThV.
4.1 Optimization Methodology
The experiments, carried out with a UWB signal
corresponding to the chest movement of the patient,
have two main objectives. First, is to evaluate the
parameters that produce the best accuracy of the
apnea detection method. Second, is to identify the
parameters with shortest processing time.
The proposed optimization methodology
essentially consists of a parametric multidimensional
search based on actual physical measurements. Each
execution of the searching process begins with the
values of two parameters fixed, WL and WS, and the
threshold value varied. Once the whole process of
detection over the signal is carried out, a new
execution is run by fixing WL and WS to new values
and then varying ThV. The executions are repeated by
modifying the parameters until their ranges of
variation are covered. For each execution, the values
of the parameters, the number of detected apneas, and
the processing time are saved.
a)
b)
a)
b)
WINSYS 2019 - 16th International Conference on Wireless Networks and Mobile Systems
366

4.2 Optimization Results
The set of experiments are performed over five
signals presenting different characteristics. Each
signal corresponds to a series of around 750
realizations, lasting 94 seconds in total. As a
reference for the experiments, the average breathing
frequency of a patient is considered to be 0.2 Hz or 5
seconds. Parameter ranges considered are: for the
window length WL, from 4 realizations, which
represents 0.5 seconds, to 128 realizations,
corresponding to 16 seconds; for the window step
WS, from 1 realization to the maximum length of the
window; and for the threshold value ThV, from 1 to
10. This makes a total of 18,544 combinations of
parameters tested for each signal.
Table 1: Number of combinations of parameters that
produced correct detections.
Signal Characteristics
Number of
Correct
Detections
Number of
Apneas
Distance between the
UWB Transceiver and
the Patient (cm)
0
60
17,731
1
20
1,291
1
30
2
30
1
80
The difference between the signals used in the
experiments are the number of apneas and the
distance between the UWB transceiver and the
patient. Table 1 shows the characteristics of the
signals and the number of combinations of parameters
that presented a correct detection out of the 18,544
possible combinations. We analysed all the results for
each signal, and compared them in order to identify
the ranges of common values of combinations of
parameters that presented correct detections.
The first signal used had a length of 85.63 seconds
with zero apneas and a distance between the UWB
device and the patient of 60 cm. A total of 17,731
combinations correctly detected the absence of
apneas. The highest number of correct results were
produced for combinations of parameters that
comprise the following values: WL from 16 to 40
realizations, WS varying from 10 to 27, and ThV from
1.5 to 10.
The second signal used had a length of 81.3
seconds with one apnea and a distance of 20 cm. The
number of combinations that detected correctly the
apnea is 1,291. Table 2 shows, as an example, a subset
of the parameters with the highest number of correct
detections. It is seen that the range for the WL
parameter is from 8 to 40 realizations, the WS range
is from 8 to 19, and the value of ThV varies from 1 to
10.
The third signal had a length of 113.4 seconds. It
has one sleep apnea and an acquisition distance of 30
cm. The number of correct detections is 2,383
combinations. The subset of parameters with the
highest number of correct detections has a value
range of WL from 16 to 40, the WS range is from 11
to 15, and the ThV maximum range is from 1 to 10.
The fourth analyzed signal had a length of 89.5
seconds, with two apneas, and an acquisition distance
of 30 cm. The total number of combinations
producing correct detections is 1,564 (see Table 1). In
this experiment, the subset of parameter combinations
with the highest number of correct detections
corresponds to WL with a range from 16 to 40
realizations, WS from 9 to 17, and ThV with a
variation from 1.5 to 8.
Finally, the fifth signal had a length of 118.3
seconds, with one apnea, and an acquisition distance
of 80 cm. In this experiment, the total number of
correct detections is obtained from 866 combinations.
The range of WL is from 48 to 72 realizations, WS
varies from 8 to 40 realizations, and the ThV range is
from 1.5 to 6. In this case, it is found that the ranges
of parameters values stepped away from the group of
values obtained in the previous results.
The few coincident results of the fifth signal, in
comparison with the first four signals, show that the
distance has an important effect in the detection
algorithm. In addition, it is also observed that the
number of correct detections decreased by half. In this
case, we cannot define a range of parameters values
good enough for all tested signals. We conclude that
the signal tested at a distance of 80 cm is not suitable
for the proposed algorithm, since it makes the
algorithm unreliable.
Taking into account the results obtained for the
first four signals, we can determine an appropriate set
of reliable values, valid for all four signals. This set
comprises a WL equal to 24, a WS ranging from 12 to
15 realizations and a ThV range from 2 to 4.5. This
means that these selected values can be used for the
detection of apneas within the first four signals. On
the other hand, it can easily be found that, for a fixed
value of parameter WL, the minimum number of
operations to be computed is obtained when the value
of WS is the largest. We can then define that the WS
value to be used for all tested signals is 15. In
summary, we conclude that a set of values that allows
Optimized Sleep Apnea Detector using UWB Signals
367

the detection algorithm to have a good performance
with the least number of calculations, is a WL of 24,
a WS of 15 and a range ThV from 2 to 4.5.
Table 2: Detection results for several parameters using a
signal with one apnea, acquisition distance = 20 cm, and
length = 81.3 seconds.
PARAMETERS
WL
WS
ThV Range
8
8
16
8
16
9
16
10
16
11
24
12
24
13
24
14
24
15
24
16
32
13
32
14
32
15
32
16
32
17
40
15
40
16
40
17
40
18
40
19
5 CONCLUSIONS
An algorithm to detect sleep apnea using the relation
of the variance of signals obtained from a UWB
transceiver was presented in this paper. It was
demonstrated that the algorithm detects sleep apnea
with a maximum distance of 100 cm between the
UWB device and the patient. The experiments also
showed that the algorithm is able to detect sleep apnea
considering different scenarios, with some
limitations.
An optimization methodology to improve the
detection was also presented. The experimental
evaluation allowed the identification of the
combinations of parameters that produce the best
results and the smallest number of operations. The
parametric optimization of the algorithm showed that
the best detection results were achieved by using a
WL of 24 realizations, WS of 15 realizations, and a
ThV between 2 and 4.5. It was also found that the
detector was not accurate at a distance of 80 cm
between the UWB device and the patient.
ACKNOWLEDGEMENTS
This work was supported in part by CONACYT
(Consejo Nacional de Ciencia y Tecnología, Mexican
Government) through a scholarship granted to J. G.
Servin-Aguilar.
REFERENCES
World Health Organization (2014. Nov. 03), Chronic
diseases and health promotion. [Online]. Available:
http://www,who.int/chp/en
World Health Organization (2018. Jul. 30),
Noncommunicable diseases and their risk factors.
[Online]. Available: http://www.who.int/ncds/en.
World Health Organization (2015. Jan. 29), Datos
interesantes acerca del envejecimiento. [Online].
Available: http://www.who.int/ageing/about/facts/es/.
Hou, H., Xu, Y., Yan, H., Mubben, S., and H. Zhang, 2009.
An elderly health care system using wireless sensor
networks at home. In SENSORCOMM Conf. Glyfana,
Athens.
World Health Organization (2017, Mar. 10), Obstructive
sleep apnoea syndrome. [Online]. Available:
htttp://www.who.int/respiratory/other/Obstructive_sle
ep_aponea_syndrome/en.
Varady, P., Bongar, S., and Benyo, Z., 2003. Detection of
airway obstructions and sleep apnea by analyzing the
phase relation of respiration movement signals. In IEEE
transactions on Instrumentation and Measurement.
American Academy of Sleep Medicine (2017, Mar. 10),
New guideline for diagnostic testing for adult sleep
apnea. [Online]. Available:
http://www.aasmnet.org/articles.aspx?id=6792.
Guyton, A.C., and Hall, J. E., 2011. Tratado de Fisiología
Médica, doceava edición, México: Elsevier Sauders.
MedlinePlus (2017, Mar. 10), Sleep Apnea. [Online].
Available: https://medlineplus.gov/sleepapena.html.
Waters, J. R., and LaCourse, J.R., 2009. Unconstrained and
non-invasive respiration monitoring for obstructive
sleep apnea prevention. In 2009 IEEE 35
th
Annual
Northeast Bioengineering Conference, Boston, MA.
WINSYS 2019 - 16th International Conference on Wireless Networks and Mobile Systems
368

Lai Eason, J. C. Y., Xu, Y., Gunawan, E., Chua, E. C-P,
Maskooki, A., Guan, Y. L., Low, K-S., Soh, C. B., and
Poh, C-L, 2011. Wireless Sensing of Human
Respiratory Parameters by Low-Power Ultrawideband
Impulse Radio Radar. In IEEE Transactions on
Instrumentation and Measurement.
Fedele, G., Pittella, E., Pisa, S., Cavagnaro, M., Canali, R.,
and Biagi, M., 2015. Sleep-Apnea detection with UWB
Active Sensors. In 2015 IEEE International Conference
on Ubiquitous Wireless Broadband (ICUWB),
Montreal, Canada.
Abib, G. I., Muller, M., Seoane-Gomez, C., and Fernandez-
Sepulveda, P., 2014. Ultra-Wideband Radar system for
range measurement. In 2014 IEEE International
Conference on Ultra-WideBand (ICUWB), Paris,
France.
Muller, M., and Abib, G. I., 2015. Ultra WideBand Radar
system for human chest displacement. In 2015 IEEE
13
th
International New Circuits and Systems
Conference (NEWCAS), Grenoble, France.
Pardiñas-Mir, J. A., 2012. Contribution à l’etude de la
detection des signaux UWB. Etude et implementation
d’un récepteur ad hoc multicapteurs. Applications
indoor de localisation, These de Doctorat, EDITE de
Paris, Paris, France.
Taylor, J. D., Ultra-Wideband Radar Technology, 2000.
US: CRC Press.
Leon-Garcia, A., 2008. Probability, Staticstics, and
Random Process for Electrical Engineering, Third
Edition, US: Pearson Prentice-Hall.
Servin-Aguilar, J. G., Muller, M., Abib, G. I., Pardiñas-Mir,
J. A., and Rizo-Dominguez, L., 2018. System to Detect
Sleep Apnea Syndrome Using the Signal Similarity. In
Int. Conf. Electrical, Electronics, Computers,
Communication, Mechanical, and Computing
(ECCMC), Tamil Nadu, India.
Optimized Sleep Apnea Detector using UWB Signals
369
