
Characterization of the Bias Current Behavior in a SOA for
Linearizing Amplification in a CO-OFDM System
Julio C. Ortiz-Cornejo
1
and Jorge A. Pardiñas-Mir
2 a
1
Technological University of Jalisco, Guadalajara, Mexico
2
Department of Electronics, Systems and Informatics, ITESO University, Tlaquepaque, Mexico
Keywords: CO-OFDM, Semiconductor Optical Amplifier, Bias Current, Linearization, Error Vector Magnitude.
Abstract: This paper presents an analysis of the semiconductor optical amplifier (SOA) on coherent optical orthogonal
frequency division multiplexing system (CO-OFDM), when it is used as a booster power amplifier. The
semiconductor optical amplifier is driven by their bias current injection, which control the amplification level.
In this sense, this study analyses the impact of bias current change on a SOA based CO-OFDM system. It is
well known that SOA is prone to nonlinear distortion when high input power is used at high gain level, because
the gain saturation. In addition to the aforementioned analysis, here it is also presented three operation
scenarios to characterize the performance of the system: maximum EVM equal to 20%, constant output power
equal to -7 dBm, and constant SOA Gain equal to 17 dB. This let us obtain a way to optimize the SOA
performance, under each scenario, controlling the bias current.
1 INTRODUCTION
Amplification process is a crucial step in the coherent
optical orthogonal frequency division multiplexing
(CO-OFDM) systems. Given the inherent nature of
the CO-OFDM signal to generate high peaks of
signal, it condition could drive the optical amplifier to
gain saturation, and signal distortion at the receiver
(Rahmatallah, 2013). Because of it, the optical
amplifiers are one of the key components in the CO-
OFDM systems (Khaleghi, 2013). Recently the
semiconductor optical amplifiers (SOA) has been
extensible studied as a good candidate in CO-OFDM
systems, due to the cost-effective characteristics
(Azou, 2015), (Renaudier, 2019). However, SOA still
have some points to solve, for instance, SOA can
exhibit nonlinear behavior when it operates in
saturation region. These nonlinearities can cause
problems such as frequency chirping and generation
of inter-modulation products (Bendimerad, 2017).
One way to avoid these undesirable effects is to
regulate dynamically the bias current (I
bias
) to control
de SOA amplification, in order to avoid SOA gain
saturation.
The principal application of SOA can be divided
in three main functions: power booster of transmitter,
a
https://orcid.org/0000-0002-0972-3980
in line amplifiers, and optical preamplifier. The
booster amplifiers are placed at the optical transmitter
side to enhance the transmitted power level or to
compensate for the losses of optical elements between
the laser and optical fibers, such as optical couplers,
and external optical modulators. In-line amplifiers are
placed along the transmission link to compensate the
losses incurred during propagation of optical signal.
Optical preamplifiers are used to increase the signal
level before photo-detection occurs, improving the
receiver sensitivity (Shieh, 2010).
This study aims to analyze the impact of bias
current change in the SOA behaivor, used as a booster
for a back-to-back CO-OFDM transmission. To
achieve this goal, we use a simulation system based
on Matlab for digital signal processing of modulation-
demodulation, and ADS for the SOA model
simulation. This simulator has been used before in
(Khaleghi, 2013), (Younes, 2017) showing good
consistence between simulation and experimental
results.
The rest of this report is organized as follows.
Section II presents the simulation results given by the
bias current change on SOA based CO-OFDM system
for a wide range of input power (P
in
) levels. In Section
III we go into the analysis of bias current functions to
Ortiz-Cornejo, J. and Pardiñas-Mir, J.
Characterization of the Bias Current Behavior in a SOA for Linearizing Amplification in a CO-OFDM System.
DOI: 10.5220/0007931502430248
In Proceedings of the 16th International Joint Conference on e-Business and Telecommunications (ICETE 2019), pages 243-248
ISBN: 978-989-758-378-0
Copyright
c
2019 by SCITEPRESS – Science and Technology Publications, Lda. All rights reserved
243
control the EVM, output power (P
out
) or optical gain
(Gain), also we analyzed the benefits and
disadvantages of these three approaches. Section IV
gives the conclusions of this study.
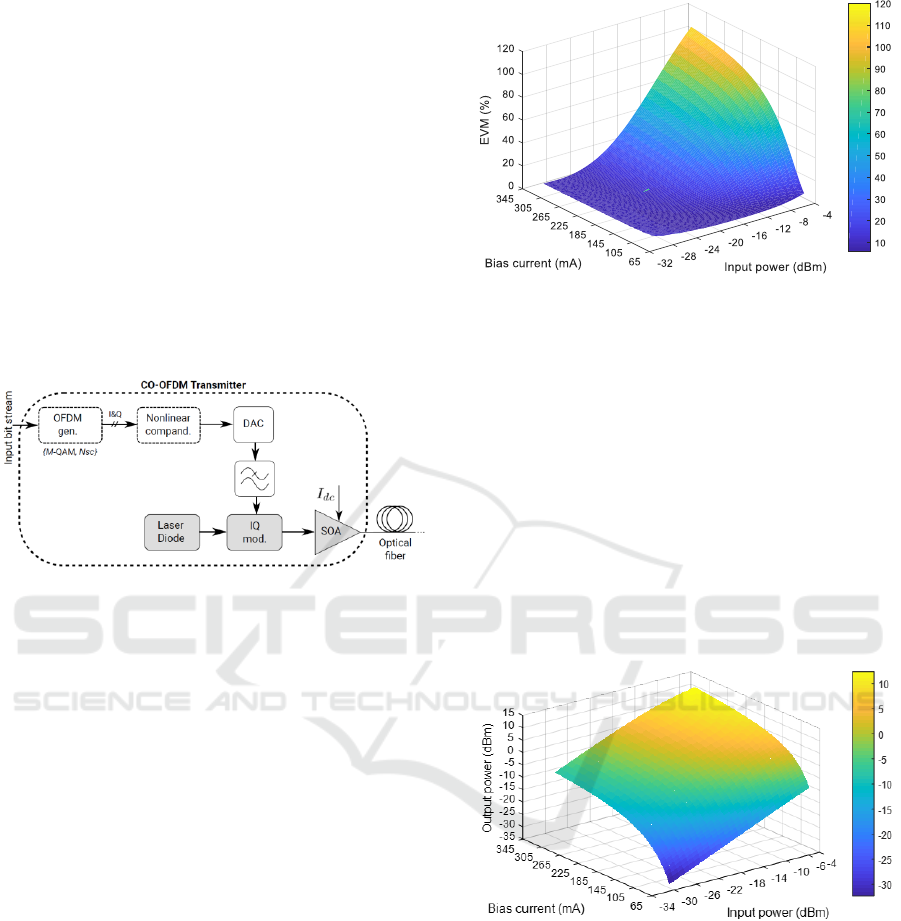
2 BIAS CURRENT CHANGE IN
SOA
As mentioned before, we simulate a back to back CO-
OFDM transmission, using the SOA as a booster
amplifier, as seen in Figure 1. The system was
simulated with 128 subcarriers, 4 QAM baseband
modulation, electrical bandwidth of 5 GHz, and an
oversampling factor os = 4.
Figure 1: A SOA as a booster amplifier in a CO-OFDM
transmitter.
The objective of the simulation is to characterize
the impact of the SOA bias current I
bias
on three main
aspects of its behaviour as amplifier within a CO-
OFDM system: gain (G), output power (P
out
), and
error vector magnitude, (EVM). All this under
different conditions of the input power P
in
. To achieve
this goal, we measured the aforementioned variables
for a range of different input powers, from -31 dBm
to -6 dBm, in steps of 1 dBm. For each test point, we
variates the bias current from 65 mA to 315 mA in
intervals of 1 mA. This gives a total of 6526 tests.
These values have been chosen in order to include the
linear and nonlinear SOA operation.
2.1 EVM Function of P
in
and I
bias
First, we run simulations to obtain the behavior of the
EVM for variations of the bias current and the input
power. Figure 1 shows graphically the results. Here
we can observe that the way EVM changes when the
input power and the bias current increase. The EVM
rises rapidly for high values of I
bias
and P
in
. For
example, the system can get up to 40 % EVM for a
P
in
equal to -16 dBm for values of I
bias
of 345 mA.
Figure 2: EVM function of P
in
and I
bias
in CO-OFDM
system with SOA as booster amplifier.
2.2 P
out
Function of P
in
and I
bias
The simulations for obtaining the behaivor of the
output power, related to variations of the bias current
and the input power, produced the results shown in
Figure 2. As already known (Saleh, 1988), the output
power level of the amplifier, for a specific input
power value, can be controlled by selecting the right
bias current. As a reference, for an input power of -16
the amplifier can produced around 5 dBm at its output
for a EVM of 40% when using a I
bias
of 345 mA. Both
figures allow us to have a broad view of the behavior
of the amplifier for different conditions.
Figure 3: SOA output power function of P
in
and I
bias
.
2.3 Gain Function of P
in
and I
bias
Figure 3 illustrates the behaviour of the amplifier’s
gain. We can clearly see the direct dependence of the
gain of the amplifier with respect to the current. Here,
the maximum gain is obtained for low input powers.
For example, the amplifier’s gain is 22 dB for an input
power of -28 dBm. On the contrary, there is a
reduction of the gain for high input powers.
Figure 5 shows the gain curves versus bias current
and input power with more detail. It is clearer
OPTICS 2019 - 10th International Conference on Optical Communication Systems
244
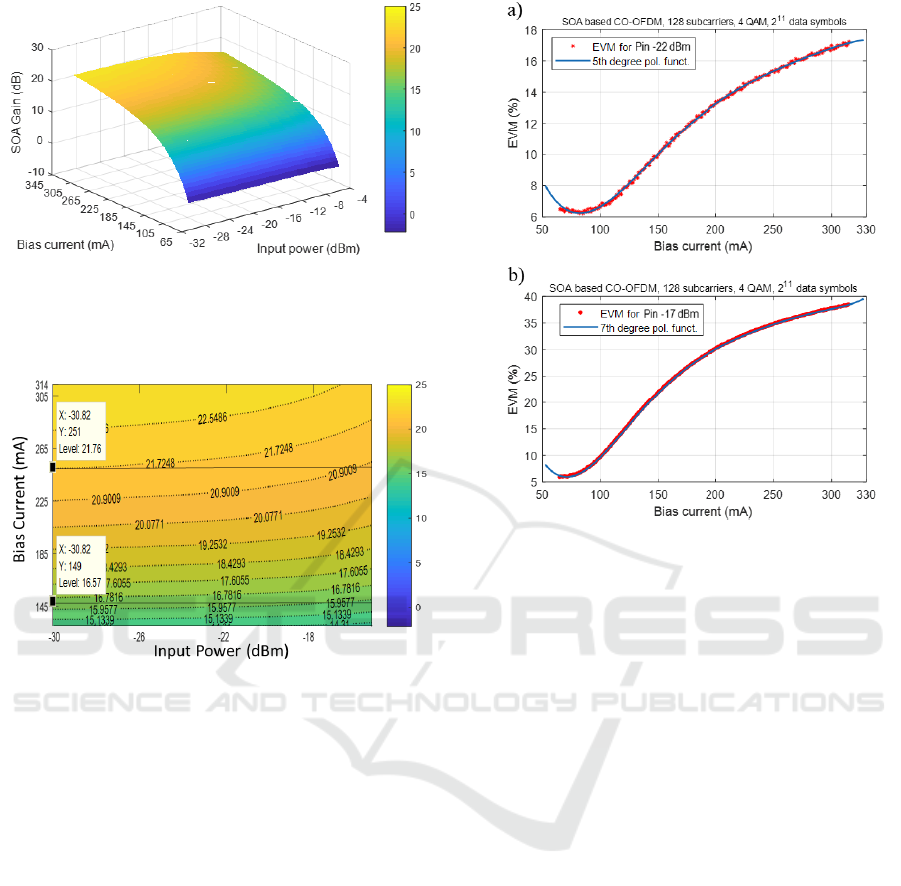
Figure 4: SOA Gain function of P
in
and I
bias
.
observed the gain reduction as the input power
increases for a constant bias current.
Figure 5: Detail of SOA Gain function of P
in
and I
bias
.
2.4 Bias Current for Minimum EVM
We are interested in characterizing the behaivor of the
SOA under certain conditions. One condition is to
obtain the minimum possible EVM regardless of the
value of the input power. We want to know what
current to use to achieve this.
We can get a model from each result of the EVM
obtained in subsection 2.1 for each input power value.
As an example, Figure 6 shows the curves of the
EVM function the bias current for two different input
powers: -22 dBm and -17 dBm. Using a MATLAB
fitting function we obtain the polynomials described
in equations (1), for -22 dBm,, and (2), for -17 dBm.
Figure 6: EVM function of P
in
and I
bias
for two different
input powers.
The next step to obtain a model for all input
powers, is to search the minimum EVM of each
single-variable polynomial function by using a
constrained variable I
bias
as follows:
mAImAIEVM
biasbias
I
bias
31565)(minarg
(3)
We applied linear regression to obtain the model
described by equation (4). This equation shows what
is the bias current needed to obtain the minimum
EVM for a given input power. The curve of such a
function is illustrated in Figure 7.
(4)
We run a test in the simulator of the CO-OFDM
system using the previous function. We introduced a
signal with different input powers, for each power we
used a different bias current, calculated with the
equation (4) and we computed the EVM of the
received signal. Figure 8 shows the results (variable
bias) comparing it with those obtained with a fixed
current. In this case value of the current is 150 mA.
The observation of parallel results of the
simulations let us find that the cost of minimizing the
(1)
(2)
Characterization of the Bias Current Behavior in a SOA for Linearizing Amplification in a CO-OFDM System
245
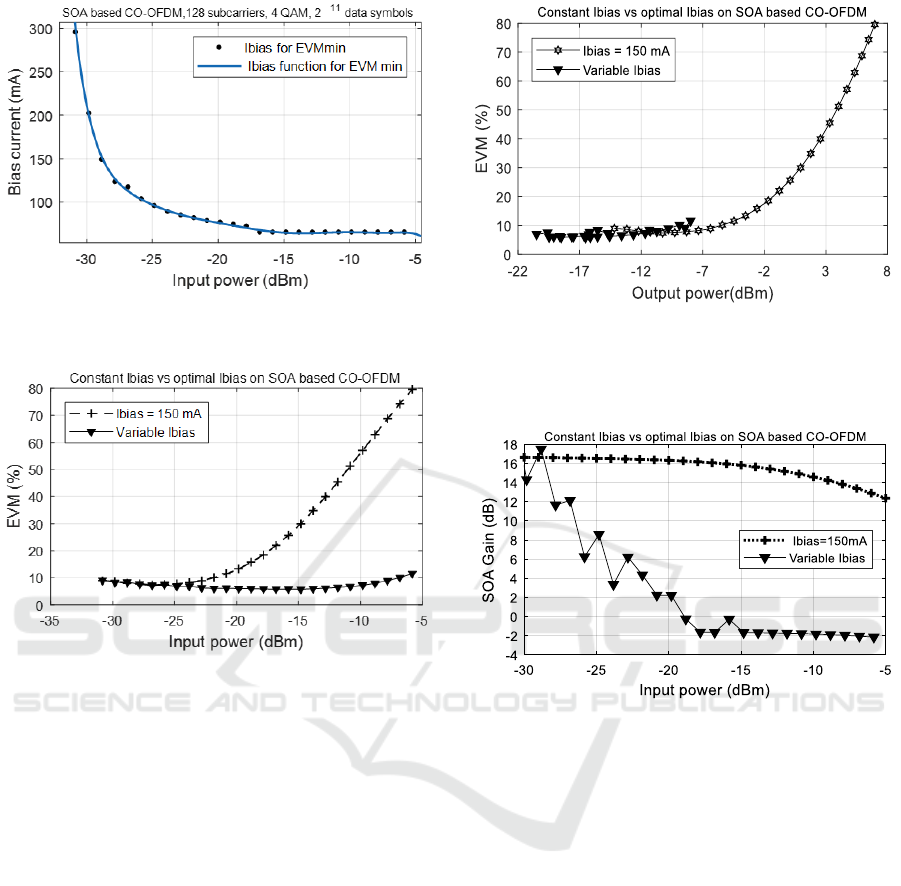
Figure 7: Bias current function of P
in
and I
bias
to obtain the
minimum EVM.
Figure 8: EVM function of P
in
applying bias current
corresponding to each power level to obtain minimum
error.
error is forcing a decrease in output power, originated
by decreasing the gain. This is expected, since the
decrease in current decreases the gain of the
amplifier. Both behaviors are shown in Figure 9 and
Figure 10. This model allows us to know exactly how
the amplifier behaves controlling the current to
achieve the smallest EVM depending the input
power.
The search of minimal EVM by controlling I
bias
drives the SOA to a Gain depletion and Pout
attenuation. In such a case, a good profile of bias to
get a sufficient gain with a certain acceptable level of
distortion at the receiver (EVM) is needed.
Figure 9: Output power response when bias current change
for minimum EVM and Pout curve when bias current is
constant 150 mA, It drives CO-OFDM system to a
amplification fail above Pin = -18 dBm.
Figure 10: EVM function of P
out
applying bias current
corresponding to each power level to obtain minimum
error.
3 IMPACT OF BIAS CURRENT
ON SOA PERFORMANCE
From the previous results, it is clear that it is
necessary to find a good trade-off between EVM and
P
out
to have a good operational level in amplification
terms. Therefore, we propose three different profile
behaivors to analyse the impact of the bias current on
the SOA.
The first profile is obtained under the condition of
keeping the EVM at a maximum of 20%. The second
profile consists in preserving a constant P
out
equal to
-7 dBm. The third scenario to investigate is for a
constant SOA Gain of 17 dB over the whole P
in
range
analysed previously. We search in the results
obtained in the previous section: EVM, P
out
and Gain
function of I
bias
and P
in
, for the values of I
bias
, for each
value of P
in
, that fits the conditions of each of the
OPTICS 2019 - 10th International Conference on Optical Communication Systems
246
aforementioned profiles. From these values, we
estimate a linear regression to get I
bias
functions
depending of P
in
, to control de SOA amplification
according to one of the three desired profiles. This
can allow, for example, automating the envelope-
tracking scheme proposed in (Ortiz, 2017).
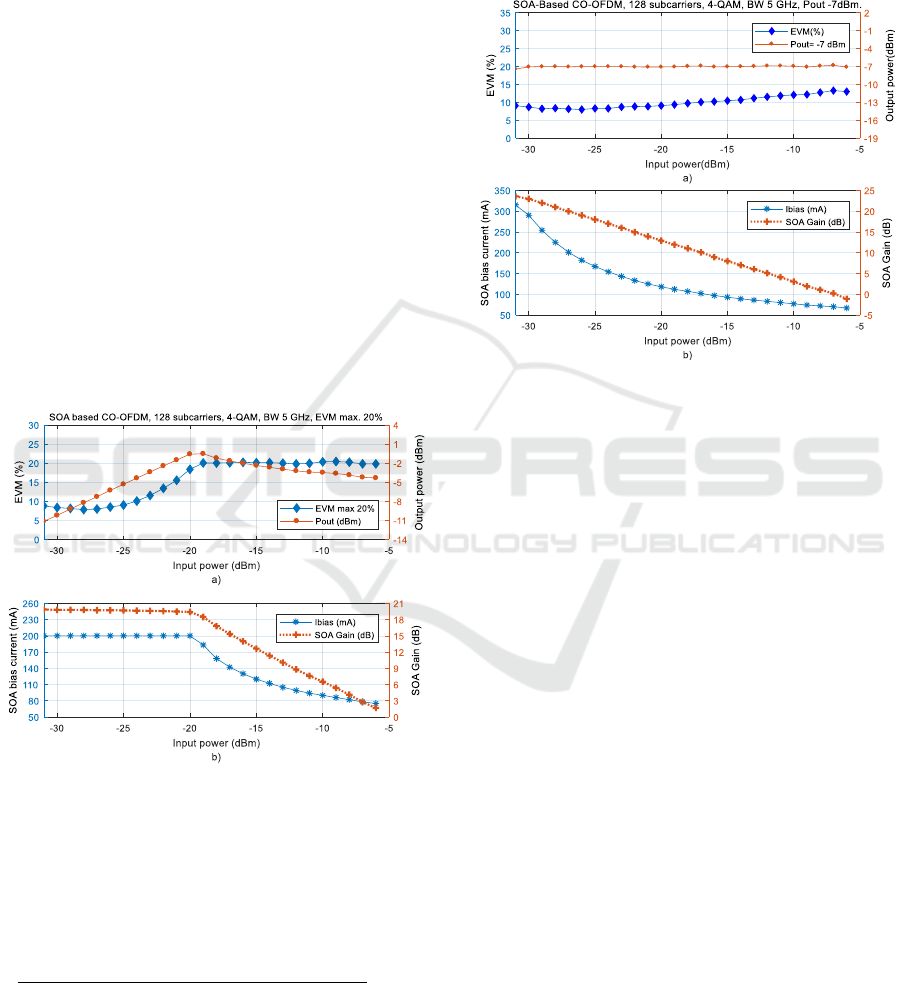
3.1 Maximum EVM Equal to 20%
According to the results shown in Figure 2 for EVM
function of I
bias
and P
in
, we observe that EVM is
relatively low, EVM < 20 %, for the linear region P
in
< -19 dBm, so we define an I
bias
equal to 200 mA to
obtain a SOA Gain of 20 dB with low EVM. On the
other hand, for high input power, P
in
> -19 dBm,
which is the SOA nonlinear region, we define an
EVM threshold of 20%, gradually decreasing I
bias
to
keep the EVM equal to 20% for -19 < P
in
< -6. The
results are shown in Figure 11. Here, we observe that
Pout decreases as a consequence of I
bias
reduction.
Also we can observe the SOA Gain attenuation in
accordance with the I
bias
decrease. Moreover, SOA
Gain has a linear decrease, and I
bias
has a nonlinear
decrease.
Figure 11: EVM and bias current for a maximum EVM of
20% at different input powers.
We compute from the Ibias current points a linear
regression to get an Ibias model. Since the complexity
of the Ibias behavior, we use a rational model, which
is a polynomial over a polynomial:
(5)
3.2 P
out
Equal to -7 dBm
We search into the results for P
out
, function of I
bias
and P
in
, the bias current values to get P
out
equal to -7
dBm all along the P
in
range (from -31 dBm to -6
dBm). The results are shown in Figure 12.
Figure 12: EVM and bias current for a constant P
out
equal
to -7 dBm.
We can see that EVM has values below 15%, even
in high P
in
values. It shows a quasi-linear response. In
addition, SOA gain has a linear decrement, this effect
reduces SOA gain saturation and, therefore, EVM is
low. This condition could be a drawback in the case
where we need to have a high gain for a P
in
above -19
dBm.
The I
bias
behavior is modeled by a 4th degree
polynomial as shown as follows:
(6)
3.3 Constant SOA Gain of 17 dB
In this scenario, we search in the results for Gain,
function of Ibias and Pin, obtained in subsection 2.3,
the Ibias values needed to keep a SOA gain equal to
15 dB. These values are shown in Figure 10.
This profile shows a clear inconvenient when the
P
in
is higher than -20 dBm: the EVM increases
exponentially. This is due to the distortion caused by
the amplifier at such ouptut region. We can observe
also that the SOA gain has an inverse behavior
compared to P
out
in the second profile.
Characterization of the Bias Current Behavior in a SOA for Linearizing Amplification in a CO-OFDM System
247
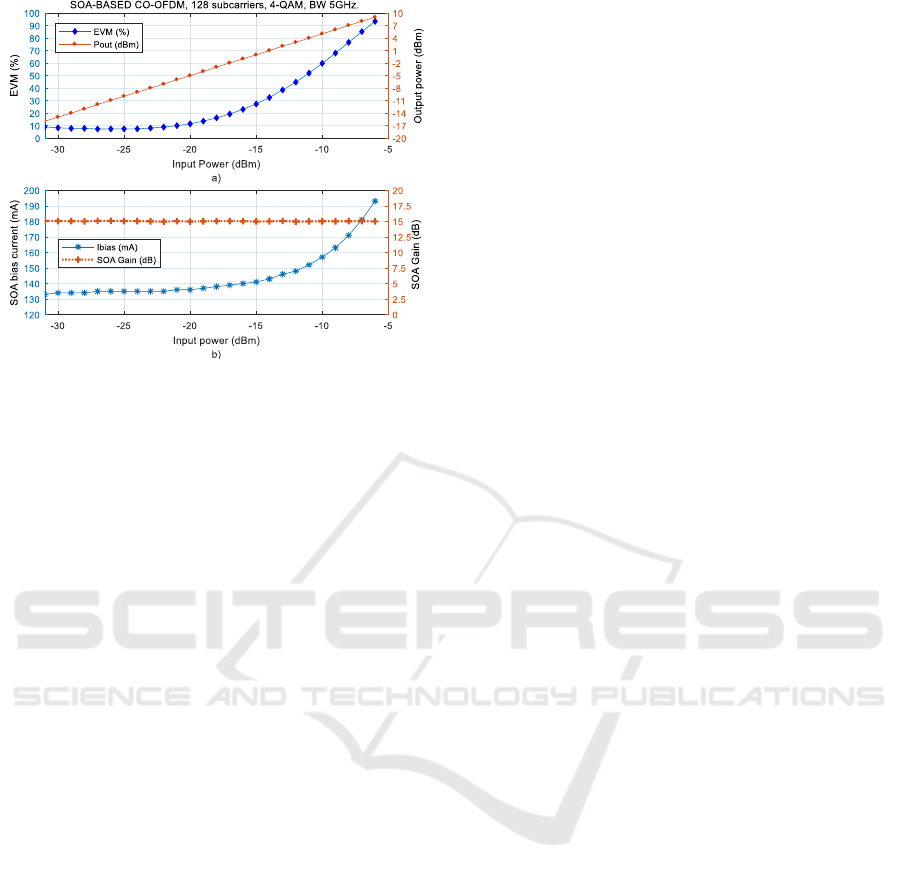
Figure 13: EVM and bias current for a constant SOA gain
of 15 dB.
These results can be modelled by a 6th degree
polynomial function:
(7)
4 CONCLUSIONS
The characterization of a SOA used as a booster
amplifier in a CO-OFDM system has been presented.
We investigated the way the bias current and the input
power affects the SOA performance in terms of EVM,
output power, and Gain. We demonstrated that a
trade-off to obtain a good behaivor is needed,
depending three different scenarios of operating
conditions. We analysed the performance profile and
developed a formula to compute the bias current
values that fits to each of three scenarios: maximum
EVM equal to 20%, constant output power equal to -
7 dBm, and constant SOA Gain equal to 17 dB. These
formulas would allow to dynamically controlling the
bias current to obtain the best results within each
operating scenario.
ACKNOWLEDGEMENTS
This work was supported in part by CONACYT
(Consejo Nacional de Ciencia y Tecnología, Mexican
Government) through a scholarship granted to J. C.
Ortiz-Cornejo.
REFERENCES
Rahmatallah, Y., and Mohan, S., 2013. Peak-to-average
power ratio reduction in OFDM systems: a survey and
taxonomy. In Commun. Surveys Tuts., vol. 15, no. 4, pp.
1567-1592.
Khaleghi, H., Morel, P., Sharaiha, A., and Rampone, T.,
2013. Experimental validation of numerical simulations
and performance analysis of a coherent optical-OFDM
transmission system employing a semiconductor
optical amplifier. In J. Lightw. Technol.
Azou, S., Bejan, S., Morel, P., and Sharaiha, A., 2015.
Performance improvement of a SOA-based coherent
optical-OFDM transmission system via nonlinear
companding transforms. In Optics Communications.
Renaudier, J., and A. Ghazisaeidi, A., 2019. Scaling
Capacity Growth of Fiber-Optic Transmission Systems
Using 100 + nm Ultra-Wideband Semiconductor
Optical Amplifiers. In J. Lightw. Technol., vol. 37, no.
8, pp. 1831-1838.
Bendimerad, D. F., Frignac, Y., 2017. Numerical
investigation of SOA nonlinear impairments for
coherent transmission systems based on SOA
amplification. In IEEE/OSA J. Lightwave Technol., 35
(24), pp. 5286-5295.
Shieh, W., and Djordjevic, I., 2010. OFDM for Optical
Communications. London, UK: Elsevier.
Younes, M., Telescu, M., Tanguy, N., Diouf, C., Morel, P.,
and Azou, S., 2017. Robustness improvement of
compact predistorters in a CO-OFDM system using
semiconductor optical amplifiers. In 29th International
Conference on Microelectronics (ICM), Beirut.
Saleh, A. A.M., Jopson, R. M., and Darcie, T. E., 1988.
Compensation of nonlinearity in semiconductor optical
amplifiers. In Electron. Lett., vol. 24, pp. 950-952.
J. C. Ortiz-Cornejo, S. Bejan, S. Azou, J. A. Pardiñas-Mir
and P. Morel, 2017. On envelope-tracking for SOA
amplification of multicarrier signals. In 2017 IEEE
International Symposium on Circuits and Systems
(ISCAS), Baltimore, MD, pp. 1-4.
OPTICS 2019 - 10th International Conference on Optical Communication Systems
248
