
Analysis, Simulation and Control of a New Measles Epidemic Model
Paolo Di Giamberardino and Daniela Iacoviello
Dept. Computer, Control and Management Engineering Antonio Ruberti, Sapienza University of Rome,
via Ariosto 25, 00185 Rome, Italy
Keywords:
Epidemic Modeling, System Analysis, Optimal Control.
Abstract:
In this paper the problem of modeling and controlling the measles epidemic spread is faced. A new model
is proposed and analysed; besides the categories usually considered in measles modeling, the susceptible,
the exposed, the infected, the removed and, less frequently, the quarantine individuals, two new categories
are herein introduced: the immunosuppressed subjects, that can not be vaccinated, and the patients with an
additional complication, not risky by itself but dangerous if caught togeter with the measles. These two
novelties are taken into account in designing and scheduling suitably control actions such as vaccination,
whenever possible, prevention, quarantine and treatment, when limited resources are available. An analysis of
the model is developed and the optimal control strategies are compared with other not optimized actions. By
using the Pontryagin principle, it is shown the prevailing role of the vaccination in guaranteeing the protection
to immunosuppressed individuals, as well as the importance of a prompt response of the society when an
epidemic spread occurs, such as the quarantine intervention.
1 INTRODUCTION
Despite a vaccination of the measles exists since
1963, it is still an important cause of death, espe-
cially among young children. The measles is caused
by a virus that infects the respiratory tract and then
spreads all over the body; it is highly contagious: it
is transmitted by infected patients through droplets
from nose, mouth and throat. After about 10 days
from the infection the main symptoms are high fever,
bloodshot eyes and tiny white spots inside the mouth;
then, a rash spread all over the body, starting from the
face. Generally, for good healthy people, the measles
does not represents a serious illness; it becomes risky
if the infected subjects is a poorly nourished chil-
dren (age less than 5 years old) with insufficient vi-
tamin A or subjects with the immune system weak-
ened by chemotherapy, or HIV/AIDS or other dis-
eases. In these cases complications may lead to death;
the most commons are: diarrhoea (about 70% of the
hospitalized persons with measles in the US), pneu-
monia (more than 9% among children with less than 5
years old) and other respiratory infections (more than
50% among hospitalized children with measles), en-
cephalitis (mainly occurring in patients with HIV in-
fection or leukaemia, ocular complications (R.T.Perry
and N.A.Halset, 2004).
Mathematical modeling of epidemic diseases al-
lows to describe and analyse epidemic diseases,
(Nowzari et al., 2016), (Nowak and May, 2000),
(Pinto and Rocha, 2012), (Naresh et al., 2009),
(Di Giamberardino et al., 2018),(Kuniya and Nakata,
2012), (TW et al., 2003). The availability of suitable
model allows to determine the most effective control
strategy and resources allocation, (Di Giamberardino
and Iacoviello, 2018a), (X.Yan and Y.Zou, 2008),
(Di Giamberardino and Iacoviello, 2017), (Ledzewicz
and Schattler, 2011), (Iacoviello and Stasio, 2013).
The most common models for the measles uses the
SEIR representation, where S stands for the Suscep-
tible individuals, that are the healthy people; E rep-
resents the compartment of the Exposed, that are the
subjects infected but not yet infectious; I is the com-
partment of infected and infectious patients; R con-
tains the subjects Recovered, including the individu-
als that have got the immunity by vaccination or hav-
ing got the measles previously, (A.A.Momoh et al.,
2013), (L.Pang et al., 2015), (O.O.Onyejekwe and
E.Z.Kebede, 2015). Sometimes also the class of
isolated subjects is introduced, (S.O.Adewale et al.,
2016), that is the class Q of subjects induced to iso-
lation to avoid new infections; in this framework it is
shown the existence of a unique endemic equilibrium
point as well as the most efficiency of the vaccina-
550
Di Giamberardino, P. and Iacoviello, D.
Analysis, Simulation and Control of a New Measles Epidemic Model.
DOI: 10.5220/0007934405500559
In Proceedings of the 16th International Conference on Informatics in Control, Automation and Robotics (ICINCO 2019), pages 550-559
ISBN: 978-989-758-380-3
Copyright
c
2019 by SCITEPRESS – Science and Technology Publications, Lda. All rights reserved

tion control strategy with respect to the treatment and
the campaign aiming at educating the society to man-
age the measles infection. Another interesting im-
provement of the classical SEIR model is proposed
in (S.Verguet et al., 2015) where the Exposed individ-
uals are not considered, stressing the subjects vacci-
nated susceptible, vaccinated infected and vaccinated
recovered, taking into account the risks of measles
infection also for vaccinated subjects. An interest-
ing study that takes into account the life histories of
interacting individuals is proposed in (E.A.J.Fischer
et al., 2008), where a general approach that could
be applied also to the measles disease is discussed;
it is based on microsimulation models, considering
birth, death and general demographic events. The
possibility of taking into account the complications
is considered in (Di Giamberardino and Iacoviello,
2018b), where a general infectious disease (not nec-
essarily the measles) is considered, and suitable con-
trol strategies for an efficient resources allocation are
proposed. In this paper, it is stressed that some sub-
jects in the population could not be vaccinated, for
example the immunosuppressed people; moreover it
is considered that the patients infected by the measles
are particularly exposed to complications, dangerous
for weak people and/or young children. The model in-
troduced takes into account the different peculiarities
in a susceptible population: two categories of suscep-
tible subjects are introduced, distinguishing among
healthy individuals that can or cannot be vaccinated.
Then, it is included the classical categories of Ex-
posed; as in (S.O.Adewale et al., 2016), it is consid-
ered the category of isolated subjects Q. The category
of Infected patients is split in order to consider the
subjects infected by the infectious disease and those
that have caught also the complication. Finally there
is the class of Removed people. The possible control
strategies introduced to face in particular the presence
of subjects that can not be vaccinated as well as the
possibility of complications include the following ac-
tions:
• prevention actions, such as vaccination (when
possible) and informative campaign;
• treatment control to those patients that have got
the infection;
• treatment control to those subjects that have got
also the second not infectious disease.
The paper is organized as follows; Section 2 is divided
into three subsections: in the first two, the considered
model is deeply described and analysed discussing the
existence of the equilibrium points. In the third Sub-
section optimal control strategies are introduced. In
Section 3 numerical results and discussion are pro-
posed; conclusions and future developments are sum-
marized in Section 4.
2 MATERIALS AND METHODS
In this Section a new model of the measles spread is
described, Subsection 2.1, and analysed, Subsection
2.2. In Subsection 2.3 the optimal control strategy is
proposed.
2.1 The Mathematical Model
The mathematical model here analysed takes into ac-
count the most important issues of the measles:
• the possibility that some subjects in the population
could not be vaccinated and therefore it is advis-
able to get the herd immunity;
• the risky condition of having also a complication
along with the infectious disease.
To this aim seven classes of people are introduced:
the Susceptible subjects S1, healthy people not in-
fected; the Susceptible subjects S
2
, healthy people not
infected that cannot be vaccinated; the Exposed in-
dividuals E, infected people, not yet infectious; the
Quarantine patients Q, patients that from the Exposed
class are isolated; the Infected patients I
1
, that may
transmit the virus; the Infected patients I
2
, that may
transmit the virus and with also the non infectious
complication; the Recovered people R, that have been
immunized by vaccine or have been recovered from
the I
1
or the I
2
stage. Note that the Q patients get
the measles, they become infected and infectious, but
they cannot infect any other susceptible subject
In Fig.1 it is shown the block diagram of the pro-
posed model. The control actions introduced include
Figure 1: Block diagram of the proposed model.
preventions and treatments; among the former the
predominant one is the vaccination that could be ap-
plied only on the S
1
individuals. The treatments in-
clude both the actions to face the infectious disease
and the complication; also the patients in the quar-
antine compartment could be considered the effect of
a treatment, meaning that they could not infect any
Analysis, Simulation and Control of a New Measles Epidemic Model
551

susceptible individual. Therefore the proposed model
could be described by the following differential equa-
tions:
˙
S
1
= b
1
− d
1
S
1
− β
11
S
1
I
1
− β
12
S
1
I
2
+δ
2
u
p1
S
1
− δ
1
u
V
S
1
(1)
˙
S
2
= b
2
− d
2
S
2
− β
21
S
2
I
1
− β
22
S
2
I
2
+δ
3
u
p2
S
2
(2)
˙
E = b
3
− d
3
E + β
11
S
1
I
1
+ β
12
S
1
I
2
+β
21
S
2
I
1
+ β
22
S
2
I
2
− δ
4
E (3)
˙
Q = −d
4
Q − γ
3
Q + δ
4
u
T 1
E − δ
5
u
T 2
Q (4)
˙
I
1
= b
4
− d
5
I
1
+ δ
4
(1 − u
T 1
)E − γ
1
I
1
− σ
1
I
1
+σ
2
I
2
− δ
6
u
T 3
I
1
(5)
˙
I
2
= b
5
− d
6
I
2
− γ
2
I
2
+ σ
1
I
1
− σ
2
I
2
−δ
7
u
T 4
I
2
(6)
˙
R = b
6
− d
7
R + γ
1
I
1
+ γ
2
I
2
+ γ
3
Q + δ
1
u
V
S
1
+δ
5
u
T 2
Q + δ
6
u
T 3
I
1
+ δ
7
u
T 4
I
2
(7)
where, using for notation’ reasons the subscripts
1,...,6 referring to quantities in the S
1
, S
2
, E, I
1
, I
2
and R respectively, b
i
, i = 1, ...,6 is the rate of new
people entering the compartments; d
j
, j = 1,...,7 is
the removed rate from every compartments S
1
, S
2
, E,
Q, I
1
, I
2
and R respectively, including also deaths; β
i j
,
i = 1,2 j = 1,2 is the contact rate between the subjects
in the compartment S
i
and the ones in I
j
; σ
i
, i = 1,2
is the infection rate with respect to the complication
disease involving the subjects in the I
1
and the I
2
com-
partments; γ
i
, i = 1,2 is the recovery rate from the I
1
and the I
2
compartment respectively; δ
i
, i = 1, 2,..,7
is related with the control success for the actions u
V
,
u
Pi
, i = 1,2 and u
T j
, j = 1, ..,4, respectively. Let us
define the state vector:
X =
S1 S
2
E Q I
1
I
2
R
T
(8)
and the control vector:
U =
u
V
u
P1
u
P2
u
T 1
u
T 2
u
T 3
u
T 4
T
(9)
We introduce the vector F
F =
f
1
f
2
f
3
f
4
f
5
f
6
f
7
T
(10)
where the f
i
are the r.h.s. functions of equations (1)-
(7).
The proposed complete model with complications
may be written in a compact form as follows:
˙
X = F(X, U, t) (11)
starting from the initial conditions:
X(0) = X
0
(12)
The control actions are assumed bounded:
0 ≤ U
i
(t) ≤ U
M
i
(13)
being U
i
the i- th component of the control U given
by (9) and U
M
i
its corresponding possible maximum
value. In particular, note that for the u
T 1
control the
maximum value allowed could be no more than 1.
A subject in the S
1
compartment could be healthy
all life long, or, if vaccinated, he could reach the
recovered class R or he could become exposed and
therefore get the infectious disease and, eventually,
the complication. For a subject in the S
2
class the
best condition is to remain in that class, since the only
other possibility is to get the infection and maybe also
the risky complication. For the patients infected, but
not yet infectious, two possibilities are allowed: to go
in the quarantine compartment Q, thus avoiding to in-
fect other S
1
and S
2
subjects, or to proceed in the I
1
and, maybe, in the I
2
classes. Note that the patients in
the Q class could get also the complication; they dif-
fer from the I
1
and I
2
patients since they can not infect
any other susceptible individuals.
These considerations suggest the importance of a
suitable control strategy and in particular to reach the
herd immunity; it is important not only for the im-
munosuppressed subject, already weakened by other
therapies, but for all the population since the com-
plications in conjunction with the infectious disease
could be fatal, especially for very young children and
for old people. The analysis of the model with its
equilibrium points is proposed in the next Subsection
2.2.
2.2 The Model Analysis
In this Subsection the model (11) is analysed; the de-
termination of the equilibrium points is not an easy
task, due to the high number of parameters of the
model. Nevertheless, some general considerations
may be proposed and verified in the numerical results
section.
To determine the equilibrium points in the model
(11) the control inputs U
i
are assumed null, as well as
the entries b
j
, j = 3,...,6. Therefore, the equation:
F(X) = 0 (14)
must be solved; as obvious, it is always Q
e
= 0. As it
can be easily verified, the point:
P
e1
=
b
1
/d
1
b
2
/d
2
0 0 0 0 0
T
(15)
is always an equilibrium one.
To check the possible existence of other equilib-
rium points, the equation (6) is considered by impos-
ing its equality to zero; it can be deduced that the
numbers of infected subjects I
1
and I
2
patients in the
equilibrium point (if it exists) are proportional:
I
e
1
= m
1
I
e
2
(16)
ICINCO 2019 - 16th International Conference on Informatics in Control, Automation and Robotics
552

having defined
m
1
=
(σ
2
+ γ
2
+ d
6
)
σ
1
> 0 (17)
From equation (7) it is deduced:
R
e
= m
2
I
e
2
(18)
with
m
2
=
m
1
γ
1
+ γ
2
d
7
> 0 (19)
Analogously, equation (5) allows to write
E
e
= m
3
I
e
2
(20)
with
m
3
=
(d
5
+ γ
1
+ σ
1
)m
1
− σ
2
δ
4
> 0 (21)
It is important to stress that from equation (1) it can be
deduced that if an acceptable value for the equilibrium
I
e
2
exists, then also S
e
1
is defined; in fact
S
e
1
=
b
1
[d
1
+ (β
11
m
1
+ β
12
)I
e
2
]
(22)
Analogously, also S
e
2
is well defined once I
e
2
is, as it is
deduced from (2)
S
e
2
=
b
2
[d
2
+ (β
21
m
1
+ β
22
)I
e
2
]
(23)
Note that if I
e
2
is equal to zero the equilibrium point
P
e1
is determined. By summing (1), (2), (3) and sub-
stituting the expression (22) and (23), the following
equation is determined:
b
1
+ b
2
−
b
1
d
1
d
1
+ (β
11
+ m
1
+ β
12
)I
e
2
−
b
2
d
2
d
2
+ (β
21
+ m
1
+ β
22
)I
e
2
=
((d
5
+ γ
1
+ σ
1
)m
1
− σ
2
)d
3
I
e
2
δ
4
(24)
By rearranging (24), if I
e
2
6= 0, a second order
equation is obtained:
AI
e2
2
+ BI
e
2
+C = 0 (25)
where
A = d
3
(β
11
m
1
+ β
12
)(β
21
m
1
+ β
22
)[(d
5
+ γ
1
+σ
1
)m
1
− σ
2
] (26)
B = [(d
5
+ γ
1
+ σ
1
)m
1
− σ
2
][d
1
d
3
(β
21
m
1
+β
22
) + d
2
d
3
(β
11
m
1
+ β
12
)]
−(β
11
m
1
+ β
12
)(β
21
m
1
+ β
22
)(b
1
+ b
2
)δ
4
(27)
C = d
1
d
2
d
3
[(d
5
+ γ
1
+ σ
1
)m
1
− σ
2
]
−b
1
d
2
δ
4
(β
11
m
1
+ β
12
) − b
2
d
1
δ
4
(β
21
m
1
+ β
22
)
(28)
The coefficient A is always positive; to establish the
sign of the equation (25) it necessary to check if both
B and C can be positive (thus no real root is possible),
or if there is one change of sign in the coefficients A,
B and C (thus one positive root exists), or if there are
two changes of sign (thus two positive roots exist).
The latter case corresponds to the condition: B < 0
and C > 0, being A always positive. In that case, from
the definitions of (27) and (28) one has:
(β
11
m
1
+ β
12
)(β
21
m
1
+ β
22
)(b
1
+ b
2
)δ
4
> [d
1
d
3
(β
21
m
1
+ β
22
) + d
2
d
3
(β
11
m
1
+ β
12
)]
[(d
1
d
3
)
−1
b
1
(β
11
m
1
+ β
12
) +
d
2
d
3
)
−1
b
2
(β
21
m
1
+ β
22
) (29)
which is absurd, resulting
0 > b
1
d
2
(β
11
m
1
+ β
12
)
2
d
1
+ b
2
d
1
(β
21
m
1
+ β
22
)
d
2
Therefore, it can be concluded that it is not possible
to have two solutions from equation (25).
The condition for which no root of (25) exists is
verified once B > 0 and C > 0. From the definitions
(27) and (28) it can be deduced that this occurs when:
[(d
5
+ γ
1
+ σ
1
)m
1
− σ
2
] > max[B
1
,C
1
] (30)
where
B
1
=
(β
11
m
1
+ β
12
)(β
21
m
1
+ β
22
)(b
1
+ b
2
)δ
4
[d
1
d
3
(β
21
m
1
+ β
22
) + d
2
d
3
(β
11
m
1
+ β
12
)]
(31)
and
C
1
=
b
1
d
2
δ
4
(β
11
m
1
+ β
12
) + b
2
d
1
δ
4
(β
21
m
1
+ β
22
)
d
1
d
2
d
3
(32)
In the two situations discussed up to now no equilib-
rium point is determined from equation (25) and the
unique equilibrium point is P
e1
. Now we deduce the
conditions under which one real positive solution ex-
ists of equation (25); it occurs when B > 0 and C < 0
and when B < 0 and C < 0. The former inequalities
imply:
b
1
d
2
δ
4
(β
11
m
1
+ β
12
) + b
2
d
1
δ
4
(β
21
m
1
+ β
22
)
> d
1
d
2
d
3
[(d
5
+ γ
1
+ σ
1
)m
1
− σ
2
]
> d
1
d
2
d
3
(β
11
m
1
+ β
12
)(β
21
m
1
+ β
22
)(b
1
+ b
2
)δ
4
d
1
d
3
(β
21
m
1
+ β
22
) + d
2
d
3
(β
11
m
1
+ β
12
)
Therefore the conditions B > 0 and C < 0 are verified
if
b
1
d
2
d
3
(β
11
m
1
+ β
12
)
2
+ b
2
d
1
d
3
(β
21
m
1
+ β
22
)
2
> b
2
(1 − d
1
d
3
)(β
11
m
1
+ β
12
)(β
21
m
1
+ β
22
) (33)
Analysis, Simulation and Control of a New Measles Epidemic Model
553

Finally, with similar arguments as in the case B,C > 0,
it can be stated the condition for which the last situa-
tion occurs, that is B < 0 and C < 0:
[(d
5
+ γ
1
+ σ
1
)m
1
− σ
2
] < min[B
1
,C
1
] (34)
From all this analysis it can be deduced that the pro-
posed measles epidemic spread model allows at most
two equilibrium points, P
e1
and the solution, if it ex-
ists and is admissible, of equation (25).
Finally, to establish the stability of the deter-
mined equilibrium point(s) the jacobian matrix is cor-
respondingly evaluated to determine the eigenvalues;
in the numerical Section this calculus is provided for
the proposed choice of parameters.
2.3 The Optimal Control Problem
The natural framework in which epidemic control is
faced is the optimal control theory that allows to allo-
cate the limited resources in an efficient way.
The control strategies proposed in this paper are
the preventions and the treatments; the former include
the most important one, the vaccination, whereas the
latter range from the sensibilization to enter in the
quarantine condition to the treatment specific for the
infectious disease, and for the complication.
The idea is to choose the control (9) in such a way
that the number of infected patients, both with and
without complications, is minimized. The proposed
cost index is:
J =
1
2
Z
t
f
t
0
L(X,U,t)dt
=
1
2
Z
t
f
t
0
A
1
I
2
1
+ A
2
I
2
2
+ B
1
u
2
V
+ B
2
u
2
P1
+ B
3
u
2
P2
+B
4
u
2
T 1
+ B
5
u
2
T 2
+ B
6
u
2
T 3
+ B
7
u
2
T 4
dt (35)
In view of the use of the Pontryagin principle, the
Hamiltonian function is defined as:
H =
1
2
L(X,U,t)+ λ
T
(t)F(X,U,t)
=
1
2
"
2
∑
i=1
A
i
I
2
i
+
6
∑
j=1
B
i
U
2
i
#
+ λ
T
(t)F(X,U,t)
(36)
where λ
i
, i = 1,2, ...,7 are the costate functions. The
necessary conditions of optimality are given by:
˙
λ
i
= −
∂H
∂X
i
, i = 1, 2,..., 7 (37)
0 =
∂H
∂u
j
, j = 1,..,7 (38)
with final conditions:
λ
i
(t
f
) = 0, i = 1,2,...,7 (39)
By solving conditions (38) and taking into account
the constraints (13), along with the (37), the optimal
control U
i
, i = 1, ..,7 are determined:
u
V
= max{min{
(λ
1
− λ
7
)δ
1
S
1
B
1
,U
M
1
},0}(40)
u
P1
= max{min{
−λ
1
δ
2
S
1
B
2
,U
M
2
},0} (41)
u
P2
= max{min{
−λ
2
δ
3
S
2
B
3
,U
M
3
},0} (42)
u
T 1
= max{min{
(λ
5
− λ
4
)δ
4
E
B
4
,U
M
4
},0} (43)
u
T 2
= max{min{
(λ
4
− λ
7
)δ
5
Q
B
5
,U
M
5
},0} (44)
u
T 3
= max{min{
(λ
5
− λ
7
)δ
6
I
1
B
6
,U
M
6
},0} (45)
u
T 4
= max{min{
(λ
6
− λ
7
)δ
7
I
2
B
7
,U
M
7
},0} (46)
Note that the optimal controls require the solution
of the costate equations (37) with the final condition
(39) in addition to the state equation (11) with the ini-
tial conditions (12).
3 NUMERICAL RESULTS AND
DISCUSSION
In this Section, a numerical analysis is performed to
study the proposed measles epidemic model and to
evaluate the effects of different control strategies in a
fixed time period [0, 30] years. As far as the choice of
the model parameters, they are strictly dependent on
the specific population on which the model is referred
to: different healthy, economic and social conditions
could vary significantly its numerical values. In all
the cases analysed the initial conditions are set equal
to X
0
=
900 10 5 1 1 0 0
T
, whereas for
the model parameters the values
b
1
= 10, b
j
= 1, j = 2,. ..,5, b
6
= 0,
d
1
= d
7
= 0.015, d
2
= 0.02,
d
3
= d
4
= 0.05, d
5
= 0.08, d
6
= 0.09
β
i j
= 0.01, i = 1,2, j = 1,2,
σ
1
= 0.4, σ
2
= 0.2,
γ
1
= γ
3
= 0.1, γ
2
= 0.07
δ
1
= 0.9, δ
2
= δ
3
= 0.2, δ
j
= 0.4, j = 4,.., 7
are assumed. Note the higher values of death param-
eters for the subjects in the I
1
and I
2
classes corre-
sponding to the risky condition of being infected and,
most of all, of being infected with a complication.
ICINCO 2019 - 16th International Conference on Informatics in Control, Automation and Robotics
554

The parameter σ
1
is assumed larger than σ
2
to stress
the larger rate of getting the complication rather than
recovering from it. By using the analsyis of Subsec-
tion 2.2, the obtained equilibrium points for the pro-
posed choice of parameters are:
P
e1
=
667 50 0 0 0 0 0)
T
T
(47)
always present, and:
P
e2
=
2 0 219 0 245 272 2906
T
(48)
These results are consistent with what stated previ-
ously; in fact by evaluating the parameters A, B, and
C given by (26), (27) and (28) respectively, it is found:
A = 10
−6
, B = −0.0016, C = −0.0016 (49)
Therefore a second equilibrium point, besides P
e1
, ex-
ists. The evaluation of the Jacobian matrix in each of
these points and the determination of the correspond-
ing eigenvalues allow to state that P
e1
is not stable,
whereas the P
e2
is locally asymptotically stable, hav-
ing all the eigenvalues real and negative.
The optimal control actions proposed are intro-
duced in the model and compared with three situa-
tions: free evolutions (Case 1), only constant vacci-
nation (Case 2), only constant prevention campaign
(without vaccination) with constant treatments (Case
3). The comparison is proposed both from graphical,
Figs. 2–8, and numerical, Table 1 and Table 2, point
of view. The indicators introduced aim at evaluating
the effectiveness of the actions with respect to the pe-
culiarities of the epidemic disease considered, that is
to avoid susceptible subjects S
2
to get the infections
and to avoid infected subjects I
1
to get the complica-
tion, thus entering in the I
2
class. The optimal con-
trol strategy is referred as Case 4. The indicators pro-
posed in Table 1 are:
• the percentage of dead patients infected, i.e. the
total number of dead patients in the E, Q, I
1
and
I
2
compartments with respect to the total number
of dead people in the population;
• the number S
t f
2
of susceptible subjects in S
2
at the
end of the control period;
• the percentage
¯
S
2
of susceptible subjects S
2
in the
entire control period;
• the percentage
¯
I
1
of infected patients I
1
in the en-
tire control period;
• the percentage
¯
I
2
of infected patients I
2
in the en-
tire control period;
• the percentage
¯
R of removed individuals R in the
entire control period.
Moreover, also the cost of each strategy is evaluated
by considering the total control effort
¯
U
j
of each U
j
,
see Table 2.
As far as the control actions, they are assumed
bounded between 0 and 0.8. In the cost index the
control actions are weighted, aiming at an efficient
resources allocation; the solution of the optimal con-
trol problem depends on the choice of the parameters
in the cost index, as usual; the proposed setting cor-
responds to the need of allowing a deeper prevention
campaign trying to avoid as much as possible the risky
condition of the infection. Therefore, the following
choices are proposed:
B
i
= 10
−4
, i = 1, 2,3 B
j
= 0.01, i = 4, ..,7
Hence, the treatments are considered more expensive
than the prevention controls. As far as the parame-
ters of the optimal control problem formulations, they
have been chosen as A
1
= 0.1 and A
2
= 10; this means
that the aim is to minimize mainly the number of in-
fected subjects I
2
, being the ones that are risking more
with the infection and the complication. Of course
other choices are possible; in this case it is stressed
the dangerousness of being in the I
2
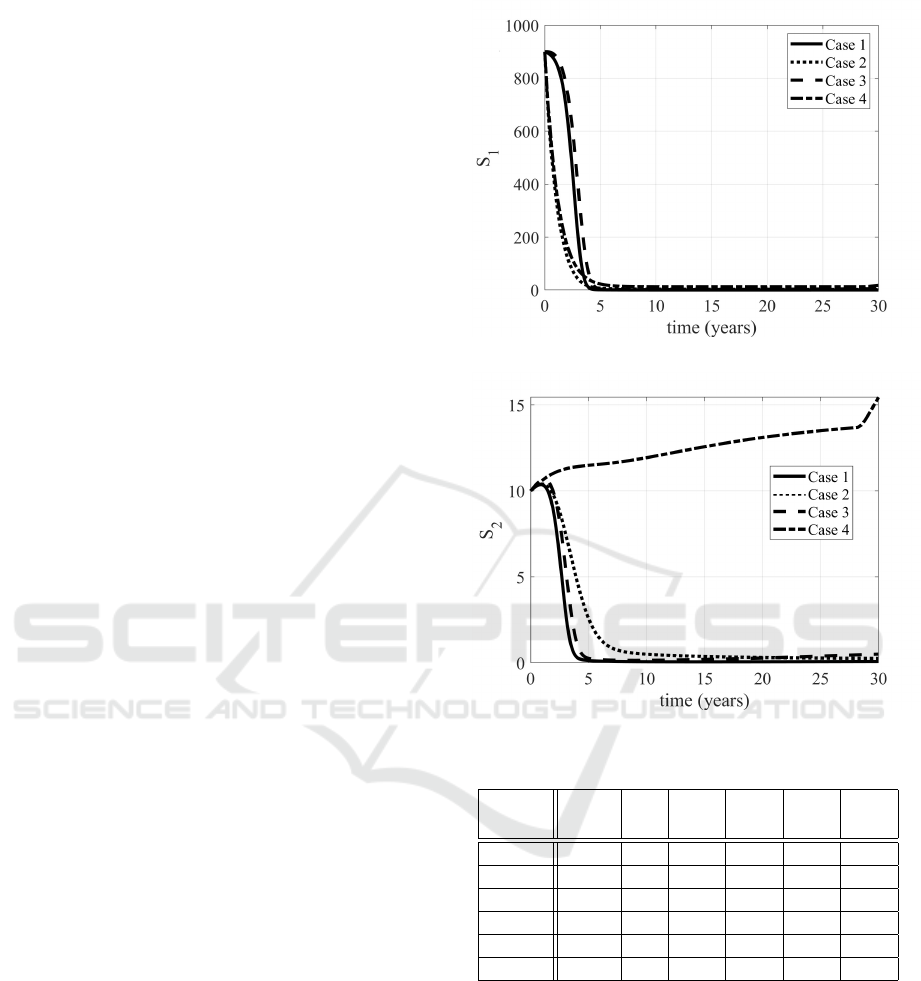
class. In Figs.
2–8 the evolutions of the state variables in the four
cases considered are proposed. The increased num-
ber of S
2
subjects is evident, as well as the decrease
of the infected subjects (patients in E, Q, I
1
and I
2
).
The Case 3, devoted to the treatments, allows a
large number of people to enter in the quarantine con-
dition, sensibly more than in Case 4; this is reason-
able, since in the latter, being possible all the control
actions together, it has been chosen to weight more
the treatments, assuming more costly (also from a so-
cial point of view) to act after the infection, rather
than preventing it. It it worth to be noted the evolu-
tion of the removed subjects: in the non controlled
case (Case 1) the population will enter in the R class,
sooner or later; with the optimal control the idea is to
avoid people to enter in the epidemic path (E, Q or I
1
and maybe I
2
) and getting the immunity or remaining
in the susceptible condition S
2
, reducing the number
of dead patients (see Table 1). Therefore the evolution
of the R subjects is rather constant in Case 4.
As far as the optimal control actions it is worth to
be noted that the vaccination is required at its upper
bound for most of the control period, as well as the
control u
T 1
, that induces patients to quarantine, thus
avoiding to infect susceptible people. This is reason-
able, having chosen to minimize the number of in-
fected patients.
From Table 1 it is evident the advantage of allo-
cating efficently the resources; in fact the number of
dead people is one order lower in Case 4 with respect
Analysis, Simulation and Control of a New Measles Epidemic Model
555
to the absence of control (Case 1); the decrease is ev-
ident also with respect to constant controls applied,
Case 2 (control only by the vaccination) and Case 3
(control only by the prevention, without vaccination,
and treatments).
The advantages in Case 4 are evident when con-
sidering the number of susceptible people S
2
at the
end of the control period; moreover also the num-
ber of recovered people, that is immunized subjects
(where the immunization is obtained by vaccination
or after having caught the disease), strongly increases
in Case 4. Obviously, the efficient use of all the avail-
able controls is more expensive, rather than do not do
nothing (Case 1) or use only some of the control ac-
tions, as evidenced in Table 2.
It is interesting to note what happen if in the cost
index the weights of the control are increased of two
orders of magnitude, meaning that it becomes more
expensive (for all the controls) to minimize the in-
fected patients I
1
and I
2
. The numerical values are
shown in Table 1 and Table 2, indicated as Case 5;
it is important to note that from a numerical point of
view the results appear rather equivalent, slightly less
expensive than in the Case 4, see Table 2. What is
interesting is the behaviour of the controls u
V
, u
P1
and u
P2
, as shown in Figs. (12), (13), (14). In fact,
while the evolutions of the treatments control do not
vary significantly, in Case 5 the vaccination is at its
maximum value for less than five years, with a re-
quired increase of the other two prevention controls
u
P1
and u
P2
. Therefore, the optimal control formula-
tion allows to allocate optimally the more expensive
resources obtaining almost comparable numerical re-
sults for the indicators, as noted.
As noted, the results of the optimal control strat-
egy depend on the weights A
i
, i = 1,2 and B
j
, j =
1,...,7. The choice proposed in Case 4 and Case 5
aims at reducing mainly the number of patients I
2
, be-
ing the ones more at risk. Since in the model it is as-
sumed that a subjects becomes a member of the risky
class I
2
only after entering in the I
1
class, a strategy
could be to avoid strongly the infection, and thus as-
signing an higher weight to A
1
, than to A
2
. Therefore,
in the following Case 6 it assumed A
1
= 10, A
2
= 0.1,
with the same values of the weight B
j
, j = 1,...,7 as in
Case 4. It can be noted the slight increase of the per-
centage of dead patients with respect to Case 4 but the
almost equivalent results for the other indicators of
Table 1. The cost of the vaccination increases, while
there is a sensible decrease in the prevention actions
u
P1
and u
P2
, see Table 2; this result could be justified,
considering that, besides any complication, the best
strategy to avoid people to get the measles the most
effective strategy is the vaccination.
Figure 2: Evolutions of the S
1
subjects in Cases 1,2,3,4.
Figure 3: Evolutions of the S
2
subjects in Cases 1,2,3,4.
Table 1: Evaluation of the cases proposed.
Dead S
t f
2
¯
S
2
¯
I
1
¯
I
2
¯
R
(%) (%) (%) (%) (%)
Case 1 87.7 0 0.03 19.6 19.9 37.9
Case 2 60.5 0 0.28 7.8 7.6 59.6
Case 3 78.8 1 0.12 11.6 9.18 44.6
Case 4 7.98 15 1.38 0.25 0.3 90.7
Case 5 8.17 21 1.51 0.26 0.3 90.4
Case 6 8.00 15 1.38 0.25 0.3 90.8
4 CONCLUSIONS
The measles infectious disease represents a risk for
subjects that can not be vaccinated, mainly for the
possible complications. In this paper this problem is
faced by proposing a new model that extends the clas-
sical SEIR scheme usually adopted introducing the
specific class of immunosuppressed subjects and the
one of subjects infected with complication. The aim
is to determine the best global control strategy includ-
ICINCO 2019 - 16th International Conference on Informatics in Control, Automation and Robotics
556
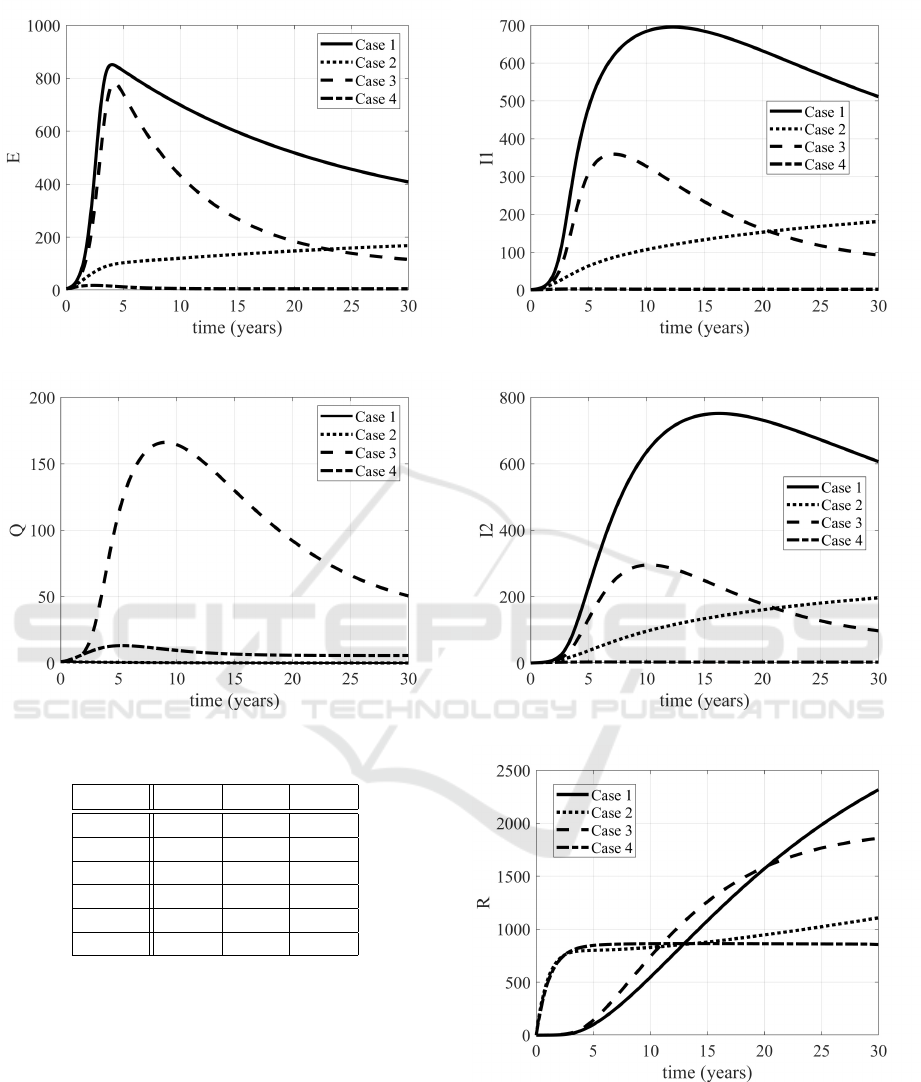
Figure 4: Evolutions of the E subjects in Cases 1,2,3,4.
Figure 5: Evolutions of the Q subjects in Cases 1,2,3,4.
Table 2: Evaluation of the control strategies.
¯
U
1
∑
3
2
¯
U
j
∑
7
4
¯
U
j
Case 1
Case 2 24
Case 3 6 24
Case 4 23.58 1.1 82.42
Case 5 21.6 9.1 81.28
Case 6 23.75 0.61 82.32
ing vaccination, other prevention actions (such as in-
formative campaign) and treatments. In the frame-
work of optimal control theory and under the hy-
pothesis of limited resources, an optimal solution to
the problem of decreasing the number of infected pa-
tients is proposed. The central role of vaccination is
confirmed, along with a synergy among all the intro-
duced actions; the improvements due to the optimal
control determined are evident when compared with
the absence of control or with strategies that consider
treatments and preventions (but not vaccination) or
those that introduce only the vaccination. Future work
should identify the model parameters referring to spe-
Figure 6: Evolutions of the I
1
subjects in Cases 1,2,3,4.
Figure 7: Evolutions of the I
2
subjects in Cases 1,2,3,4.
Figure 8: Evolutions of the R subjects in Cases 1,2,3,4.
cific scenarios, taking into account socio-economics
and cultural conditions. Consequently, also the pa-
rameters referring to the control actions should be re-
considered taking into account the economic cost of
prevention and of treatments. In the proposed formu-
lation the final time is fixed at 30 years; nevertheless
Analysis, Simulation and Control of a New Measles Epidemic Model
557
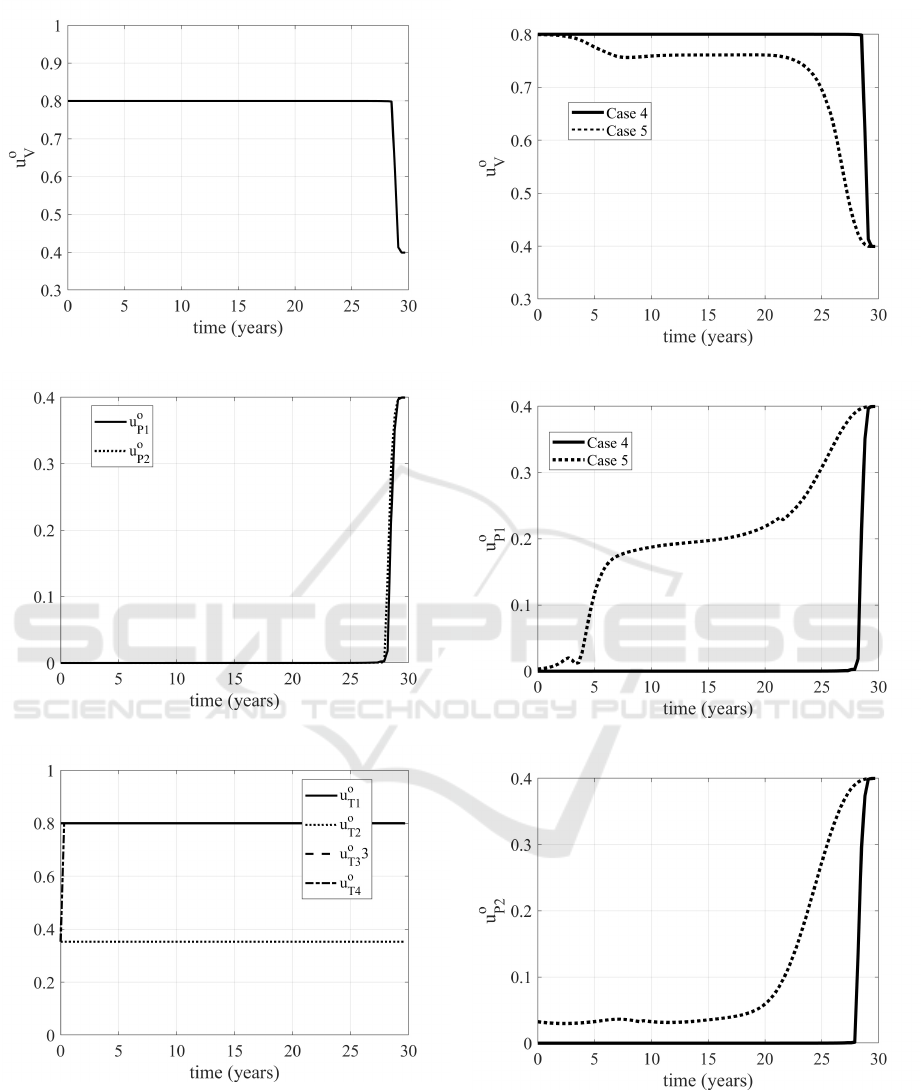
Figure 9: Evolution of optimal vaccination u
o
V
.
Figure 10: Evolutions of the u
o
P1
and u
o
P2
controls.
Figure 11: Evolutions of the u
o
T j
, j = 1,..,4 controls.
it could be interesting, referring to particular cases, to
determine the best strategy to reduce the number of
infected patients in the minimum time.
Figure 12: Evolution of the u
o
V
control in Cases 4 and 5.
Figure 13: Evolution of the u
o
P1
control in Cases 4 and 5.
Figure 14: Evolution of the u
o
P2
control in Cases 4 and 5.
REFERENCES
A.A.Momoh, Ibrahim, M., i.J.Uwanta, and S.B.Manga
(2013). Mathematical model for control of measles
ICINCO 2019 - 16th International Conference on Informatics in Control, Automation and Robotics
558

epidemiology. International Journal of Pure and Ap-
plied Mathematics, 87(5):707–718.
Di Giamberardino, P., Compagnucci, L., Giorgi, C. D., and
Iacoviello, D. (2018). Modeling the effects of pre-
vention and early diagnosis on hiv/aids infection dif-
fusion. IEEE Transactions on Systems, Man and Cy-
bernetics: Systems.
Di Giamberardino, P. and Iacoviello, D. (2017). Optimal
control of SIR epidemic model with state dependent
switching cost index. Biomedical Signal Processing
and Control, 31.
Di Giamberardino, P. and Iacoviello, D. (2018a). Lq control
design for the containment of the hiv/aids diffusion.
Control Engineering Practice, 77.
Di Giamberardino, P. and Iacoviello, D. (2018b). Model-
ing and control of an epidemic disease under possible
complication. Proceedings of the 22nd International
Conference on System Theory, Control and Comput-
ing, pages 67–72.
E.A.J.Fischer, Vlas, S., J.H.Richardus, and Habbema, J.
(2008). Musidh, multiple use of simulated demo-
graphic histories, a novel method to reduce com-
putation time in microsimulation models of infec-
tious diseases. Computer Methods and Programs in
Biomedicine, 91:185–190.
Iacoviello, D. and Stasio, N. (2013). Optimal control for
sirc epidemic outbreak. Computer Methods and Pro-
grams in Biomedicine.
Kuniya, T. and Nakata, Y. (2012). Permanence and extinc-
tion for a nonautonomous seirs epidemic model. Ap-
plied Mathematics and Computation, 218.
Ledzewicz, U. and Schattler, E. (2011). On optimal sin-
gular controls for a general SIR-model with vaccina-
tion and treatment. Discrete and continuous dynami-
cal systems.
L.Pang, S.Ruan, S.Liu, Z.Zhao, and X.Zhang (2015).
Transmission dynamics and optimal control of
measles epidemics. Applied mathematics and com-
putations, 256:131–147.
Naresh, R., Tripathi, A., and Sharma, D. (2009). Modeling
and analysis of the spread of aids epidemic with immi-
gration of hiv infectives. Mathematical and Computer
Modelling, 49.
Nowak, M. and May, R. (2000). Virus Dynamics.
Nowzari, C., Preciado, V. M., and Pappas, G. J. (2016).
Analysis and control of epidemics. a survey of spread-
ing processes on complex networks. IEEE Control
Systems Magazine.
O.O.Onyejekwe and E.Z.Kebede (2015). Epidemiological
modeling of measles infection with optimal control
of vaccination and supportive treatment. Applied and
computational mathematics, 4(4):264–274.
Pinto, C. and Rocha, D. (2012). A new mathematical model
for co-infection of malaria and hiv. 4th IEEE Interna-
tional Conference on Nolinear Science and Complex-
ity.
R.T.Perry and N.A.Halset (2004). The clinical significance
of measles: a review. The Journal of Infectious Dis-
eases, 189(1):4–16.
S.O.Adewale, I.A.Olopade, S.O.Ajao, and G.A.Adeniran
(2016). Optimal control analysis of the dynamical
spread of measles. International Journal of research,
4(5):169–188.
S.Verguet, M.Johri, S.K.Morris, C.L.Gauvreau, P.Jha, and
M.Jit (2015). Controlling measles using supplemen-
tary immunization activities: a mathematical model to
inform optimal policy. Vaccine, 33(10):1291–1296.
TW, N., Turinici, G., and A.Danchin (2003). A double epi-
demic model for the sars propagation. BMC Infect
Dis., 10.
X.Yan and Y.Zou (2008). Optimal and sub-optimal quaran-
tine and isolation control in sars epidemics. Mathe-
matical and computer modelling, 47.
Analysis, Simulation and Control of a New Measles Epidemic Model
559
