
Machine Learning Approach for National Innovation Performance
Data Analysis
Dominik Forner
1a
, Sercan Ozcan
1b
and David Bacon
2c
1
Faculty of Business and Law, University of Portsmouth, Portland Street, Portsmouth, U.K.
2
Institute of Cosmology and Gravitation, University of Portsmouth, Burnaby Road, Portsmouth, U.K.
Keywords: Innovation Performance, Neural Networks, Machine Learning, National Innovation System, Economic
Growth, Innovation Policy, Decision Support System.
Abstract: National innovation performance is essential for being economically competitive. The key determinants for
its increase or decrease and the impact of governmental decisions or policy instruments are still not clear.
Recent approaches are either limited due to qualitatively selected features or due to a small database with few
observations. The aim of this paper is to propose a suitable machine learning approach for national innovation
performance data analysis. We use clustering and correlation analysis, Bayesian Neural Network with Local
Interpretable Model-Agnostic Explanations and BreakDown for decomposing innovation output prediction.
Our results show, that the machine learning approach is appropriate to benchmark national innovation profiles,
to identify key determinants on a cluster as well as on a national level whilst considering correlating features
and long term effects and the impact of changes in innovation input (e.g. by governmental decision or
innovation policy) on innovation output can be predicted and herewith the increase or decrease of national
innovation performance.
1 INTRODUCTION
In the new global economy, national innovation
performance has become a central issue for being
economically competitive (Izsak et al., 2013). It has
therefore been the subject of much systemic
investigation. Whilst traditional innovation system
research focused in the past decades on the qualitative
analysis of activities and relations of different actors
within an innovation system, recent approaches apply
machine learning techniques for a quantitative
approach. Nevertheless, they are either limited due to
qualitatively selected features or due to a small
database with few observations. In any case, it is not
possible to predict the effect of changing key
determinants on innovation output and the associated
impacts on national innovation performance in the
innovation ecosystem. This study therefore proposes
a suitable machine learning approach for national
innovation performance data analysis.
a
https://orcid.org/0000-0001-7100-4998
b
https://orcid.org/0000-0002-0482-7529
c
https://orcid.org/0000-0002-2562-8537
2 LITERATURE
The following section outlines two themes of
literature, national innovation performance including
systems of innovation as well as machine learning
approaches in recent studies in the field of innovation
management.
2.1 National Innovation Performance
All systems of innovation approaches, starting with
National Systems of Innovation (NIS) (Freeman,
1987; Dosi, 1988) contribute to a general
understanding of innovation (Lundvall, 2004) and the
interrelationships of a variety of different elements in
innovation systems (Izsak et al., 2013), but the
boundaries between the systems become blurred
(Leydesdorff, 2000).
Different organisations and institutions developed
innovation indexes. An innovation index constitutes
the different facets of a NIS (Crespo and Crespo,
Forner, D., Ozcan, S. and Bacon, D.
Machine Learning Approach for National Innovation Performance Data Analysis.
DOI: 10.5220/0007953603250331
In Proceedings of the 8th International Conference on Data Science, Technology and Applications (DATA 2019), pages 325-331
ISBN: 978-989-758-377-3
Copyright
c
2019 by SCITEPRESS – Science and Technology Publications, Lda. All rights reserved
325

2016) and facilitates the evaluation of innovation
capability (Wang and Gong, 2017). Since it is
difficult to determine an overall outcome of policy
instruments, an innovation index also measures the
effectiveness of government intervention (Mahroum
and Al-Saleh, 2013).
Current trends in the research of innovation
systems have led to a proliferation of studies that use
modern analytical methods to identify specific
determinants in innovation indexes and to predict the
effect of policy instruments.
2.2 Machine Learning Approaches
Data Envelopment Analysis (DEA), stochastic
frontier analysis (SFA) (Liu et al., 2018) and Fuzzy
Set Quantitative Comparative Analysis (fsQCA) are
currently the most popular methods for investigating
innovation performance quantitatively. One of the
main obstacles is that studies are limited in terms of
selecting the relevant features and with regard to the
number of observations used for calculation (Cooper
and Glaesser, 2011; Kane et al., 2014). Furthermore,
QCA performs incorrect for causal inference and its
application should be discontinued (Baumgartner and
Thiem, 2017).
Recent studies therefore use machine learning
techniques to overcome these limitations. Hajek and
Henriques (2017) demonstrated in their study, that the
importance of determinants of regional innovation
performance can be identified using multi-output
neural networks. However, the determinants used for
analysis have been evaluated empirically based on
two community innovation surveys instead of
applying unsupervised feature selection.
Pençe, Kalkan and ÇeSmeli (2018) followed a
similar approach by applying artificial neural network
on a Global Innovation Index (GII) data set of 2016.
They identified 27 features that increase innovation
performance. However, the study is limited due to the
observation of one single year and not considering
long-term effects and correlations.
One study of Minniti and Venturini (2017)
predicted the growth effect of policy instruments
targeting business R&D by using a novel regression
procedure on industry data from the United States.
2.3 Literature Gap and Objective
This section has attempted to provide a brief
summary of the literature relating to national
innovation performance, innovation index based
research and application of machine learning
techniques. The studies reviewed here consistently
indicate that a suitable approach for the analysis of
national innovation performance using machine
learning techniques has not yet been found. Current
approaches are either limited due to qualitatively
selected features or due to a small database with few
observations. In any case, it is not possible to predict
the effect of changing key determinants on innovation
output and the associated impacts on national
innovation performance in the innovation ecosystem.
Therefore, the aim of this paper is to propose a
suitable machine learning approach for national
innovation performance data analysis.
3 METHODOLOGY
This study follows the ongoing trend in innovation
index based research. Firstly, an appropriate
innovation index is selected followed by data
collection and preparation. Secondly, interrelations of
innovation performance have been investigated and
national innovation profiles have been established. In
a third step, key determinants have been identified
and their effect on national innovation performance
has been analysed. In a fourth step, the prediction of
innovation output is decomposed and the importance
of features as well as their effect in case of change is
investigated. Finally, conclusions were drawn for the
development of a decision support system for
innovation policy in consideration of prior results.
The analysis is performed using R (R Core Team,
2017) and Python (van Rossum and Drake, 2011).
The terms ‘feature’ and ‘determinant’ are used
interchangeably in this study.
3.1 Data Collection and Preparation
Different innovation indexes and scoreboards have
been assessed and the most appropriate index has
been selected according to the following criteria.
- Published yearly
- Main focus on innovation performance
- Assessment on national level
- Index data is accessible and comparable
- Data used by indexes is retrieved from reliable
sources
All criteria are met by the GII. It is constituted by an
input / output framework with 7 pillars and 21
categories, containing 81 indicators of which 57 are
related to hard data, 19 are composite indicators and
5 are related to survey questions whereas data is
retrieved from 30 different reliable sources. Data of
DATA 2019 - 8th International Conference on Data Science, Technology and Applications
326

the GII has been retrieved from its web source
4
covering a five years’ time frame from 2014 to 2018.
The data files have been consolidated by mapping
features column-wise and countries row-wise. Each
row represents the country, year of observation and
the values related to the 81 features.
Subsequently the data set has been cleaned by
removing countries without full records. The
resulting data set contains 120 countries with 480
observations. Missing values of some countries have
been imputed using multiple imputation by chained
equations (MICE) with the predictive mean matching
method of the caret package (Kuhn, 2017). Herewith,
values are predicted as close as possible in relation to
observed values, whereas the distribution resembles
that from ordinal logistic regression.
3.2 Understanding Interrelationships
and Establishing National
Innovation Profiles
Understanding the interrelations and establishing
national innovation profiles was achieved by
applying cluster analysis, correlation analysis, time
series analysis and principal component analysis
(PCA).
Clustering the data set has been performed using
Clustering for Large Applications (CLARA) with the
‘Manhattan’ metric according to Kaufman and
Rousseeuw (1990) of the cluster package (Maechler
et al., 2017). The chosen metric is less sensitive
concerning outliers by calculating the distances as a
sum of absolute differences. CLARA thereby clusters
only a sample of the full data set and assigns
subsequently all objects to the respective clusters.
The number of clusters has been determined with the
gap statistic method (Tibshirani and Hastie, 2006).
Following the descriptive analysis of the
interrelationships between countries in terms of
innovation performance, the interrelationships of the
individual features were analysed by means of
correlation analysis. Thereby, any values between 0.1
and -0.1 have been declared as not correlating.
A time series analysis was conducted to
investigate if long-term effects of features exist.
Therefore, the data set has been converted into a time
series object using the xts package (Ryan and Ulrich,
2017) and is analysed further using autocorrelation
function (ACF) of the stats package (R Core Team,
2017).
Establishing national innovation profiles has been
performed using PCA and investigating the
4
https://www.globalinnovationindex.org/analysis-indicator
component loadings. PCA transforms the data to a
new set of uncorrelated variables, where the first
components represent the most variance of all
principal components (Joliffe, 2002). The features of
a national innovation profile in the original feature
space are mapped on the same component.
Results are visualised using the ggplot2 package
(Wickham, 2016) for PCA, the factoextra package
(Kassambara and Mundt, 2017) for CLARA, the
seaborn package (Waskom et al., 2018) for the
correlation heatmap in python and the zoo package
(Zeileis and Grothendieck, 2005) for the ACF plot.
3.3 Identifying Key Determinants and
Investigating Their Effect on
National Innovation Performance
Different machine learning models have been cross
validated using the train function in the caret package
(Kuhn, 2017), inter alia tree-based models, boosting
models and neural network models. The method used
for cross validation was k-fold cross-validation
whereas k=10. The data set was divided into learning
and testing in a three-quarter ratio. The decisive
criterion for the model selection was the Root Mean
Square Error (RMSE) value.
Model performance plots, learning curves and
residuals diagnostic plots were created with the
DALEX package (Biecek, 2018) and analysed to
evaluate the performance of the model, goodness of
fit and to audit residuals.
In order to investigate the effects of key
determinants on national innovation performance, the
functioning of the model is analysed. Results of
Merging Path Plot based on Tukey HSD test are
compared to CLARA results to identify countries
with similar factorisation related to innovation output
in the ecosystem. In addition, global variable
importance has been assessed overall and on a cluster
level to specify the key determinants. Their effect on
innovation output has been investigated with Partial
Dependency Plots.
3.4 Decomposing Innovation Output
Prediction
Prediction of innovation output is decomposed with
breakdown plot (Staniak and Biecek, 2018) to
investigate the attribution of key determinants.
Further, their importance has been assessed by Local
Interpretable Model-Agnostic Explanations
(Pedersen and Benesty, 2018). To assess whether and
Machine Learning Approach for National Innovation Performance Data Analysis
327
how changes in key determinants (e.g. by innovation
policy and governmental decisions) are reflected in
innovation output, ceteris paribus plots (Biecek,
2019) are created and interpreted.
3.5 Establishing a Decision Support
System for Innovation Policy
In consideration of the results of the descriptive
analysis of the interrelations in the innovation
ecosystem, the national innovation profiles and the
effect of identified key factors on innovation
performance, conclusions were drawn for the
development of a decision support system for
innovation policy.
4 RESULTS
This section outlines the results of the descriptive
analysis for establishing national innovation profiles,
investigating correlation as well as long-term effects
of features and the identification of national
innovation performance key determinants using
Bayesian Neural Network as well as decomposing the
prediction for innovation output.
4.1 Clustering, Correlation and Time
Series Analysis
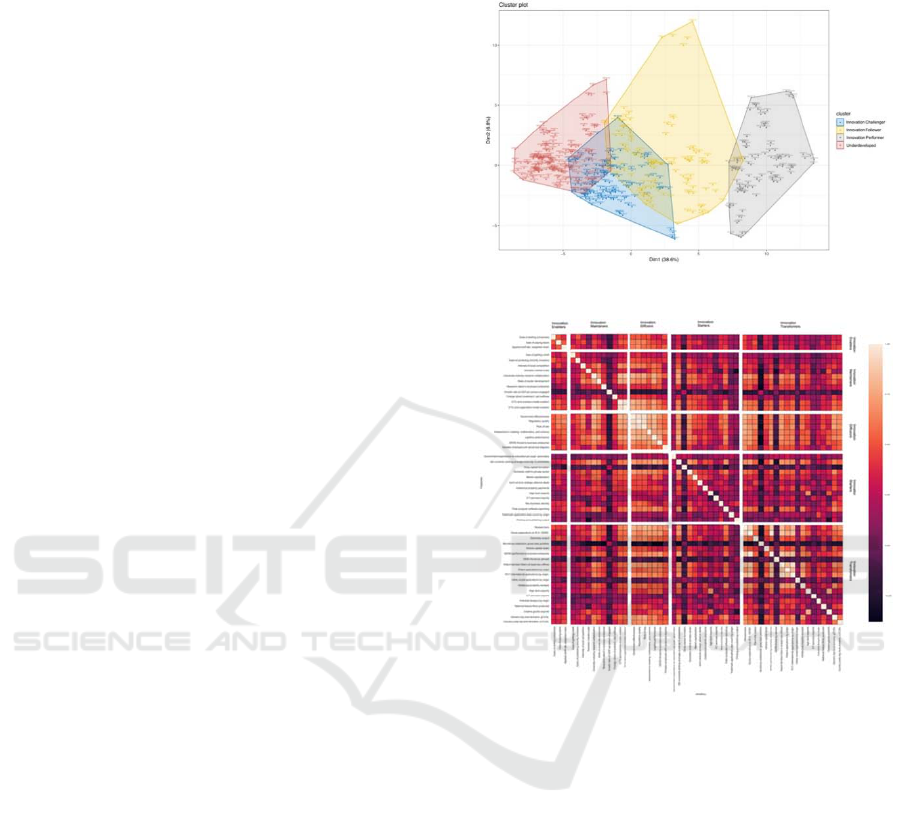
The result of CLARA clustering has been visualised
with two dimensions, explaining about 45.6% of point
variability (see Figure 1). Countries are positioned in
the visual in relation to their innovation performance in
the innovation ecosystem. Thereby, clusters can be
labelled as Innovation Performer, Innovation Follower,
Innovation Challenger, and Underdeveloped.
Interestingly, some clusters are overlapping and some
countries managed to shift to a higher cluster in some
years, others did not manage to improve whilst being
in an overlapping area.
Also, the position of China has to be highlighted,
which is in the Innovation Follower cluster and
distanced from the other countries. Further
investigation of these cases revealed, that countries
with features of the category innovation diffusors in
their national innovation profile managed to shift into
a higher cluster. This category contains features
related to business sophistication, education,
infrastructure, political and regulatory environment.
China has a very diversified innovation profile
with dynamically changing composition of features.
There is a lack of innovation diffusor features and the
profile is mainly constituted by creative outputs,
market sophistication and knowledge diffusion.
Figure 1: CLARA Cluster Plot of Countries.
Figure 2: Correlation Matrix of Clusters and Features.
Looking at the correlation matrix of clusters and
features (see Figure 2), positive as well as negative
correlations have been identified. There was a
significant positive correlation between researchers
and gross expenditure on R&D (0.89) and between
researchers and GERD performed by business
enterprise (0.86). Another significant positive
correlation has been identified between Gross
expenditure on R&D and GERD performed by
business enterprise (0.98) and patent families filed in
at least two offices (0.86). The most significant
negative correlation has been found between high
tech imports and ICT services imports (-0.78).
Figure 3 shows the time series plot of features
whereby the feature index is on the x-axis and the
mean values on the y-axis. Lines are plotted for the
years 2014-2017. Looking at features between the
index 1-10 (1), outliers mainly exist in 2017 and
2014, indicated by a lower value.
DATA 2019 - 8th International Conference on Data Science, Technology and Applications
328
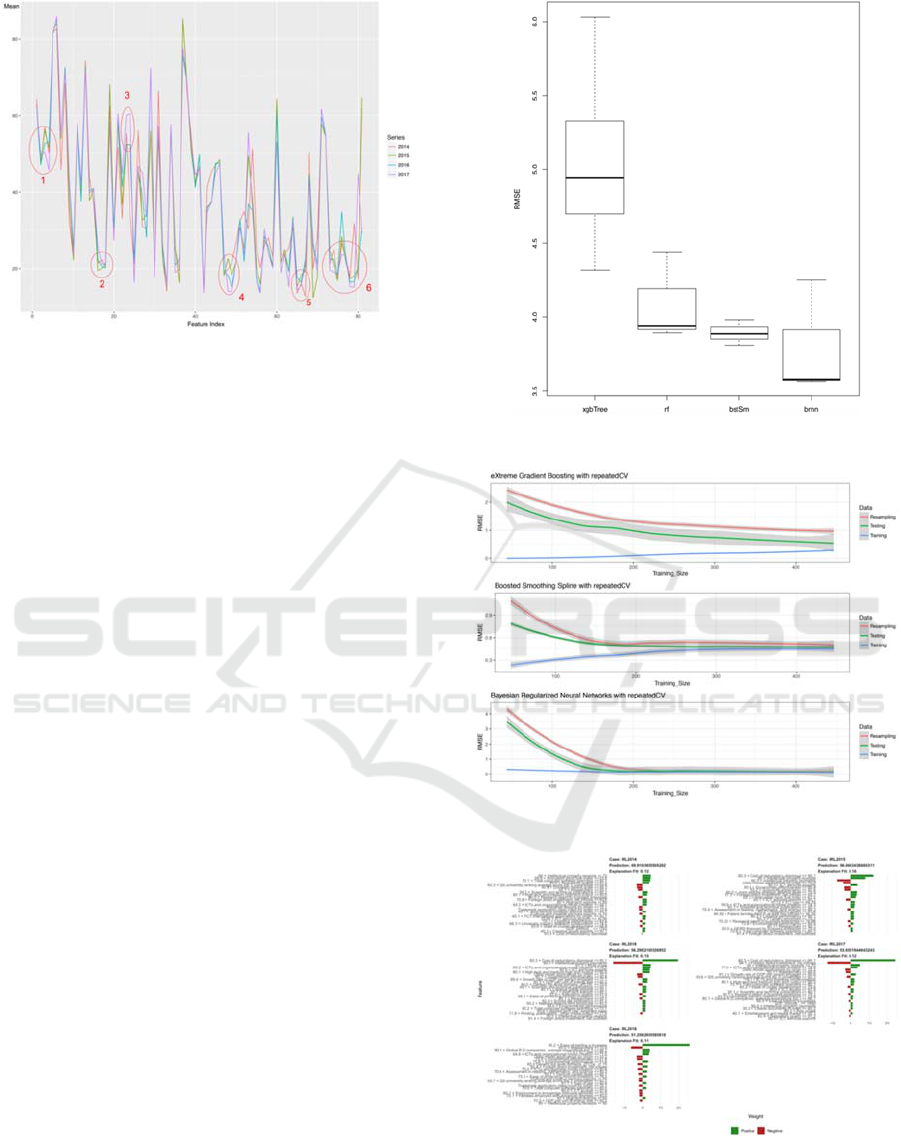
Figure 3: Time Series Plot of Features.
Furthermore, it appears that features in 2016 -
2017 are changing regarding their values compared to
2014-2015. This change can also be seen between
features 11-20 (2), additionally values in 2014 show
an upward trend whilst in other years a downward
trend. For features between 41-50 (4) this contrary
trend can also be observed, 2016-2017 going down
whilst 2014-2015 going up, being the same between
features 61-70 (5) and features 71-81 (6). At some
features (3) a shift can be observed as well for 2016-
2017 with higher values than features of 2014-2015.
In general, it can therefore be stated that some
features are affected prior to 2016, which leads to a
change for the following years. Furthermore, time
lags have been identified in the ACF-plot that occure
within two years from or prior to the point of
observation.
4.2 Model Validation, Identification of
Key Determinants and
Decomposing Prediction
The cross-validation of machine learning (ML)
methods revealed that Bayesian Regularized Neural
Network (BRNN) fits according to its RMSE value
better than Boosted Smoothing Splines (bstSm),
Random Forests (rf) and Extreme Gradient Boosting
Trees (xgbTree) in relation to the GII dataset (see
Figure 4). Further, the learning curve of BRNN is
with regard to resampling, testing and training data
almost congruent from a training size of 200 (see
Figure 5). As a result of the cross-validation of ML
models, Bayesian Regularized Neural Network has
been selected for further analysis due to its
performance and goodness of fit.
Figure 4: Cross-Validation of Machine Learning Models.
Figure 5: Learning Curves of Machine Learning Models.
Figure 6: Explanations for Ireland 2014 – 2018.
Proxy variables have been identified for countries
with similar profiles and predictions have been
Machine Learning Approach for National Innovation Performance Data Analysis
329

decomposed. As one result the proxy variables ‘Cost
of redundancy dismissal’ and ‘Scientific and
technical publications’ are notable, which have both
a strong positive impact on the top countries’
innovation performance (CHE, SWE, NLD, GBR,
SGP). In Figure 6, the explanations between 2014 and
2018 are exemplarily illustrated. Therefore, key
determinants can be identified that have a positive
and negative effect on innovation output. Comparing
the national feature importance to the global feature
importance, intellectual property receipts is most
important for this cluster in 2018 whereas it has a
negative impact for Ireland. Moreover, ease of
starting a business is most important for Irelands’
innovation output in 2018. Indicators reported by
innovation indexes can therefore not easily be taken
for decision making. Moreover, key determinants for
innovation performance need to be assessed on
national level. Besides the feature importance, the
attribution of this feature to innovation output in
general has been assessed by decomposing the
prediction. Changes in innovation input effect to the
percentage of it attribution the innovation output and
herewith increases or decreases national innovation
performance.
5 CONCLUSIONS
Overall, these results indicate that the machine
learning approach is appropriate to benchmark
national innovation profiles, to identify key
determinants on a cluster as well as on a national level
whilst considering correlating features and long term
effects and the impact of changes in innovation input
(e.g. by governmental decision or innovation policy)
on innovation output can be predicted and herewith
the national innovation performance increase or
decrease.
REFERENCES
Baumgartner, M. and Thiem, A. (2017) ‘Often Trusted but
Never (Properly) Tested: Evaluating Qualitative
Comparative Analysis’, Sociological Methods and
Research, pp. 1–33.
Biecek, P. (2018) ‘DALEX: explainers for complex
predictive models’, ArXiv e-prints. Available at:
https://arxiv.org/abs/1806.08915.
Biecek, P. (2019) ‘ceterisParibus: Ceteris Paribus Profiles’.
Available at: https://cran.r-
project.org/package=ceterisParibus.
Cooper, B. and Glaesser, J. (2011) ‘Paradoxes and pitfalls
in using fuzzy set QCA: Illustrations from a critical
review of a study of educational inequality’,
Sociological Research Online. Durham University,
16(3).
Crespo, N. F. and Crespo, C. F. (2016) ‘Global innovation
index: Moving beyond the absolute value of ranking
with a fuzzy-set analysis’, Journal of Business
Research, 69(11), pp. 5265–5271.
Dosi, G. (1988) Technical change and economic theory.
International Federation of Institutes for Advanced
Study Research Series, no. 6.
Freeman, C. (1987) Technology policy and economic
performance: lessons from Japan, London: Pinter.
Pinter Pub Ltd.
Hajek, P. and Henriques, R. (2017) ‘Modelling innovation
performance of European regions using multi-output
neural networks.’, PLoS ONE. Public Library of
Science, 12(10), pp. 1–21.
Hajek, P., Henriques, R. and Hajkova, V. (2014)
‘Visualising components of regional innovation
systems using self-organizing maps-Evidence from
European regions’, Technological Forecasting and
Social Change, 84.
Izsak, K., Markianidou, P. and Radošević, S. (2013)
‘Lessons from a Decade of Innovation Policy - What
can be learnt from the INNO Policy TrendChart and
The Innovation Union Scoreboard’, Final Report,
European Union, pp. 1–103.
Joliffe, I. T. (2002) Principal Component, Principal
Component Analysis SE - 7. New York : Springer
(Springer series in statistics).
Kane, H. et al. (2014) ‘Using qualitative comparative
analysis to understand and quantify translation and
implementation’, Translation Behavioral Medicine.
Germany: SPRINGER SCIENCE AND BUSINESS
MEDIA, (2), p. 201.
Kassambara, A. and Mundt, F. (2017) ‘factoextra: Extract
and Visualize the Results of Multivariate Data
Analyses’. Available at: https://cran.r-
project.org/package=factoextra.
Kaufman, L. and Rousseeuw, P. J. (1990) ‘Clustering Large
Applications (Program CLARA).’, Finding Groups in
Data: An Introduction to Cluster Analysis, p. 126.
Kuhn, M. (2017) ‘caret: Classification and Regression
Training’. Available at: https://cran.r-
project.org/package=caret.
Leydesdorff, L. (2000) ‘The triple helix: An evolutionary
model of innovations’, Research Policy, 29(2), pp.
243–255.
Liu, Z. et al. (2018) ‘Industrial development environment
and innovation efficiency of high-tech industry:
analysis based on the framework of innovation
systems’, Technology Analysis and Strategic
Management, 30(4), pp. 434–446.
Lundvall, B.-Å. (2004) ‘National Innovation Systems -
Analytical Concept and Development Tool’, DRUID
Tenth Anniversary Summer Conference 2005.
Australia: CARFAX PUBLISHING TAYLOR &
FRANCIS LTD, (1), p. 43.
Maechler, M. et al. (2017) ‘cluster: Cluster Analysis Basics
and Extensions’.
DATA 2019 - 8th International Conference on Data Science, Technology and Applications
330

Mahroum, S. and Al-Saleh, Y. (2013) ‘Towards a
functional framework for measuring national
innovation efficacy’, Technovation. Elsevier, 33(10–
11), pp. 320–332.
Minniti, A. and Venturini, F. (2017) ‘The long-run growth
effects of R&D policy’, Research Policy. Elsevier B.V.,
46, pp. 316–326.
Pedersen, T. L. and Benesty, M. (2018) ‘lime: Local
Interpretable Model-Agnostic Explanations’. Available
at: https://cran.r-project.org/package=lime.
Pençe, I., Kalkan, A. and Çeşmeli, M. Ş. (2018) ‘Estimation
of the Country Ranking Scores on the Global
Innovation Index 2016 Using the Artificial Neural
Network Method’, International Journal of Innovation
and Technology Management. Bucak Zeliha Tolunay
Applied Technology and Business School, Mehmet
Akif Ersoy University, Adem Tolunay Campus: World
Scientific Publishing Co. Pte Ltd, p. 1940007.
R Core Team (2017) ‘R: A Language and Environment for
Statistical Computing’. Vienna, Austria. Available at:
https://www.r-project.org/.
van Rossum, G. and Drake, F. L. (2011) The Python
Language Reference Manual. Network Theory Ltd.
Ryan, J. A. and Ulrich, J. M. (2017) ‘xts: eXtensible Time
Series’. Available at: https://cran.r-
project.org/package=xts.
Staniak, M. and Biecek, P. (2018) ‘Explanations of Model
Predictions with {live} and {breakDown} Packages’,
ArXiv e-prints. Available at:
https://arxiv.org/abs/1804.01955.
Tibshirani, R. and Hastie, T. (2006) ‘Estimating the number
of clusters in a data set via the gap statistics’, Journal
of the Royal Statistical society. Blackwell Publishers,
63(2), pp. 411–423.
Wang, H. and Gong, S. (2017) ‘Research on the Innovation
Evaluation Indexes for Innovation-Oriented City’,
DEStech Transactions on Economics and Management,
(iceme-ebm).
Waskom, M. et al. (2018) ‘mwaskom/seaborn: v0.9.0 (July
2018)’. doi: 10.5281/zenodo.1313201.
Wickham, H. (2016) ggplot2: Elegant Graphics for Data
Analysis. Springer-Verlag New York. Available at:
http://ggplot2.org.
Zeileis, A. and Grothendieck, G. (2005) ‘zoo: S3
Infrastructure for Regular and Irregular Time Series’,
Journal of Statistical Software, 14(6), pp. 1–27.
Machine Learning Approach for National Innovation Performance Data Analysis
331
