
Air-coupled Ultrasonic Inspection with Adaptive Lamb Wave Control
Manfred Sch
¨
onheits
a
, Armin Huber
b
and Philipp G
¨
answ
¨
urger
German Aerospace Center (DLR), Institute of Structures and Design, Augsburg, Germany
Keywords: Non-destructive Testing, Ultrasonic Inspection, Lamb Wave, Automation, Robotics.
Abstract:
Single-sided air-coupled ultrasonic inspection has some beneficial properties compared to water-coupled ul-
trasonic inspection or double-sided ultrasonic testing. The absence of the need for water leads to easier process
handling on the one hand e.g. when manufacturing aircraft components. On the other hand, because the pro-
cess is single-sided, reachability is a minor problem compared to double-sided testing and end-effectors and
fixtures can be designed in a less complex and more compact way. However, the nature of lamb waves requires
that the geometrical relation of the transmitter and the receiver varies during the inspection process. In this
paper, a prototype of an adaptive end-effector is introduced that was developed to implement this requirement
and results of first evaluation tests are presented.
1 INTRODUCTION
Aerospace vehicles are constructed from an in-
creasing amount of carbon composites because
their strength-to-weight ratio compared to traditional
metallic components can yield weight savings that en-
able these vehicles to operate more efficiently. How-
ever, the manufacturing of composites is still very ex-
pensive due to the high amount of manual labor that
is involved and the use of high-performance but also
high-cost prepreg material. Therefore, it is the aim
of the Center for Lightweight Production Technology
(ZLP) of the German Aerospace Center (DLR) to de-
velop automated manufacturing process technology
for large-scale components made from carbon fiber
reinforced plastics (CFRP).
In order to guarantee cost-efficiency, process-
integrated quality assurance based on non-destructive
inspection (NDI) methods is essential. It has been
concluded that air-coupled ultrasonic testing (ACUT)
is a suitable NDI method (Ullmann et al., 2012). A
NDI method has to meet certain key criteria: Fast
measurement speed and data evaluation as well as the
ability to inspect large components. This can only be
achieved through automation of the inspection pro-
cess.
The single-sided ACUT mode, which we have uti-
lized in this work, is based on the excitation of Lamb
waves in a component to be tested. This mode is
a
https://orcid.org/0000-0002-5646-2111
b
https://orcid.org/0000-0002-5694-8293
also referred to as Focused Slanted Reflection Mode
(FSRM). Lamb waves have been used for NDI pur-
poses for many decades. An early description of the
flaw detection of sheets and tubes immersed in water
by means of Rayleigh and Lamb waves was given by
Viktorov already back in 1967 (Viktorov, 1967). Only
a few years later, Luukkala et al. proposed a con-
tactless test method for paper and metal plates based
on Lamb waves (Luukkala et al., 1971; Luukkala
and Meril
¨
ainen, 1973). Many applications have been
established since then, and the advent of compos-
ite materials in automotive and aerospace industries,
which took place in the early 1990s, has added sig-
nificant complexity to the non-destructive testing and
evaluation processes. The ability of guided waves
to propagate many meters in a waveguide is uti-
lized for pipe inspection (Wilcox et al., 2001; Lowe
et al., 1998). They are also used for the inspection
of bonding (Lowe and Cawley, 1994), which is one
of the most challenging tasks, especially in the case
of kissing bonds (Kundu et al., 1998). Other rel-
evant studies concerning NDI and structural health
monitoring (SHM) on composite structures are found
in Refs. (Maslov and Kundu, 1997; Kessler et al.,
2002; Toyama et al., 2003; Su et al., 2006; Diamanti
and Soutis, 2010; Purekar and Pines, 2010; Ramadas
et al., 2011; Cunfu et al., 2013). The air-coupled
version of the guided wave inspection could play an
important role in future production lines. Often, the
presence of a liquid coupling medium is unwanted be-
cause it might inflict damage to unsealed composite
430
Schönheits, M., Huber, A. and Gänswürger, P.
Air-coupled Ultrasonic Inspection with Adaptive Lamb Wave Control.
DOI: 10.5220/0007956904300438
In Proceedings of the 16th International Conference on Informatics in Control, Automation and Robotics (ICINCO 2019), pages 430-438
ISBN: 978-989-758-380-3
Copyright
c
2019 by SCITEPRESS – Science and Technology Publications, Lda. All rights reserved

structures. All of the following researchers have used
the air-coupled variant. Castaings et al. have done
significant work on the single-sided ultrasonic testing
of composites by using Lamb waves (Castaings and
Cawley, 1996; Castaings et al., 1998; Castaings and
Hosten, 2001; Castaings and Hosten, 2008), while
Solodov et al. have used them for transmissive in-
spection (Solodov et al., 2004b; Solodov et al., 2004a;
Solodov et al., 2006).
In order to excite Lamb waves, the ultrasound
transducers must follow a certain orientation with re-
spect to the specimen which we call excitation angle.
This excitation angle depends upon certain properties
of the component, which might change from one lo-
cation to another. Therefore, the inspection process
has to be interrupted and the orientation of the ultra-
sonic transducers must be changed such that the cor-
rect excitation angle is met. In this paper, we present a
prototype of a fully automated, adaptive end-effector
(AEE), which enables the continuous adjustment of
the ultrasonic transducers such that Lamb waves are
excited at optimal efficiency at any location on the
component.
2 PROBLEM DESCRIPTION
A Lamb wave propagating through a plate causes dis-
placement throughout its whole thickness. Since ul-
trasound is reemitted along the propagation path of
the Lamb wave, it can be detected with the receiver.
As depicted in figure 1, both sender and receiver must
be oriented at the same angle with respect to the sur-
face normal when used on a flat specimen. A flaw
causes a change in the displacement amplitude, and
can be detected thereby. A beam shield made of card-
board is mounted between the two transducers to pre-
vent sound propagating directly from the sender to the
receiver. Both transducers can be rotated and moved
horizontally and vertically, but only manually. The
industrial robot scans the specimen while ultrasonic
pulses are triggered such that pairs of 6DOF measure-
ment points and the corresponding ultrasonic data are
generated. By that way, three-dimensional ultrasonic
images of a specimen can be obtained and flaws lo-
calized. However, because the transducers are fixed,
this solution is limited to parts with constant thickness
and zero or constant curvature.
According to Snell’s law, the excitation angle θ
with respect to the surface normal is given by
θ = sin
−1
v
I
v
Lamb
, (1)
where v
I
is the phase velocity of the incident plane
wave and v
Lamb
the phase velocities of the Lamb wave
Figure 1: Conventional end-effector for air-coupled ultra-
sonic inspection by using Lamb waves.
excited in the plate (Castaings and Cawley, 1996).
While v
I
is known, e.g., 343 m/s at room temperature
in air, v
Lamb
is not. v
Lamb
depends upon
• The stiffness of the specimen’s material,
• The layup (fiber orientation and layer thickness)
of the specimen,
• The ultrasonic transducer frequency since Lamb
waves are dispersive.
With the known stiffness matrix and the layup, one
can calculate Lamb wave dispersion diagrams (θ vs.
frequency) for a given propagation direction in the
laminate. A discussion of this procedure is beyond
the scope of this paper. In our previous work, we have
created an interactive software called Dispersion Cal-
culator (DC) with MATLAB
R
(MathWorks, Natick,
MA, USA) for the calculation of Lamb wave disper-
sion diagrams (Huber and Sause, 2018). The stand-
alone software can be downloaded free of charge on
the DLR-homepage
1
.
Real structural parts generally do not have a con-
stant thickness or a homogeneous layup. For an au-
tomated inspection process this means that the nec-
essary poses of the transducers are not constant but
depend on the location. Figure 2 shows a simplified
scenario including a part with a flat surface but vari-
able thickness (indicated by magenta color), which
leads to a variable excitation angle. Even with con-
stant fiber orientation assumed, this would lead to a
change of the required transducer orientation along
the part. Furthermore a surface with variable curva-
ture would also make a dynamic positioning of the
transducers essential.
In order to automate the process, two major com-
ponents are therefore necessary:
1
https://www.dlr.de/bt/en/desktopdefault.aspx/
tabid-2478/11208 read-53373/
Air-coupled Ultrasonic Inspection with Adaptive Lamb Wave Control
431
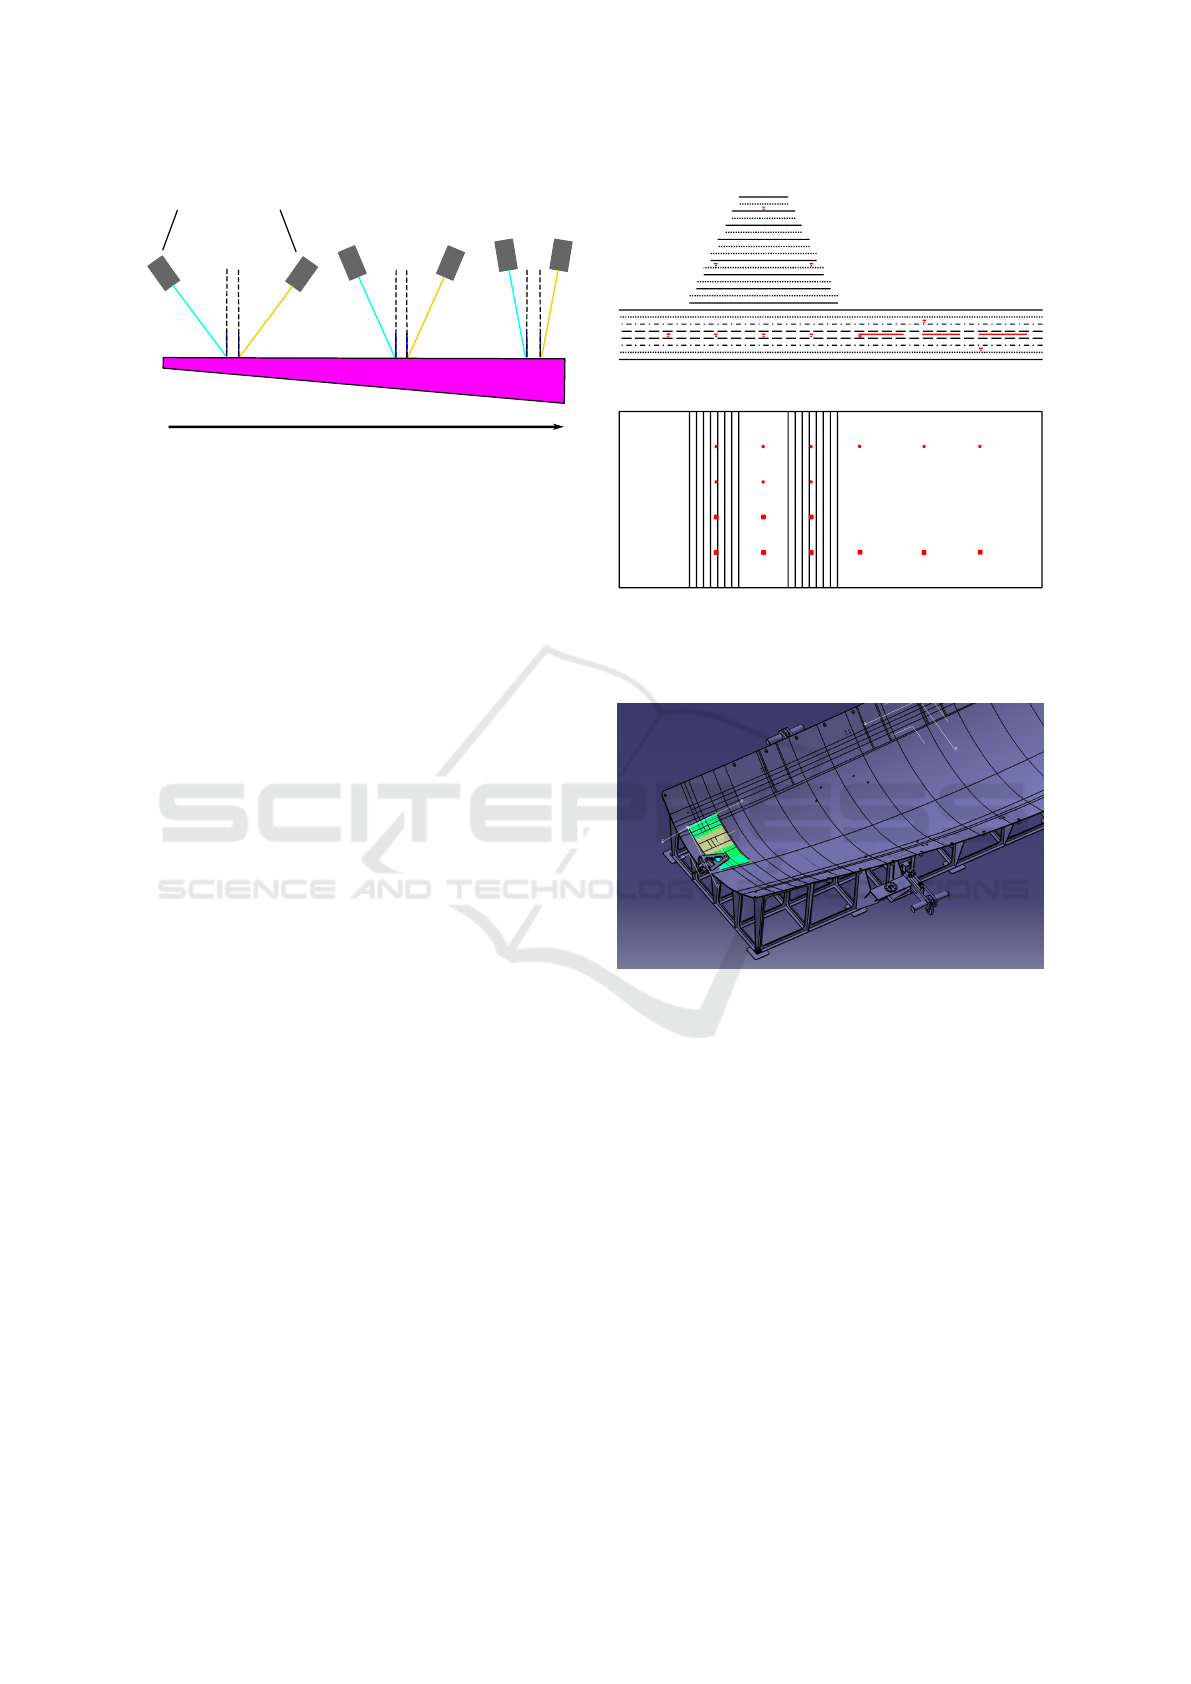
θ
θ
θ
θ
θ
θ
Transmitter
Receiver
Increasing Thickness
Figure 2: Change of excitation angle.
• A kinematic system that allows dynamic position-
ing of the transducers (an adaptive end-effector in
our case)
• A software solution that, given a description of a
part, creates a program for the kinematic system
including the correct poses for the transducers
3 SPECIMEN
To validate the AEE, a testing specimen was de-
signed. The following requirements were defined:
• The specimen should mimic real components and
material used in aircraft.
• It must have all possible features that cause a
change in the excitation angle, namely variable
thicknesses (layup) and curvature.
• Artificial flaws must be inserted into the layup to
enable the quantification of the probability of de-
tection (POD) of the AEE
The specimen was manufactured from
SAERTEX
R
7006919 dry fabric, infiltrated with
RIMR135 resin by vacuum assisted resin infusion.
The fiber volume content is 55 %. A schematic of the
layup is drawn in Figure 3. Figure 3(a) shows a cross
section through the laminate. The base laminate is a
2.2 mm thick, quasi-isotropic layup [0/90/-45/45]
s
. A
step-like reinforcement layup [0/90]
4s
was placed on
top of the base laminate with a maximum thickness
of 4.4 mm. Therefore, the overall laminate thickness
varies between 2.2 and 6.6 mm. Artificial flaws made
of 5×5 and 10×10 mm
2
square pieces of Kapton
R
sheet (DuPont Inc., Wilmington, DE, USA) were
laminated into different depths. As shown in Fig. 4,
the layup was performed in a small area close to the
tail of an aircraft fuselage preform where significant
curvature gradients occur. The specimen is 935 mm
long, 505 mm wide, and has a maximum height of
110 mm. The reinforcing layup covers a length of
420 mm.
(a)
D L R
(b)
Figure 3: Cross sectional view (a) and top view (b) of the
specimen’s layup. Artificial flaws are drawn in red color.
The dimensions are not true to scale.
Figure 4: The layup of the specimen was done in an aircraft
fuselage preform.
4 SOFTWARE TOOLCHAIN
It turned out that relying on commercial software was
not sufficient for programming and controlling a sys-
tem like the AEE, so a software toolchain had to
be developed that provides the missing functionality.
This section discusses our requirements, the short-
comings of commercial software in this respect, and
our solution of the problem.
4.1 Requirements
To obtain a uniform scan of the part, a grid of i mea-
surement points on the specimen surface with the co-
ordinates x
i
,y
i
,z
i
in the base coordinate system needs
to be generated. This must be done based on a digital
ICINCO 2019 - 16th International Conference on Informatics in Control, Automation and Robotics
432
representation of the specimen. These are then used
to create a program for the robotic system. To do so,
they are put in order in such a way that the robot scans
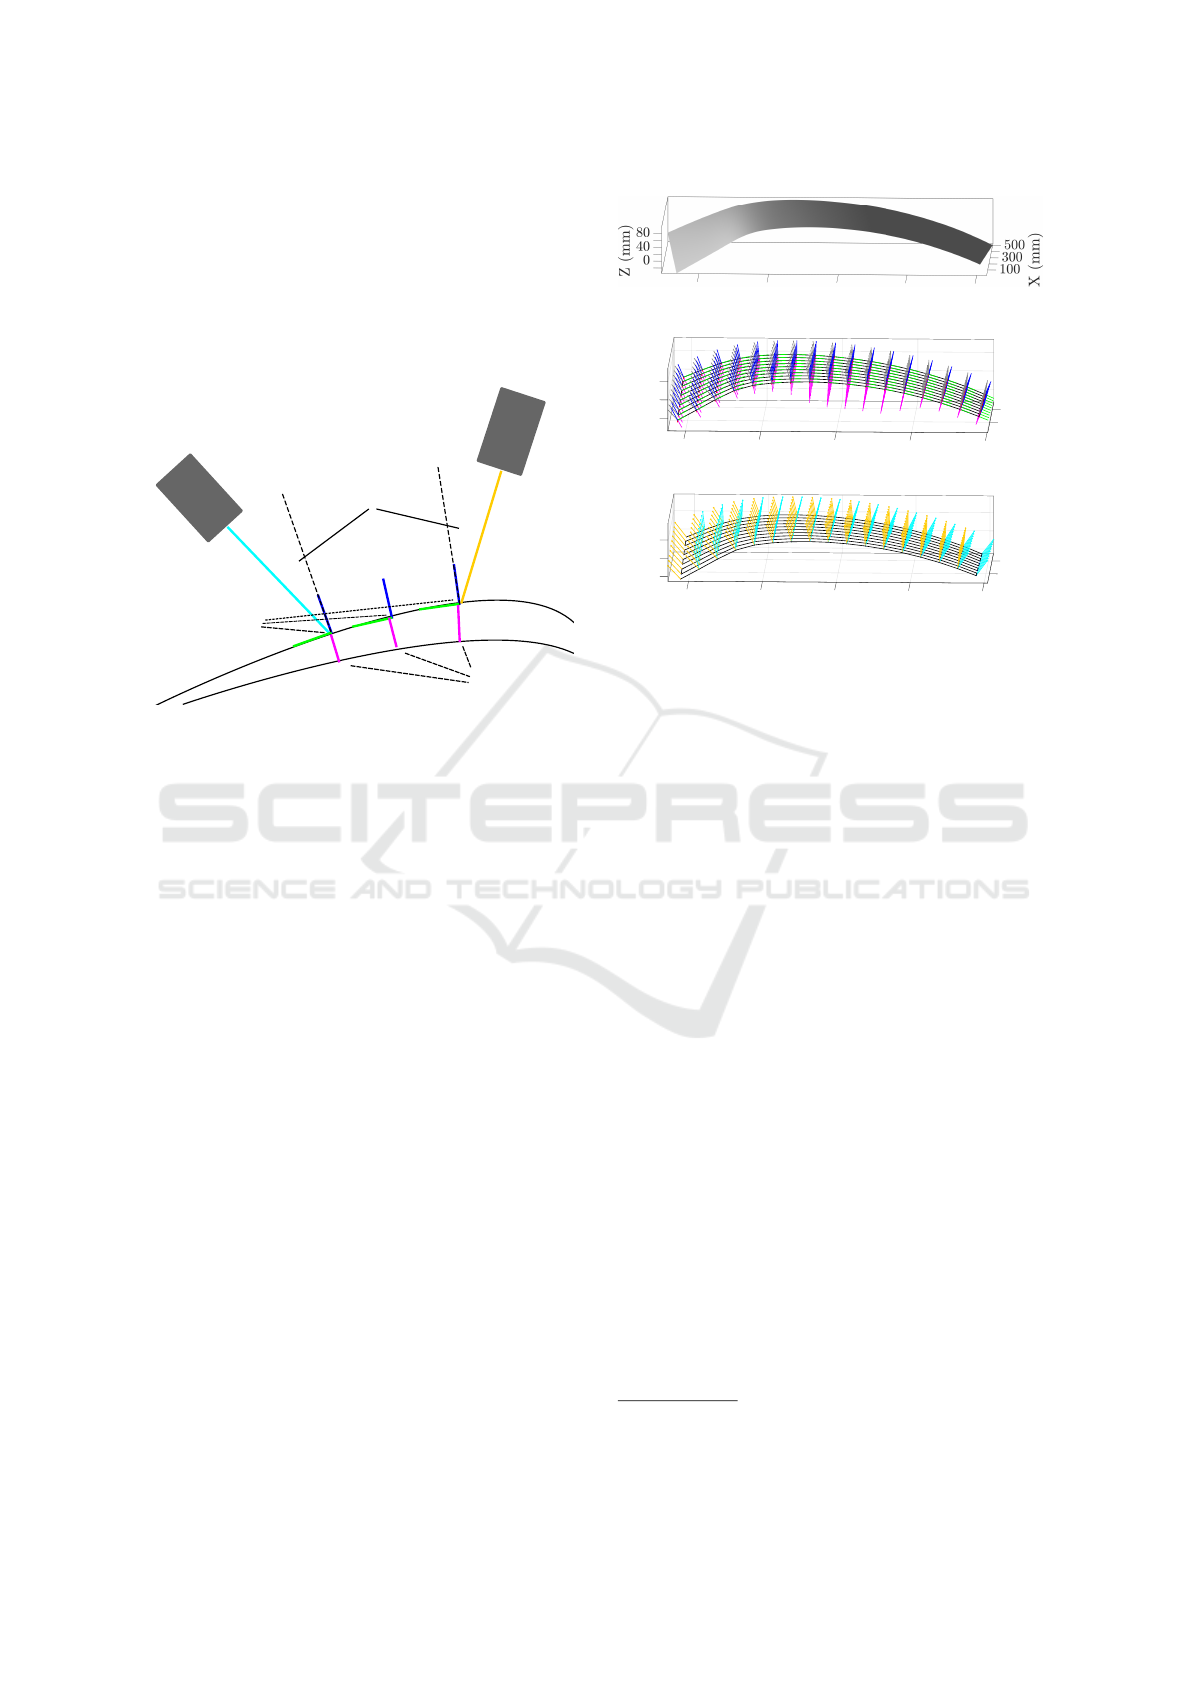
the specimen on a meander-like path. To fully define
the kinematic path for the end-effector, the pose for
both the transmitter and the receiver for each mea-
surement point needs to be determined. Because the
θ
θ
Transmitter
Receiver
Excitation
Angle
Measurement
Grid Points
Thickness
Figure 5: Determination of transmitter and receiver poses.
transducers should not collide with each other or the
specimen, they need to be offset from each other and
the surface. Also, the Lamb wave needs a minimum
length it travels through the part. To determine the
orientation of the ultrasonic heads the excitation an-
gles θ
i
need to be calculated. To enable this, the layup
at each measurement point must be obtained, but this
in turn requires the laminate thicknesses d
i
. The dis-
tances which the ultrasound propagates in air and in
the laminate also must always kept constant. The re-
sult is a list of transmitter-receiver pairs on the grid,
depicted in figure 5.
4.2 State-of-the-Art
Usually computer-aided design (CAD) and of-
fline programming (OLP) tools like CATIA
TM
,
DELMIA
TM
, and FASTSURF
TM
(Dassault Syst
`
emes,
V
´
elizy-Villacoublay, France) are used for the path
planning of robots in an industrial context. Here,
one has a digital representation of the robotic environ-
ment, and the path as well as orientation of the end-
effector can be generated based on the specimen’s
surface. However, the required additional kinemat-
ics of the AEE as well as the algorithm-driven vari-
ability of the transducer poses cannot be modeled
neither programmed with these products in a suffi-
cient way. Furthermore, the possibilities to generate
the measurement grid on the specimen as well as the
layup and thickness determintation d
i
are insufficient
(a)
X (mm)
400
200
0
200
Y (mm)
400
600
End
Start
800
50
0
100
Z (mm)
(b)
X (mm)
400
200
0
200
Y (mm)
400
600
End
Start
800
50
100
0
Z (mm)
(c)
Figure 6: Offline programming in MATLAB
R
. The STL
file is loaded and fitted (a). The path, tripods, and excitation
angles are generated (b). Then, the positions and orienta-
tions of the ultrasonic transducers are determined (c). In
this example, a 50 mm grid is generated whereas a spacing
of 2 mm is more realistic in a real measurement.
in CATIA
TM
.
For the calculation of θ
i
, we purchased DIS-
PERSE
2
(Imperial College London, London, UK).
DISPERSE has been developed since the early 1990s
by Lowe and Pavlakovic, and was used for the valida-
tion of DC. DISPERSE is the leading software in its
field and has some features not included in DC. How-
ever, it has a significant price while only available
as a node-locked license and currently cannot calcu-
late laminates containing more than 64 layers. DIS-
PERSE also lacks an API, which renders us unable to
automate the calculation of θ
i
as we potentially have
to calculate high numbers of sample points. For in-
stance, a square grid with 2 mm spacings on the spec-
imen has more then 10
5
points. In DISPERSE you
must enter each layup manually, calculate the com-
plete dispersion diagram, and then extract the excita-
tion angle of A
0
at the transducer’s frequency. These
drawbacks have been one of the reasons why DC was
created.
4.3 Solution
The four different software solutions mentioned in
Section 4.2 which had been considered for the soft-
2
http://www.imperial.ac.uk/non-destructive-evaluation/
products-and-services/disperse
Air-coupled Ultrasonic Inspection with Adaptive Lamb Wave Control
433
ware tool chain initially were found insufficient later.
Therefore, one task was to overcome their deficien-
cies and solve them by own implementation. Our tool
chain uses two software componets currently, namely
CATIA
TM
and MATLAB
R
.
The basis is the CAD model of the specimen in
CATIA
TM
. A separate tesselation of the top and bot-
tom surfaces of the specimen is performed and the
result is exported into two STL files. These files can
be loaded into MATLAB
R
. The top surface of the
specimen is shown in Fig. 6(a). The vertices of the
top surface are used as an input for the built-in MAT-
LAB
R
Curve Fitting app (it requires the Curve Fit-
ting Toolbox) to obtain a three-dimensional fit. Then
the spacing of the measurement grid is defined and
whether the transducers should move in lines paral-
lel to the x axis or y axis (called ”sweep direction”
below). Square grid coordinates x
i
,y
i
are generated
in the x-y plane, covering the x-y range of the point
cloud of the top surface. The grid coordinates are or-
dered in such a manner that alternating sweeps in the
positive and negative sweep direction are performed.
By evaluating the fitting function at x
i
,y
i
, the yet miss-
ing third coordinates z
i
can be obtained. The result-
ing path is indicated by the black lines in Figs. 6(b)
and 6(c). At each measurement grid point x
i
,y
i
,z
i
, the
tripods~n
i
,
~
b
i
,
~
t
i
can now be calculated indicated by, re-
spectively, blue, red, and green lines in Fig. 6(b).
Next, the thicknesses d
i
are determined by prob-
ing. The algorithm uses the surface normals ~n
i
, seeks
the vertex of the lower surface, which is pierced by
~n
i
, and calculates the normal distance d
i
between this
vertex and the corresponding grid point. The thick-
nesses d
i
are indicated by magenta colored lines in
Fig. 6(b) (their lengths are scaled up by a factor of
ten for clarity). With the now known d
i
, the local
layup can be obtained as follows. It is known that the
specimen has twenty-four layers where it is 6.6 mm
thick. Hence, the number of layers at any given mea-
surement point from d
i
can be deduced. Then, from
the sequence of layer orientations in the “maximum”
layup, the local layup at the ith measurement point
can be obtained.
For the θ
i
calculation, the basic algorithm used by
DC was used. Therein, depending on the sweep di-
rection, the propagation of Lamb waves is supposed
to be either along the 0 or 90
◦
direction of the layup.
Instead of complete dispersion diagrams θ
i
( f ), where
f covers a broad frequency range, only θ
i
(200kHz)
for the A
0
Lamb wave are calculated.
The excitation angles θ
i
(200kHz) vary between
14.4
◦
where the specimen is 2.2 mm thick and 13.2
◦
where it is 6.6 mm thick. The excitation angles are
indicated by gray lines in Figure 6(b).
Now that that the coordinate system frames and
excitation angles for each measurement point are
known, the transmitter and receiver poses can be cal-
culated. This is done by applying a local coordinate
system displacement that adjusts the poses of the ul-
trasonic heads according to the excitation angle and
fixed distance offsets on and from the surface (see
Figure 5 ). Throughout the experiments discussed in
this paper, 50 mm for both offsets are used. The final
prepared data set is called the ”excitation angle map”
(EAM).
5 ROBOTIC SETUP
The process requires that the position of the transmit-
ter and the receiver with respect to each other varies
over time according to the EAM. That is why a sin-
gle kinematic is not sufficient to implement the pro-
cess. At the DLR site in Augsburg there are a num-
ber of industrial-grade robot cells available. The idea
to implement the process was to use one of the in-
dustrial robots and attach a second smaller kinematic
arm. The industrial robot serves as a kinematic for
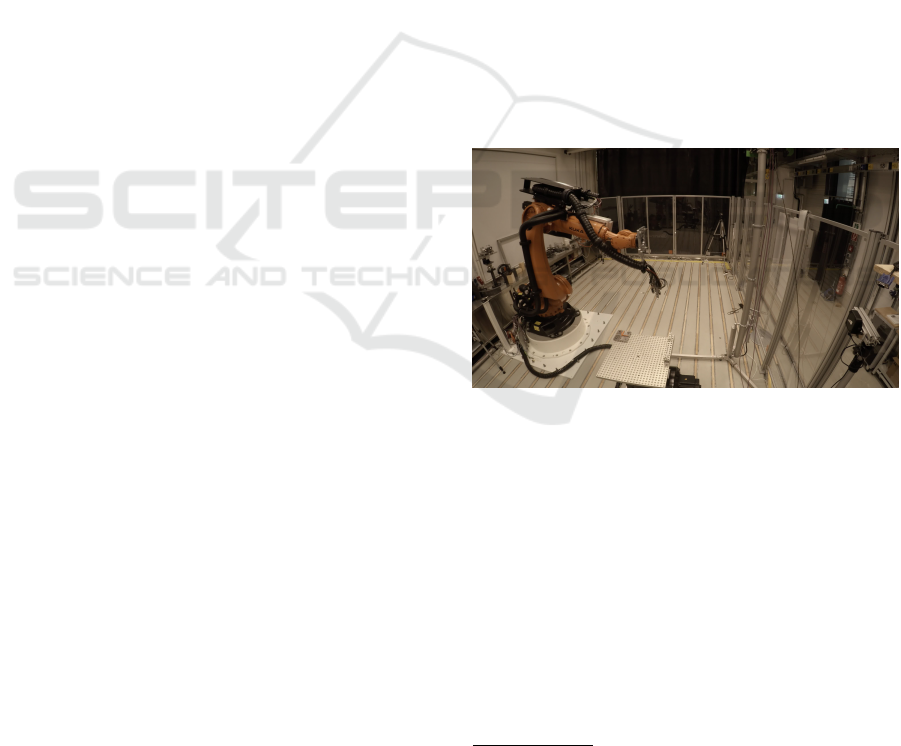
Figure 7: Robot cell.
positioning the transmitter, while the second attached
arm is responsible for positioning the receiver. The
robotic cell that served as a basis for evaluation of the
adaptive testing is shown in figure 7. The robot is a
KUKA KR120 2700 HA run by a KRC4 controller.
3
5.1 End-effector Design
First preliminary tests have been conducted with a
KUKA LBR iiwa as a second kinematic attached to
the KR120, as this robot arm was available at the DLR
site in Augsburg already.
4
These tests have been
promising, that is why a dedicated end-effector was
3
https://www.kuka.com/en-de/products/robot-
systems/industrial-robots/kr-quantec
4
https://www.kuka.com/en-de/products/robot-
systems/industrial-robots/lbr-iiwa
ICINCO 2019 - 16th International Conference on Informatics in Control, Automation and Robotics
434
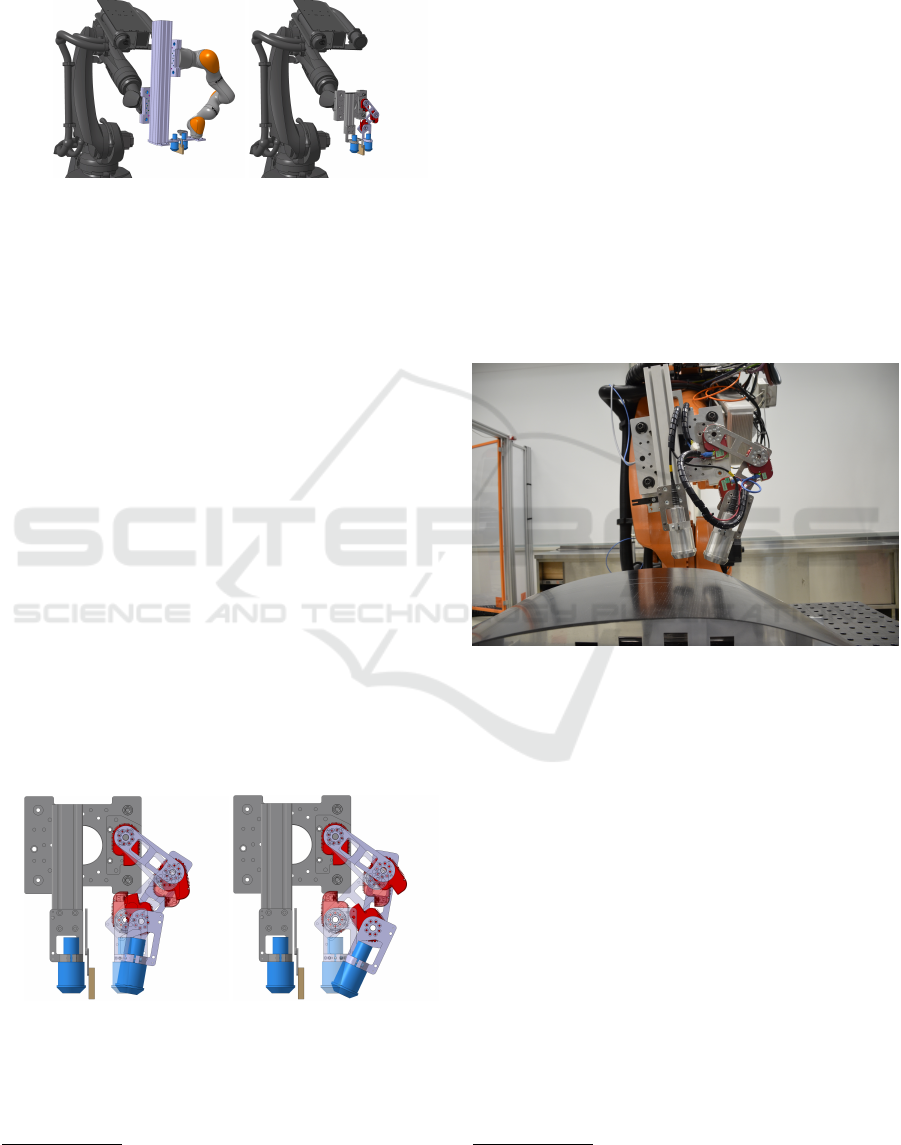
designed. The new design should be as compact and
as simple as possible, so it was decided to reduce the
functionality to the necessary minimum (see figure 8).
Figure 8: End-effector with iiwa (left) and new end-effector.
It was found sufficient that the ultrasonic transduc-
ers can move in a planar way to each other with addi-
tional rotation, so at least three degrees of freedom are
necessary. Basically this can be implemented as e.g. a
combination of two prismatic joints and one revolute
joint or three coplanar revolute joints. The latter has
been chosen because it was assessed that this way it
is easier to build a compact, collision-free design with
the neccessary workspace. We had been provided
with three X-Series actuators by HEBI
5
Robotics
TM
.
The end effector consists of a quick-release plate
which is a standard at the DLR Augsburg, an alu-
minum profile and the three X-Series actuators. The
actuators were mounted on aluminum links as close as
possible to each other without collision. The default
position of the static and the moving ultrasonic trans-
ducers are parallel to each other and the two links in a
45-90-45 degree position. With this default position,
a widely adjustable angle between the transducers is
possible. One advantage of this configuration is re-
ducing the torque on axis 1 and 2 while providing a
good workspace. An option to mount a direct sound
shield (like the cardboard shield shown in figure 1)
was added. Figure 9 shows the design.
Figure 9: Re-designed end effector.
To increase the precision of the end-effector, all
of the fixed parts as well as the quick release plate
of the end effector were equipped with counterbores
that can be measured with a LEICA
TM
laser tracker
5
https://www.hebirobotics.com/
that is available at the DLR Augsburg site. This way
the intrinsic dimensions of the end-effector could be
calibrated with high precision, merely leaving the po-
sition accuracy of the actuators as a source of impre-
cision.
Four markers that help to calibrate the part in the
robot cell have been addded to the corners of the spec-
imen part described in section 3. To position the spec-
imen part for the process, a framework to mount the
specimen on had to be manufactured. The framework
was derived in CATIA from the lower face of the part
and produced on a RIDDER
6
WariCut waterjet cut-
ter. This was also used on the waterjet cutter for trim-
ming the specimen. With this form fitting framework,
it is easy to place the specimen precisely on a welding
table in front of the robot repeatable and so it is not
necessary to recalibrate its position after removing it.
The framework and the specimen are shown in figure
10.
Figure 10: Specimen mounted on the framework and as-
sembled end-effector (direct sound shield not mounted).
5.2 Process Control
To make the process work, two main aspects had to
be taken into consideration:
• The KUKA robot and the HEBI arm have to fol-
low the trajectory defined by the transmitter / re-
ceiver poses as waypoints
• The trajectories need to be synchronized in a way
so that both robots reach each waypoint at the
same time
For the following experiments, a master-slave-
principle was implemented: The transmitter is
mounted on the KUKA robot that moves along the
specimen. The receiver is mounted on the HEBI
arm, which adjusts itself according to the position of
the transmitter. In order to generate a trajectory for
the KUKA robot, a KRL (KUKA Robot Language)
6
https://www.ridder.de/
Air-coupled Ultrasonic Inspection with Adaptive Lamb Wave Control
435
robot program for its robot controller gets generated
from the calculated transmitter poses. This is done
by a KRL generator that was implemented as part of
our MATLAB toolchain discussed earlier (Section 4).
The HEBI robotics API includes a generic kinemat-
ics solver, but for our purpose a forward and inverse
kinematic solver was implemented specifically for our
arm configuration. The poses for the HEBI arm also
get generated from MATLAB as a CSV
7
file.
The robot controller sends the transmitter pose
and the current waypoint number to a PC in realtime
over the KUKA robot sensor interface (RSI) in a 4 ms
(≡ 250 Hz ) cycle. The PC uses the transmitter pose
and the waypoint number to interpolate the receiver
pose in realtime and uses the HEBI API to replan the
arm trajetory in realtime accordingly. The feedback
of the HEBI arm runs at a 5 ms (≡ 200 Hz ) cycle.
6 EXPERIMENTAL EVALUATION
As a first step, a set of parameters for the ultrasound
device was determined experimentally. This was done
by moving the end-effector across the part with man-
ual control and adjusting the settings of the ultrasound
device so that the measured signal was reasonable in
terms of amplitude, phase and other factors. Once a
good set of parameters was found, it was kept con-
stant for all the following tests. Instead of cardboard,
a piece of EPDM
8
rubber was used as a direct sound
shield.
Throughout all the tests, the trajectory of the
KUKA robot was generated from the calculated trans-
mitter poses, i.e. the pose of the transmitter can be
assumed to be correct all the time. The speed of the
KUKA was set to 100 mm/s. Then the following tests
have been done.
1. Keep the receiver pose in a configuration that is
correct for the thick part in the middle of the spec-
imen, scan the whole part with the receiver in this
configuration
2. Keep the receiver pose in a configuration that is
correct for the area with the strongest curvature,
scan the whole part with the receiver in this con-
figuration
3. Scan the whole part using the adaptive process,
with the receiver adjusting its pose continuously
Test 1 and 2 basically mimic a non-adaptive end-
effector (like the conventional end-effector shown in
figure 1) with the transmitter and receiver being in a
fixed configuration to each other.
7
comma separated value
8
ethylene propylene diene monomer
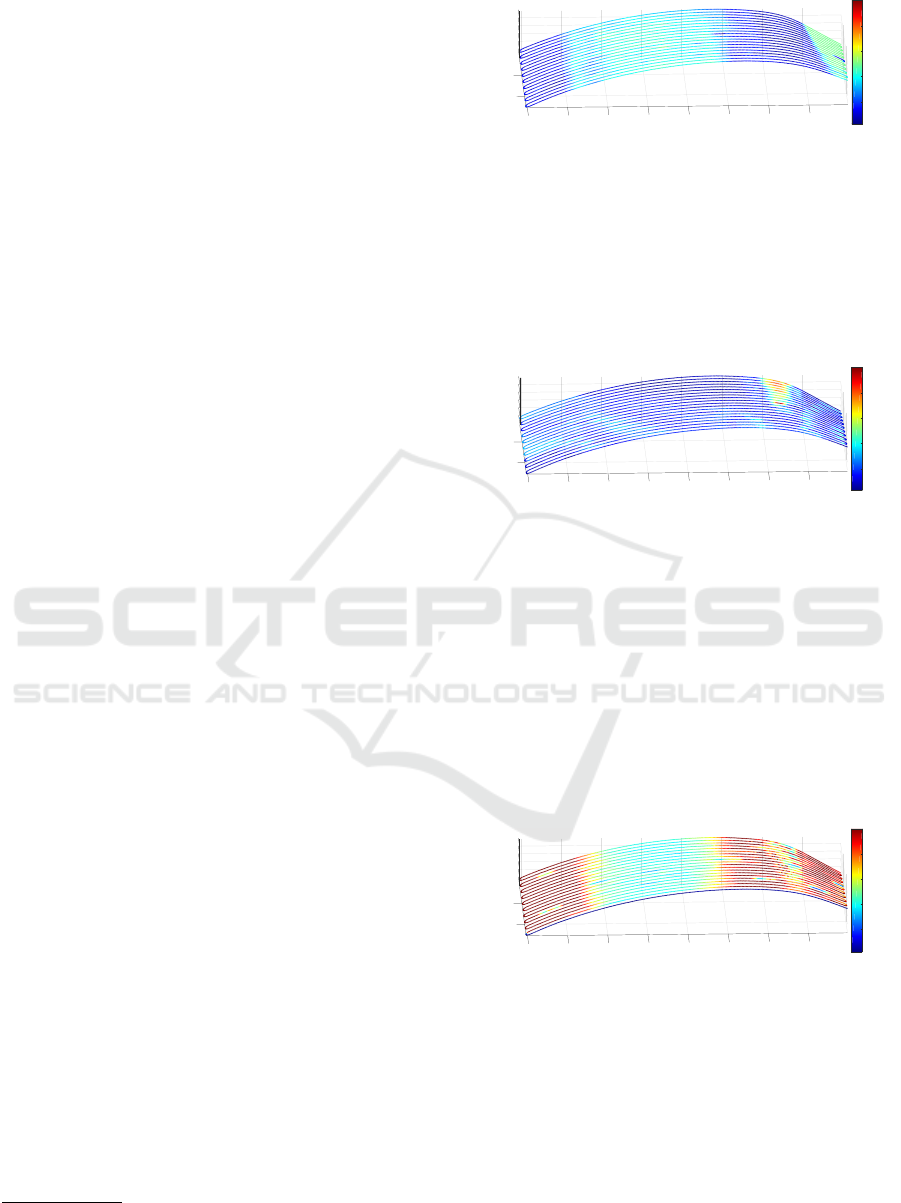
700
600
500
Y (mm)
400
300
200
100
0
0
40
80
400
200
Z (mm)
X (mm)
Amplitude
0.2
0.4
0.6
0.8
Figure 11: Result with receiver pose adjusted to thickest
area.
Figure 11 shows the result of test 1. As expected,
a reasonable amplitude can mainly be observed in the
thick area of the part. The amplitude is not at a max-
imum, which is because the power settings initially
had to be set to a lower level that does not generate
overdrive in the thinner areas.
700
600
500
Y (mm)
400
300
200
100
0
0
40
80
400
200
Z (mm)
X (mm)
Amplitude
0.2
0.4
0.6
0.8
Figure 12: Result with receiver pose adjusted to strongest
curvature.
The result of test 2 is depicted in figure 12. One
can see that a significant amplitude gets detected in
the strongly curved area. But because the pose of the
receiver is incorrect for other areas of the specimen,
no usable signal can be observed there.
The result of test 3, using the adaptive process,
is shown in figure 13. One can see that generally a
signal can be obtained throughout the whole surface
area. A less strong amplitude can be observed in the
thicker area, which is expected. This result confirms
700
600
500
Y (mm)
400
300
200
100
0
0
40
80
400
200
Z (mm)
X (mm)
Amplitude
0.2
0.4
0.6
0.8
Figure 13: Result of the adaptive process.
that the adaptive process generally is working accord-
ing to our assumptions.
However, there is still a lot of aspects to investi-
gate and a lot of room for improvement. For instance,
the precision is still quite coarse and the flaw detec-
tion not sufficiently reliable. Some flaws show up in
the scan (see figure 13), some do not. Also the influ-
ence of varying the process parameters has not been
investigated in detail. Multiple factors for improve-
ment have been identified:
ICINCO 2019 - 16th International Conference on Informatics in Control, Automation and Robotics
436

Direct Sound Shield: The shield built into the end-
effector is mounted in a fixed position. In some areas
of the part, a little gap between the surface and the part
could be observed, allowing sound directly travelling
from the transmitter to the receiver, influencing the
lamb wave amplitude detection.
Lamb Wave Propagation Length: Fixed lengths of
50 mm for the offsets on and from the surface were
used. While the distance from the surface could be re-
duced, the transducers cannot be moved more closely
together because of their size. This causes the flaws
to appear ”stretched” along the sweep direction.
Process Control Accuracy: So far, no in-depth tests
have been conducted how accurate the process con-
trol system works, i.e. how precise the transducers
follow the waypoints and how well their trajectories
are synchronized.
7 CONCLUSIONS AND FUTURE
WORK
In this paper, we have introduced an approach for air-
coupled ultrasonic inspection through adaptive lamb
wave control. A software toolchain to fully calcu-
late and determine the adaptive process was devel-
oped. An adaptive end-effector was designed for ex-
perimental evaluation. For this purpose, a specimen
part was manufactured.
It was possible to verify the principle and the
toolchain as well as the adaptive end-effector were
successfully tested. While the process was found to
be working generally, still a lot of room for improve-
ment exists. Future work could include improving the
hardware such as the direct sound shield. Further-
more, diffent combinations of ultrasonic heads and
other specimens could be examined. Also, a sophisti-
cated analysis of the process control system could be
revealing.
ACKNOWLEDGEMENTS
We would like to thank HEBI Robotics
9
for provid-
ing us a set of X-Series Actuators for the experimental
evaluation.
REFERENCES
Castaings, M. and Cawley, P. (1996). The generation, prop-
agation, and detection of Lamb waves in plates us-
9
https://www.hebirobotics.com/
ing air-coupled ultrasonic transducers. J. Acoust. Soc.
Am., 100(5):3070–3077.
Castaings, M., Cawley, P., Farlow, R., and Hayward, G.
(1998). Single sided inspection of composite mate-
rials using air coupled ultrasound. J. Nondestr. Eval.,
17(1):37–45.
Castaings, M. and Hosten, B. (2001). Lamb and SH
waves generated and detected by air-coupled ul-
trasonic transducers in composite material plates.
NDT&E Int., 34:249–258.
Castaings, M. and Hosten, B. (2008). Ultrasonic guided
waves for health monitoring of high-pressure compos-
ite tanks. NDT&E Int., 41:648–655.
Cunfu, H., Hongye, L., Zenghua, L., and Bin, W. (2013).
The propagation of coupled Lamb waves in multi-
layered arbitrary anisotropic composite laminates. J.
Sound Vib., 332:7243–7256.
Diamanti, K. and Soutis, C. (2010). Structural health mon-
itoring techniques for aircraft composite structures.
Prog. Aeronaut. Sci., 46:342–352.
Huber, A. M. A. and Sause, G. R. (2018). Classification
of solutions for guided waves in anisotropic compos-
ites with large numbers of layers. J. Acoust. Soc. Am.,
144(6):3236–3251.
Kessler, S. S., Spearing, S. M., and Soutis, C. (2002).
Damage detection in composite materials using Lamb
wave methods. Smart Mater. Struct., 11:269–278.
Kundu, T., Maji, A., Gosh, T., and Maslov, K. (1998). De-
tection of kissing bonds by Lamb waves. Ultrasonics,
35:573–580.
Lowe, M. J. S., Alleyne, D. N., and Cawley, P. (1998). De-
fect detection in pipes using guided waves. Ultrason-
ics, 36:147–154.
Lowe, M. J. S. and Cawley, P. (1994). The applicability
of plate wave techniques for the inspection of adhe-
sive and diffusion bonded joints. J. Nondestr. Eval.,
13(4):185–200.
Luukkala, M., Heikkila, P., and Surakka, J. (1971). Plate
wave resonance - A contactless test method. Ultra-
sonics, 9(4):201–208.
Luukkala, M. and Meril
¨
ainen, P. (1973). Metal plate testing
using airborne ultrasound. Ultrasonics, 11(5):218–
221.
Maslov, K. and Kundu, T. (1997). Selection of Lamb modes
for detecting internal defects in composite laminates.
Ultrasonics, 35:141–150.
Purekar, A. S. and Pines, D. J. (2010). Damage detection in
thin composite laminates using piezoelectric phased
sensor arrays and guided Lamb wave interrogation. J.
Intell. Mater. Syst. Struct., 21:995–1010.
Ramadas, C., Balasubramaniam, K., Joshi, M., and Krish-
namurthy, C. V. (2011). Sizing of interface delami-
nation in a composite T-joint using time-of-flight of
Lamb waves. J. Intell. Mater. Syst. Struct., 22:757–
768.
Solodov, I., Pfleiderer, K., Gerhard, H., and Busse, G.
(2004a). Nonlinear acoustic approach to material
characterisation of polymers and composites in tensile
tests. Ultrasonics, 42:1011–1015.
Air-coupled Ultrasonic Inspection with Adaptive Lamb Wave Control
437

Solodov, I., Pfleiderer, K., Gerhard, H., Predak, S., and
Busse, G. (2006). New opportunities for NDE with
air-coupled ultrasound. NDT&E Int., 39(3):176–183.
Solodov, I., Stoessel, R., and Busse, G. (2004b). Material
characterization and NDE using focused slanted trans-
mission mode of air-coupled ultrasound. Res. Nonde-
str. Eval., 15(2):65–85.
Su, Z., Ye, L., and Lu, Y. (2006). Guided Lamb waves for
identification of damage in composite structures: A
review. J. Sound Vib., 295:753–780.
Toyama, N., Noda, J., and Okabe, T. (2003). Quantitative
damage detection in cross-ply laminates using Lamb
wave method. Compos. Sci. Technol., 63:1473–1479.
Ullmann, T., Shi, Y., Rahner, N., Schm
¨
ucker, M., Fey, P.,
Busse, G., and Becker, S. (2012). Quality Assurance
for the Manufacturing of Oxide Fiber Reinforced Ce-
ramic Composites for Aerospace Applications. In 4th
International Symposium on NDT in Aerospace, pages
1–11.
Viktorov, I. (1967). Rayleigh and Lamb Waves: Physical
Theory and Applications. Plenum, New York.
Wilcox, P. D., Lowe, M. J. S., and Cawley, P. (2001). Mode
and transducer selection for long range Lamb wave
inspection. J. Intell. Mater. Syst. Struct., 12:553–565.
ICINCO 2019 - 16th International Conference on Informatics in Control, Automation and Robotics
438
