
Unsupervised Topic Extraction from Twitter: A Feature-pivot
Approach
Nada A. GabAllah
a
and Ahmed Rafea
b
Computer Science and Engineering Dept., The American University in Cairo, AUC Avenue, New Cairo, Egypt
Keywords: Topic Extraction, Clustering, Twitter, Feature-pivot.
Abstract: Extracting topics from textual data has been an active area of research with many applications in our daily
life. The digital content is increasing every day, and recently it has become the main source of information in
all domains. Organizing and categorizing related topics from this data is a crucial task to get the best benefit
out of this massive amount of information. In this paper we are presenting a feature-pivot based approach to
extract topics from tweets. The approach is applied on a Twitter dataset in Egyptian dialect from four different
domains. We are comparing our results to a document-pivot based approach and investigate which approach
performs better to extract the topics in the underlying datasets. By applying t-test on recall, precision, and F1
measure values for both approaches on different datasets from different domains we confirmed our hypothesis
that feature-pivot approach performs better in extracting topics from Egyptian dialect tweets in the datasets
in question.
1 INTRODUCTION
The need for automatic categorization and extraction
of topics is increasing everyday with the increase of
the digital content in all domains. Topic detection and
tracking was an idea presented back in the 90’s in
DARPA, the US Government Defense Advanced
Research Projects Agency (Allan, 2002). This
research area has been active since then and increased
with the widespread of social media. Between
expressing thoughts, reporting news, reporting
problems, sharing photos and life events, social media
has become a part of our daily life. We can’t ignore
the role of social media in all domains of life, starting
from our basic needs like grocery shopping till
sophisticated business, all care about social media
effect. Twitter is a very popular social media platform
because of its ease of use, short messages concluding
what is happening right now instead of long posts.
Also, the pervasiveness of all social media on mobile
phones and other handheld devices, made it more
available.
Topic detection and extraction are concerned with
detecting trending topics and extract titles or set of
a
https://orcid.org/0000-0001-7867-0029
b
https://orcid.org/0000-0001-8109-1845
1
https://github.com/nadaaym/Topic-extraction-data.git
keywords representing these topics. This research
area can be categorized into three main approaches;
document-pivot approach, feature-pivot approach
and probabilistic approaches (Alkhamees and Fasli,
2016). The document-pivot approach relies on
clustering related documents together representing
the topics (Dai and Sun, 2010),(Dai et al.,
2010),(Ozdikis et al., 2017),(Hasan et al.,
2018),(Pradhan et al., 2019), while feature-pivot
approach is based on grouping related features
together representing the topics (Aiello et al., 2013).
In this research we are presenting an algorithm
based on feature-pivot approach. The algorithm group
features together based on their co-occurrence’s
frequency across the dataset. We are using Egyptian
dialect Twitter datasets from different domain of
different sizes. The results are compared to a
document-pivot approach presented in (Rafea and
GabAllah, 2018a) by using the data provided
1
.
The rest of the paper is structured as follows: the
related work is presented in the second section. The
third section includes the methodology we
implemented. Results are presented in section four.
Finally, we conclude our findings and our future work
in the fifth section.
GabAllah, N. and Rafea, A.
Unsupervised Topic Extraction from Twitter: A Feature-pivot Approach.
DOI: 10.5220/0007959001850192
In Proceedings of the 15th International Conference on Web Information Systems and Technologies (WEBIST 2019), pages 185-192
ISBN: 978-989-758-386-5
Copyright
c
2019 by SCITEPRESS – Science and Technology Publications, Lda. All rights reserved
185

2 RELATED WORK
Feature-pivot approach is quite related to topic
models used in natural language processing, as it is
based on statistical models where a set of terms are
extracted to represent the topics across a set of
documents. The common idea most techniques apply
is by first identifying trending terms then group those
terms together according to their co-occurrence
across the documents. Due to the limited number of
words in a tweet, this approach was applied by many
researchers on Twitter datasets.
Emerging topics was detected in (Cataldi et al.,
2010) by taking into consideration the tweet posting
time and its growth/decay in a certain time window.
The author of the tweet is also considered as a feature
for better grouping of related tweets together. Terms
that suddenly appear with high frequency are called
bursty terms, ‘TwitterMonitor’ in (Mathioudakis and
Koudas, 2010) is used to detect them and identifying
topics by clustering those terms according to their
probabilistic co-occurrence frequency. A post
processing phase is also considered to enhance the
visualization of the results by including more
information like geo-location, and sources of news.
Four feature-based techniques are presented in
(Aiello et al., 2013) and their results are compared
against a document-pivot approach as a baseline. The
first technique is based on Structural Clustering
Algorithm for Networks (SCAN) (Xu et al., 2007) for
clustering terms together and is called Graphic
feature-pivot. The terms are represented as the nodes
of the graph. Nodes sharing similarities are grouped
and called a community. A node connected to more
than a community is called a hub. The communities
in the graph are the topics. Related topics can be
clustered together according to the number of hubs
connecting them. Frequent pattern mining (FPM) is
the second technique which is based on pairwise co-
occurrence between unigrams. Soft FPM (SFPM) is
the third technique which is an extension to the FPM
technique that groups a set of co-occurring unigrams
instead of pairs of unigrams. BNgram is the fourth
technique which is based on considering n-gram co-
occurrences not only unigrams. All these techniques
are applied to three datasets from Twitter during three
major events including sports, politics and a social
event in the USA. The performance of each technique
was not consistent over the three datasets, this is can
be related to the nature of the events as the structure
and coherency of topics are different across different
domains.
Regarding the Arabic language, the amount of
research in this area doesn’t cope with the amount of
Arabic content on the web, a survey of recent
techniques applied on Arabic corpora is presented in
(Rafea and GabAllah, 2018b). A feature-pivot based
approach applied to detect bursty features from
Arabic Tweets is presented in (Hammad and El-
Beltagy, 2017). The technique presented is based on
TFIDF, entropy and stream chunking. Egyptian
tweets were collected during the period between May
and December 2015. The technique could capture
bursty terms related to the event happening during
that time interval in real life.
3 METHODOLOGY
The extracted topics are represented using a set of
keywords. The keywords are fit together based on the
observation that keywords of the same topic tend to
appear together in documents about that topic. The
extracted keywords can be unigrams, bigrams, or
trigrams. In this paper we are using unigrams as from
our observations we noted that in Egyptian tweets,
users tend to use single words or hashtags (we
consider hashtag as one word), and referring to events
using different words that may not appear as bigrams
and trigrams in each tweet related to the topic.
The following steps are carried to extract
significant unigrams, their associated tweets that
these unigrams occur in, and the frequent common
unigrams co-occurring with the significant unigrams.
Algorithm 1 of content similarity is applied
afterwards to combine significant unigrams together
into topics.
1. The tweets collected over a specific time period are
preprocessed by removing stop words, punctuation
marks (‘_’ is not removed to keep the hashtag as a
unigram), mentions and account names of the
author of the tweet if it appears in the tweet.
2. The set of tweets is tokenized and all unigrams (
are extracted.
where n is
number of unigrams.
3. Calculate average frequency (θ
1
) of all unigrams
according to equation 1.
(1)
where:
is the frequency of unigram
in the data set and n is the number of unigrams in
the data set.
4. From that set of unigrams, get unigrams with
frequency more than or equal to the average
frequency (θ
1
) these unigrams are put in a set
called the significant unigrams
WEBIST 2019 - 15th International Conference on Web Information Systems and Technologies
186

and s is the number of
significant unigrams. Unigrams are ordered in
descending order according to their frequency.
5. For each significant unigram , get the set of
associated tweets (
) where this unigram occurs.
Set of total set of tweets
,
where is the number of significant unigrams.
6. For each set of associated tweets, the tweets are
tokenized to unigrams
and
proportional frequency is calculated for each
unigram according to equation 2.
(2)
Where:
is the proportional frequency of
the unigram
extracted from the set of
associated tweets (
), and is the number of
unigrams in a set of associated tweets (Parikh and
Karlapalem, 2013).
7. For each set of associated tweets (
, the average
proportional frequency (θ
2
) of unigrams (
) is
calculated according to equation 3.
(3)
8. For each set of associated tweets (
, Frequent
common unigrams (
) are extracted such that
each proportional frequency of each unigram
9. From the above steps, we can see that for every
significant unigram (
), there is an associated set
of tweets (
), and a set of associated frequent
common unigrams (
). Where total set of
frequent common unigrams
10. To combine the significant unigrams (keywords)
representing the trending topics, we check for
content similarity between the associated set of
tweets where those significant unigrams occur
described in Algorithm 1.
Algorithm 1: content similarity
1. // is set of all topics, each
element of Topics is a set of unigrams
2. For // where s= number of
significant unigrams
3. If
//
is a significant unigram
4.
//
is a set of unigrams
representing topic i
5.
//
is a set
of tweets of
,
2
(Niwattanakul et al., 2013)
6.
7.
//
is
the set of associated tweets of significant
unigram
// Level 1:
8. For
9. If
10. If
// J
2
is Jaccard
similarity coefficient and
is level 1 threshold
parameter and determined by experimentation
11.
12.
// Level 2:
13. For
14. If
15. If
//
is level 2
threshold parameter and determined by
experimentation
16.
17.
18. End if
19. End if
20. End for
21. End if
22. End if
23. End for
24. If
(β) // β is a tuneable
parameter of the trending threshold
25. Print (
26. End if
27. End if
28. End for
4 EXPERIMENTS
In this section we are conducting three main
experiments. In the first experiment we are
determining a proper value for
,which is the
threshold to determine whether to combine two
significant unigrams to form a topic composed of two
unigrams and to combine the two associated sets of
tweets.
The second experiment is to determine a proper
value for
, which is the threshold to determine
whether to combine a third unigram to a previously
formed topic composed of two unigrams forming a
topic of three unigrams, and to combine the
associated set of tweets to the two sets of tweets
Unsupervised Topic Extraction from Twitter: A Feature-pivot Approach
187

associated to the two previously unigrams forming
the topic.
In the third experiment we are testing the
approach using the determined values of
and
from the first and second experiments. And compare
the results to the document-pivot approach in (Rafea
and GabAllah, 2018a) and perform a two-sampled t-
test to evaluate the significant difference between
both approaches.
4.1 Investigating Different Values of
the Threshold of the First Level of
Content Similarity (Θ
3
)
In this experiment we are determining a proper value
for the threshold (
4.1.1 Method
In order to achieve this objective, the following is
performed:
1. Apply feature-pivot approach on the preprocessed
tweets of the baseline data in (Rafea and GabAllah,
2018a) by doing the following:
a. Apply the feature-pivot methodology mentioned in
section 3.
b. Set the value of the threshold of the first level of
content similarity (
) to different values: 0.1, 0.2,
0.3, 0.4, and 0.5, while setting the value of the
second level of content similarity (
) to an
arbitrary value which is 0.45.
c. Set value of trending threshold parameter (β) to 20,
which is an empirical value we will keep across
experiments.
2. Evaluate the results against the annotated data to
get the recall and F1 measure.
3. Determine the value of the threshold that achieved
the highest recall and F1 measure.
4.1.2 Results
We performed 5 experiments to determine the best
value of the threshold of the first level of content
similarity.
Figure 1 shows the recall, and F1 measure values
of different values for the threshold.
From the previous experiments we could find that
the recall reached 100% at values of
at
0.3, 0.4
and 0.5, while the F1 measure reached its highest
value of 0.9 at the value of 0.3
From this we choose the value of
to be 0.3
where the highest recall and F1 measure values were
recorded.
Figure 1: Recall and F1 measure values for different values
of (θ
3
).
4.2 Investigating Different Values of
the Threshold of the Second Level
of Content Similarity (Θ
4
)
In this experiment we are determining a proper value
for the threshold (
4.2.1 Method
In order to achieve this objective, the following is
performed:
1. Apply feature-pivot approach on the preprocessed
tweets of the baseline data in (Rafea and GabAllah,
2018a) by doing the following:
a. Apply the feature-pivot methodology mentioned in
section 3.
b. Set the value of first level of content similarity (
to 0.3 as determined from the previous
experiment.
c. Setting value of the threshold of the second level
of content similarity (
) to different values:
0.1, 0.2, 0.3, 0.4, and 0.5.
d. Set value of trending threshold parameter (β) to 20.
2. Evaluate the results against the annotated data to
get the recall and F1 measure.
3. Determine the value of the threshold that achieved
the highest recall and F1 measure.
4.2.2 Results
We performed 5 experiments to determine the best
value of the threshold of the second level of content
similarity (θ
4
).
Figure 2 shows the recall and F1 measure values
of different values for the threshold.
0
0,4
0,8
1,2
0,1 0,2 0,3 0,4 0,5
Recall F1 measure
WEBIST 2019 - 15th International Conference on Web Information Systems and Technologies
188
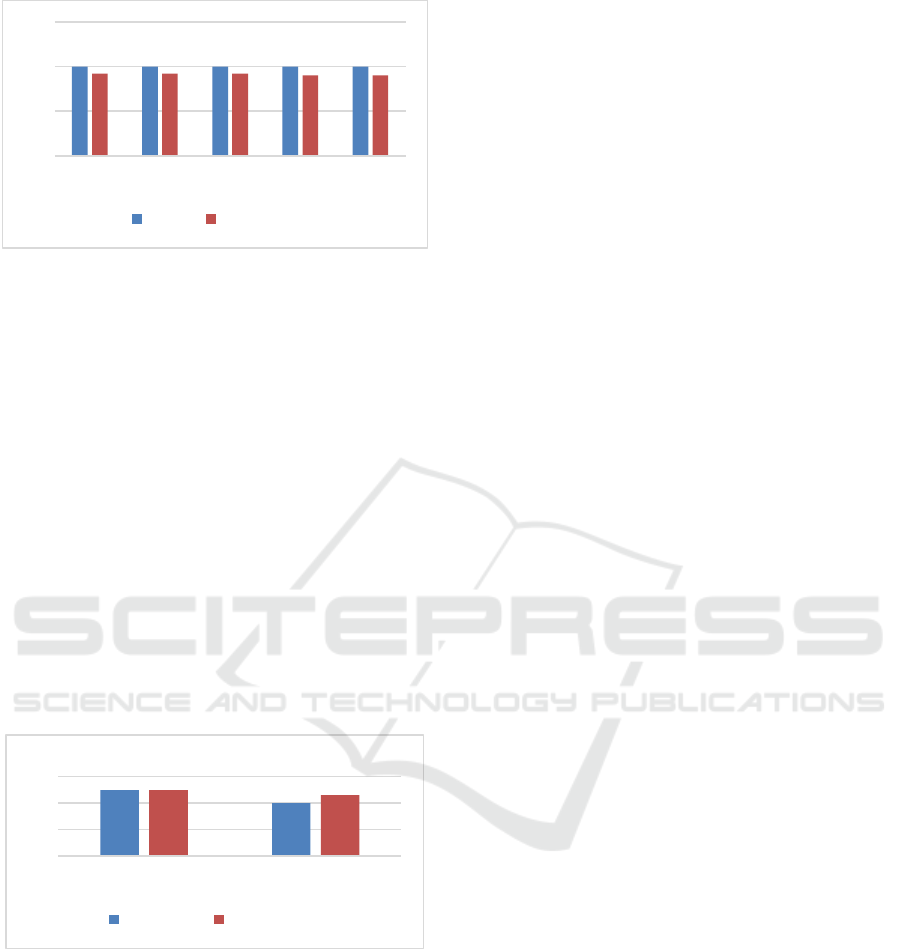
Figure 2: Recall and F1 measure values for different values
of threshold (θ4).
From the above results we could observe that the
recall reached 100% for all values of the threshold
(
). The F1 measure gave the highest value of 0.923
at threshold values of 0.1, 0.2, and 0.3.
We will pick the value of 0.2 as an average value
of the three values 0.1, 0.2, and 0.3.
From the above two experiments we can deduce
that the value of threshold of the first level of content
similarity (
) is 0.3 and the value of the threshold of
the second level of content similarity (
) is 0.2.
By setting the values of the thresholds to the
determined values results from experiments, we
compare the results of the feature-pivot approach to
the document-pivot approach.
Figure 3 shows the recall and F1 measure values
resulted from applying the document pivot approach
and the feature pivot approach on the same data set.
Figure 3: Values of Recall and F1 measure for Doc-pivot
and Feature-pivot approaches.
4.3 Applying Approach on Test Data
In this set of experiments, we apply feature pivot
approach on different datasets of different sizes and
from different domains and compare the performance
of our technique to one of the document-pivot
approach techniques in (Rafea and GabAllah, 2018a).
We added a dataset from the telecom domain
collected using the company names of mobile
operators in Egypt. The objective of this experiment
to examine whether there is statistical significance
between results achieved from applying both
approaches on different data sets.
4.3.1 Method
In order to achieve the objective of this experiment
we are performing the following:
1. Collect data of sizes 200,400,600, and 1200 tweets
from four different domains; sports, entertainment,
news and telecom.
2. Annotate all data sets to determine trending topics
in each set.
3. Preprocess all the data sets by removing stop
words, punctuation marks, and account names.
4. Apply document pivot approach using repeated
bisecting k-means at k=60 and topic extraction
method using unigrams, bigrams and trigrams
occurring more than or equal to 30% of the cluster
size.
5. Compute the recall, precision and F1 measure
values.
6. Apply feature pivot approach using β (trending
threshold) at value of 20, θ
3
(content similarity
level 1 threshold) at value of 0.3 and θ
4
(content
similarity level 2 threshold) at value of 0.2.
7. Compute the recall, precision and F1 measure
values.
8. Apply Two-sample paired significance t-test on
the recall, precision and F1 measure values
recorded by each approach and record its
significance.
4.3.2 Results
We performed 16 experiments; 4 different sizes
200,400,600, and 1200 tweets from 4 domains;
sports, entertainments, news, and telecom.
Table 1 shows the values of recall, precision, and
F1 measure values for all experiments approximated
to the nearest two decimal places.
Since the mean of the values resulted from applying
the feature pivot approach is greater than those
resulted from applying the document pivot approach,
so we need to apply a Two-sample one-tailed paired
t-test according to (Piegorsch and Bailer, 2005),(Ha,
Renee R., and James C. Ha, 2011) ,(Dror et al., 2017).
Our hypothesis would be that there is an increase
in performance yields from applying the feature pivot
approach.
0
0,5
1
1,5
0,1 0,2 0,3 0,4 0,5
Recall F1 measure
0
0,4
0,8
1,2
Recall F1 measure
Doc-pivot Feature-pivot
Unsupervised Topic Extraction from Twitter: A Feature-pivot Approach
189

Table 1: Recall, Precision, F1 measure values for all experiments.
Recall
Precision
F1 measure
Domain
Number of
tweets
Feature
-
pivot
Doc
-pivot
Feature
-
pivot
Doc
-pivot
Feature
-
pivot
Doc
-pivot
Sport
200
1
0.5
0.5
1
0.67
0.67
400
1
0.67
0.5
0.67
0.67
0.67
600
1
1
0.5
0.4
0.67
0.57
1200
1
0.8
0.45
0.29
0.62
0.42
Entertainment
200
1
0.5
1
1
1
0.67
400
1
1
1
0.6
1
0.75
600
1
0.83
1
0.55
1
0.66
1200
0.87
0.87
0.77
0.58
0.82
0.69
News
200
1
1
1
1
1
1
400
1
1
1
0.67
1
0.80
600
1
1
0.62
0.62
0.77
0.77
1200
0.9
0.9
0.63
0.69
0.74
0.78
Telecom
200
1
1
1
0.5
1
0.67
400
1
0.5
0.66
0.5
0.79
0.5
600
0.83
0.83
0.71
0.55
0.77
0.66
1200
0.86
0.71
0.75
0.55
0.79
0.62
Mean
0.97
0.82
0.76
0.63
0.83
0.68
By applying Two-sample one-tailed paired
significance t-test at α =0.05 on the recall, precision,
and F1 measure resulted from the above experiments
we got the following results in Table 2.
Table 2: Two-sampled one tailed t-test calculations.
Calculations
Recall
Precision
F1
Measure
Mean of
differences
of pairs:
0.146
0.1243
0.153
Sum of
differences
of pairs:
2.344
1.9888
2.446
Sum of
square
differences
of pairs:
0.949
1.162
0.631
Standard
deviation of
differences
between
pairs:
0.201
0.247
0.131
t
obtained
2.914
2.014
4.676
Degree of
freedom
15
15
15
t
critical
1.753
1.753
1.753
p- value
0.005344
0.031171
0.000149
WEBIST 2019 - 15th International Conference on Web Information Systems and Technologies
190

From the above calculations we got the values t
critical
and p-value from charts in (Piegorsch and Bailer,
2005) and found that t
obtained
>t
critical
and p-value < α in
call measures, which confirms our hypothesis that the
feature pivot approach performs better in a significant
way than the document pivot approach in the
performed experiments.
5 CONCLUSION AND FUTURE
WORK
From the above experiments we could deduce that
applying the feature pivot approach achieved
significantly better results than applying the
document pivot approach. That was proved by
applying both approaches on different data set sizes
(200, 400, 600, and 1200) from different domains
(sports, entertainment, news, and telecom). The Two-
sample paired one-tailed significance test was applied
to the values of the recall, precision and F1 measure
resulted from applying both approaches on the data
sets. The test showed that we could prove our
hypothesis that applying the feature pivot approach
achieves significantly better results.
This can lead us to the conclusion that applying
the feature pivot approach achieves our objective of
extracting trending topics from Egyptian dialect
tweets.
It is worth noting that each domain contains
special wording that is different in meaning from a
domain to another. Pre-processing through removing
irrelevant words from each domain enhanced the
results a lot. In the above experiments we used the
same set of stop words across all datasets, but we
noticed that if we customized a list for each domain
results would improve.
In our future work we are considering
investigating the performance of this approach on
different types of data such as customer care calls. We
are also considering representing the data using word
embedding and topic embedding techniques.
ACKNOWLEDGMENT
This research has been done with the support of the
fund granted by ITIDA ( Information Technology
Industry Development Agency) in Egypt, with the
collaboration of RDI ( The Engineering Co. For
Digital Systems Development) in Egypt and The
American University in Cairo.
REFERENCES
Aiello, L.M., Petkos, G., Martin, C., Corney, D.,
Papadopoulos, S., Skraba, R., Goker, A., Kompatsiaris,
I., Jaimes, A., 2013. Sensing Trending Topics in
Twitter. IEEE Transactions on Multimedia 15, 1268–
1282. https://doi.org/10.1109/TMM.2013.2265080
Alkhamees, N., Fasli, M., 2016. Event detection from social
network streams using frequent pattern mining with
dynamic support values, in: 2016 IEEE International
Conference on Big Data (Big Data). Presented at the
2016 IEEE International Conference on Big Data (Big
Data), IEEE, Washington DC,USA, pp. 1670–1679.
https://doi.org/10.1109/BigData.2016.7840781
Allan, J., 2002. Introduction to Topic Detection and
Tracking, in: Allan, J. (Ed.), Topic Detection and
Tracking. Springer US, Boston, MA, pp. 1–16.
https://doi.org/10.1007/978-1-4615-0933-2_1
Cataldi, M., Di Caro, L., Schifanella, C., 2010. Emerging
topic detection on Twitter based on temporal and social
terms evaluation, in: Proceedings of the Tenth
International Workshop on Multimedia Data Mining -
MDMKDD ’10. Presented at the the Tenth
International Workshop, ACM Press, Washington,
D.C., pp. 1–10.
https://doi.org/10.1145/1814245.1814249
Dai, X.-Y., Chen, Q.-C., Wang, X.-L., Xu, J., 2010. Online
topic detection and tracking of financial news based on
hierarchical clustering, in: 2010 International
Conference on Machine Learning and Cybernetics.
Presented at the 2010 International Conference on
Machine Learning and Cybernetics (ICMLC), IEEE,
Qingdao, China, pp. 3341–3346.
https://doi.org/10.1109/ICMLC.2010.5580677
Dror, R., Baumer, G., Bogomolov, M., Reichart, R., 2017.
Replicability Analysis for Natural Language
Processing: Testing Significance with Multiple
Datasets. arXiv:1709.09500 [cs].
Ha, Renee R., and James C. Ha, 2011. Integrative Statistics
for the Social and Behavioral Sciences. Sage.
Hammad, M., El-Beltagy, S.R., 2017. Towards Efficient
Online Topic Detection through Automated Bursty
Feature Detection from Arabic Twitter Streams.
Procedia Computer Science 117, 248–255.
https://doi.org/10.1016/j.procs.2017.10.116
Hasan, M., Orgun, M.A., Schwitter, R., 2018. Real-time
event detection from the Twitter data stream using the
TwitterNews+ Framework. Information Processing &
Management.
https://doi.org/10.1016/j.ipm.2018.03.001
Mathioudakis, M., Koudas, N., 2010. TwitterMonitor: trend
detection over the twitter stream, in: Proceedings of the
2010 International Conference on Management of Data
- SIGMOD ’10. Presented at the the 2010 international
conference, ACM Press, Indianapolis, Indiana, USA, p.
1155. https://doi.org/10.1145/1807167.1807306
Niwattanakul, S., Singthongchai, J., Naenudorn, E.,
Wanapu, S., 2013. Using of Jaccard Coefficient for
Keywords Similarity. Hong Kong 6.
Unsupervised Topic Extraction from Twitter: A Feature-pivot Approach
191

Ozdikis, O., Karagoz, P., Oğuztüzün, H., 2017. Incremental
clustering with vector expansion for online event
detection in microblogs. Social Network Analysis and
Mining 7. https://doi.org/10.1007/s13278-017-0476-8
Parikh, R., Karlapalem, K., 2013. ET: events from tweets,
in: Proceedings of the 22nd International Conference on
World Wide Web - WWW ’13 Companion. Presented
at the the 22nd International Conference, ACM Press,
Rio de Janeiro, Brazil, pp. 613–620.
https://doi.org/10.1145/2487788.2488006
Piegorsch, W.W., Bailer, A.J., 2005. Analyzing
environmental data. Wiley, Chichester, West Sussex,
England ; Hoboken, NJ.
Pradhan, A.K., Mohanty, H., Lal, R.P., 2019. Event
Detection and Aspects in Twitter: A BoW Approach,
in: Fahrnberger, G., Gopinathan, S., Parida, L. (Eds.),
Distributed Computing and Internet Technology.
Springer International Publishing, Cham, pp. 194–211.
https://doi.org/10.1007/978-3-030-05366-6_16
Rafea, A., GabAllah, N.A., 2018b. Topic Detection
Approaches in Identifying Topics and Events from
Arabic Corpora. Procedia Computer Science 142, 270–
277. https://doi.org/10.1016/j.procs.2018.10.492
Rafea, A., GabAllah, N.A., 2018a. Trending Topic
Extraction from Twitter for an Arabic Speaking User.
Presented at the The 33rd International Conference on
Computers and Their Applications (CATA 2018), Las
Vegas, Nevada, USA, pp. 214–2196.
Xiangying Dai, Yunlian Sun, 2010. Event identification
within news topics, in: 2010 International Conference
on Intelligent Computing and Integrated Systems.
Presented at the 2010 International Conference on
Intelligent Computing and Integrated Systems (ICISS),
IEEE, Guilin, China, pp. 498–502.
https://doi.org/10.1109/ICISS.2010.5654957
Xu, X., Yuruk, N., Feng, Z., Schweiger, T.A.J., 2007.
SCAN: a structural clustering algorithm for networks,
in: Proceedings of the 13th ACM SIGKDD
International Conference on Knowledge Discovery and
Data Mining - KDD ’07. Presented at the the 13th
ACM SIGKDD international conference, ACM Press,
San Jose, California, USA, p. 824.
https://doi.org/10.1145/1281192.1281280
WEBIST 2019 - 15th International Conference on Web Information Systems and Technologies
192
