
Software 2.0 for Scrap Metal Classification
Manuel Robalinho
1 a
and Pedro Fernandes
2 b
1
Portucalense University Infante D. Henrique, Dr. Ant
´
onio Bernardino de Almeida 541, Porto, Portugal
2
ISR-UC - Institute of Systems and Robotics, University of Coimbra, Coimbra, Portugal
Keywords: Software 2.0, Scrap Metal Classification, Spectral Images.
Abstract:
Software 2.0 and its approach to the processing of multi-spectral images helping to perform an automatic clas-
sification of metal scrap is the subject of this research. The use of Machine Learning and Deep Learning tools
contribute to the development of intelligent systems, allowing to achieve relevant results in the classification
of images, particularly of metal scrap. In this research, tests will be performed with a multi-spectral chamber
to obtain images of aluminum, iron, copper, brass, stainless steel, simulating an environment of metal scrap.
The aim is to obtain the classification of these metals through the development of software and to perform a
multi-spectral analysis of the obtained images. Preliminary tests were made in a controlled environment, with
a small sample of these materials. Studies to implement a prototype in a Brazilian steel industry will follow.
1 INTRODUCTION
Steel is the world’s most important engineering and
construction material. It is used in every aspect of our
lives. There are more than 3,500 different grades of
steel with many different physical, chemical, and en-
vironmental properties. The European environmen-
tal initiative on raw materials (Parliament and Coun-
cil, 2003) has recently promoted the efforts in recy-
cling and recovery of metal alloys. Recycling of scrap
plays an important role in the conservation of energy
because the remelting of scrap requires much less en-
ergy than the production of iron or steel products from
iron ore (Javaid and Essadiqi, 2003).
In Brazil, the collection of recyclable metal ma-
terials is carried out by a fleet of about 15 thousand
trucks throughout the country. There are 1.5 million
people directly and indirectly involved in the collec-
tion, selection, preparation and distribution of recy-
clable metal materials, including in this total 800,000
pickers (Vasques, 2009).
The objective of this work is the research of spec-
tral images of scrap steel to perform an efficient clas-
sification using Machine Learning techniques. One
of the goals is to facilitate a current visual and time-
consuming human work, with many classifications
that are dependent on personnel and fallible apprecia-
a
https://orcid.org/0000-0001-9063-4258
b
https://orcid.org/0000-0002-1260-9820
tion only.
Each year, U.S. industry discards tens of billions
of pounds of non-ferrous metals as waste because it
is either impractical or uneconomical to recover this
material using current technology. Many alloys are
downgraded in value due to contamination that can-
not be cost effectively removed. In addition, bil-
lions of pounds of non-ferrous metals are shipped
overseas to China and elsewhere, for separation into
higher value scrap grades using low cost labor for vi-
sual identification and hand sort. Traditionally, metals
businesses, including recycling, are slow in adopting
new technologies. There are ongoing projects in US
to transform this industry, by replacing old methods
of manual selection and visual identification by fully
automated, high-efficiency methods using computers,
robotics, and other automation systems for material
handling. This will have positive effects throughout
the entire scrap industry chain. Scrap recyclers will
be able to monetize the scrap value with a better and
faster rating. The industries that use it, will be able
to profit from the greater availability and quality of
scrap, which will bring more competitive prices in the
market. It is these reasons that lead government agen-
cies in the United States, such as the National Insti-
tute of Standards and Technology (NIST) and the Na-
tional Science Foundation (NSF) to develop new tech-
nologies aimed at advancing scrap processing tech-
666
Robalinho, M. and Fernandes, P.
Software 2.0 for Scrap Metal Classification.
In Proceedings of the 16th International Conference on Informatics in Control, Automation and Robotics (ICINCO 2019), pages 666-673
ISBN: 978-989-758-380-3
Copyright
c
2019 by SCITEPRESS – Science and Technology Publications, Lda. All rights reserved

nology. Projects in this scope developed Spectramet
1
,
a platform of technologies for rapid identification that
allows the unambiguous separation of non-ferrous
mixed scrap according to the type of alloy (Spencer,
2005).
Steel is 100% recyclable, making it one of the
most sustainable materials in the world. Even a sheet
totally taken by the rust can be sent to processing
in a steel mill gaining new possibilities of use (Za-
parolli, 2014). Thus, recycling scrap iron and steel
has remarkable economic and environmental advan-
tages. The example of the steel industry is not unique,
similar figures can be obtained with other materials,
whether metallic or not. However, given its impor-
tance in the Brazilian economy, the values related to
the steel industry really impress.
Recycling of scrap in new iron and steel products
is advantageous, because in order to obtain a metal-
lic product from iron ore (iron oxide) it is necessary
to react it at high temperatures with coal, which in
general removes the oxygen and isolates iron. This
process has a very high energy expenditure, since it
is necessary that certain regions of the furnace reach
more than 2,000 degrees Celsius, the process gen-
erates many gases, particulates, solid wastes (called
slag) and pig iron in liquid form. In order to produce
steel from scrap, in general terms it is only necessary
to melt the scrap (close to the same 2,000 degrees
Celsius) and to correct the composition. These are
relevant arguments in that recycling is much more ad-
vantageous, in relation to the production of the same
material from iron ore, considering the consumption
of raw material, generation of solid waste and gaseous
effluents, necessity (usually for cooling, washing and
heat treatment) and energy expenditure. Regarding
this latest point, the energy expenditure, it is esti-
mated that to make a kilogram of metal from the
scrap, only 2/3 of all the energy that is consumed in
the manufacture of a kilogram of steel from the ore
is needed. Other interesting points are that recycling
of scrap produces only 3% of the particulate matter
and 30% of the solid waste that is produced with the
production of steel from the ore, not counting very
interesting gains in the gaseous emissions of nitroge-
nous and sulfur compounds, as well as simpler liquid
effluents to be treated (Mancini, 2013).
Scrap iron arrives at steel mills in a large trucks,
with cargo well accommodated, which makes it diffi-
cult to classify the cargo visually. Usually the heavy
scrap is placed down and the small and mixed scrap
1
The initial system is located at Spectramet’s techni-
cal research center in Greenfield, Mass., and will be ded-
icated to processing mixed non-ferrous metals from various
sources.
is placed over, for reasons of load optimization. This
makes it difficult to verify the type of scrap shipped
and the type of material that is below the visible
load. In addition, purely personal and financial fac-
tors can influence the people who make the classifi-
cation, leading to financial losses in the acquisition
of scrap. It is intended that this task of classification
be optimized in time and credibility, so that financial
gains are obtained and improve the quality of the clas-
sification and separation of metallic scrap. Machine
Learning
2
(ML) techniques will be studied, using im-
ages to obtain classification parameters that will help
to classify metals. The application in the steel indus-
try was taken into account both in the classification
of the discharge of metal scrap acquisitions and in the
preparation of scrap production, for use in the produc-
tion of iron ingots.
The use of ML techniques for multi-spectral im-
ages is being used, due to the high cost of hyper-
spectral equipment. Although hyper-spectral equip-
ment has valuable information in the images they pro-
duce, in most cases of study and implementation it is
difficult to create proofs of concept, taking into con-
sideration the price of the equipment. Also in the case
of iron scrap materials, the issue of industrial secrecy
creates legal obstacles to accessing images and infor-
mation on similar projects, which are developed in
other universities and research centers.
In a steel environment, there is a great need for
correct sorting of scrap. The incorrect classification
impairs the quality of the steel production, since it is
cheaper to produce steel from scrap, the scrap should
also be of good quality and with the quantities of suit-
able ferrous steel. In a steel production the incorrect
selection of materials to go to the production of the
pig iron can bring danger of explosion.
2 RELATED WORK
The author (Andrej Karpathy, 2018), a research sci-
entist at OpenAI
3
, was the first that use the term Soft-
ware 2.0 on November 2017.
(Sikka, 2018) describes Sotware 2.0 as using the
concepts of programming, mathematics, and statistics
to develop the concept of ML, and put the machine
into large-data reasoning. The results are presented
2
Machine Learning is a field of computer science that
uses statistical techniques to give computer systems the
ability to ”learn” with data, without being explicitly pro-
grammed.
3
OpenAI is a non-profit AI research company, discov-
ering and enacting the path to safe artificial general intelli-
gence.
Software 2.0 for Scrap Metal Classification
667

as predictive behaviours of a given set of data, and
can combine multiple characteristics, making it supe-
rior to human reasoning. This is the concept of ML
as the basis of Software 2.0 and differs from the cur-
rent standard in an important way: it is cantered on
weights of neural networks
4
, not explicit algorithms.
According to (Andrej Karpathy, 2018), neural net-
works are not just another classifier, they represent the
beginning of a fundamental shift in how we write soft-
ware. They are Software 2.0. The same author states
that Software 2.0 platforms, must have a great devel-
opment in the coming years, since their goal is not to
replace but improve processes that the human being
develops, or processes of analysis where the human
being can’t perceive the result, in cause of their com-
plexity.
The author (Andrej Karpathy, 2018) says that, per-
haps it is this human inability to understand some of
the results made available by this Software 2.0 tech-
nology, which is its main disadvantage, according to
the author, because in the event of system failure, it
is presented as a ”silent failure” that may also not be
noticeable to the human being and to provoke a catas-
trophe without culprits.
According to (Domingos, 2015), we live in the
age of algorithms. Few years ago, mentioning the
word algorithm would have drawn a blank from most
people. The same thing would happen to AI
5
, who
scarcely a few years ago frightened the citizen and
the businessmen, with the presumption that AI would
put the machines in command of the Earth.
According to the same author, it is necessary for
people to be aware of ML, so that this learning of the
computers will serve them, for me to decide and not
others to decide for me.
The authors (Wilson et al., 2019), say that the re-
cycling industry has been slow to adopt automated
methods of sorting such metallic scraps. How-
ever, with the advent of hyper-spectral cameras and
robotic-based picking and sorting methods, such pro-
cedures can now be performed automatically, reliev-
ing workers of laborious tasks while at the same time
improving the efficiency of sorting metallic alloys.
Since the automation process is more effective, scrap
providers can produce more recycled material thus in-
crease their profitability. According to the same au-
thors, using automated systems, 40-50% of the steel
that comes from recycled material and 30% of other
metals can be sorted by magnetic drums or induction
4
Artificial neural networks (ANN) are computing sys-
tems inspired by the biological neural networks that consti-
tute human brains.
5
AI, in computer science is artificial intelligence.
or Eddy current separators
6
, respectively. One of the
greatest challenges in developing more sophisticated
systems is sorting various non-ferrous metals such as
aluminum, copper, silver, brass, lead, stainless steel,
silver and gold.
A project that implement this concepts, was de-
scribed by (Barnab
´
e et al., 2015). The project uses
spectral imaging to scrap classification and was ref-
erenced to the conception of a prototype combining
two hyper spectral cameras, one ranging from vis-
ible to near-infra-red and the other covering short-
wave infra-red, is presented. The prototype aims at
the characterization of millimetre sized metallic al-
loys particles, originating from end-of-life vehicles
and waste electrical and electronic equipment recy-
cling.
Another work was published in a paper by (Ku-
tila et al., 2005) and presents a novel automatic scrap
metal sorting system which employs a colour vision
based optical sensing system and an inductive sensor
array sensor array.
Recently in 2017, the work in PICK-IT project,
about Hyper spectral imaging in the VNIR
7
, devel-
oped by a team, and described by (Braibant et al.,
2017), has nevertheless proven to be an efficient tech-
nique to identify aluminum, zinc, copper, brass al-
loys and stainless steel. The same authors, describes
an Hyper-spectral imaging in the VNIR has never-
theless proven to be an efficient technique to iden-
tify aluminum, zinc, copper, brass alloys and stainless
steel (e.g., Barnab
´
e et al., 2015, Kutila et al., 2005).
The efficiency of hyper-spectral classification how-
ever depends on the surface conditions of the alloy
fragments.
At USA, (Paul, Torek; Benjamin, Aubuchon;
Kalyani, 2016) patented in 2016 a system and a
method of sorting scrap particles, which includes
imaging a moving conveyor containing scrap particles
using a vision system to create an image. A computer
analyzes the image as a matrix of cells, identifies cells
in the matrix containing a particle, and calculates a
color input for the particle from a color model by de-
termining color components for each cell associated
with the particle.
6
Eddy current separator, it’s a parasitic chain separa-
tor uses a powerful magnetic field to separate non-ferrous
metals from the waste after all ferrous metals have been re-
moved earlier by some magnet arrangement.
7
The visible and near-infrared (VNIR) portion of the
electromagnetic spectrum has wavelengths between ap-
proximately 400 and 1400 nanometers (nm).
ICINCO 2019 - 16th International Conference on Informatics in Control, Automation and Robotics
668
3 BACKGROUND, MATERIALS
AND METHODS
In the experiments already carried out, the materi-
als used were aluminum, brass, copper, iron, stain-
less steel and painted iron materials to obtain multi-
spectral images. For the analysis of these multi-
spectral images, ML techniques were used, imple-
mented with Python programming in the Anaconda
platform. The images were obtained during the study
design in different light conditions and distance for
the photographed materials. The batches of images
were cataloged according to the conditions of their
obtaining.
3.1 Background
This study is based on multi-spectral image analysis
techniques, applying a ML process that allows the ob-
tention of marks that help making the classification of
metals. Some of the techniques tested are the analysis
of the RGB
8
band length, the color and the histogram
of the image. The transformation of the image into
matrix form, allows the use of multiple enhancement
techniques, for improving image quality, such as:
- Contrast stretch;
- Density slicing;
- Edge enhancement;
- Spatial filtering;
- Noise reduction;
- Improve contrast image;
- Extract RGB information;
- Removing background;
- Image histogram information.
A multi-spectral image of the used materials is a set
of several monochrome images of the same material,
each obtained with a different sensor. Each image is
referred to as a band RGB. A multi-spectral image is
an RGB color image that is composed of a R-red, G-
green, and B-blue image each obtained with a sensor
sensitive to a different wavelength.
All single-band imaging operations can also be
applied to multi-spectral images by processing each
band separately. Using the matrix of a multi-spectral
image, we can detect the edges on each band to ex-
tract an image from each band. If we want to go back
to the original image, we simply assemble three im-
ages using mathematical calculation of the matrices
that make up each image.
The transformation of the RGB bands of an im-
age into matrices and lists allows an approach with
8
RGB is the acronym of the additive color system
formed by the initials of the colors Red, Green and Blue.
ML, and the differences between the spectral bands
of the different materials can be exploited mathemati-
cally. Several libraries available for image processing
allow an exploration at the level of the representative
matrices of an image, its color and the reflectance as
exposed to the incidence of light. Some of the ap-
plied techniques are of marking objects in the images
and extraction so that the analysis is not influenced by
noise.
To explore the additional information that is con-
tained in the various bands, we must consider the im-
ages as a multi-spectral image and not as a set of
monochromatic gray scale images. The overall goal
of image sorting is to categorize automatically all pix-
els of an image in classes. The multi-spectral data
are used to perform the classification and spectral pat-
tern within the data for each pixel is used as the nu-
merical basis for categorization. The different types
of resources manifest different combinations of num-
bers based on in their inherent spectral reflectance and
emission properties.
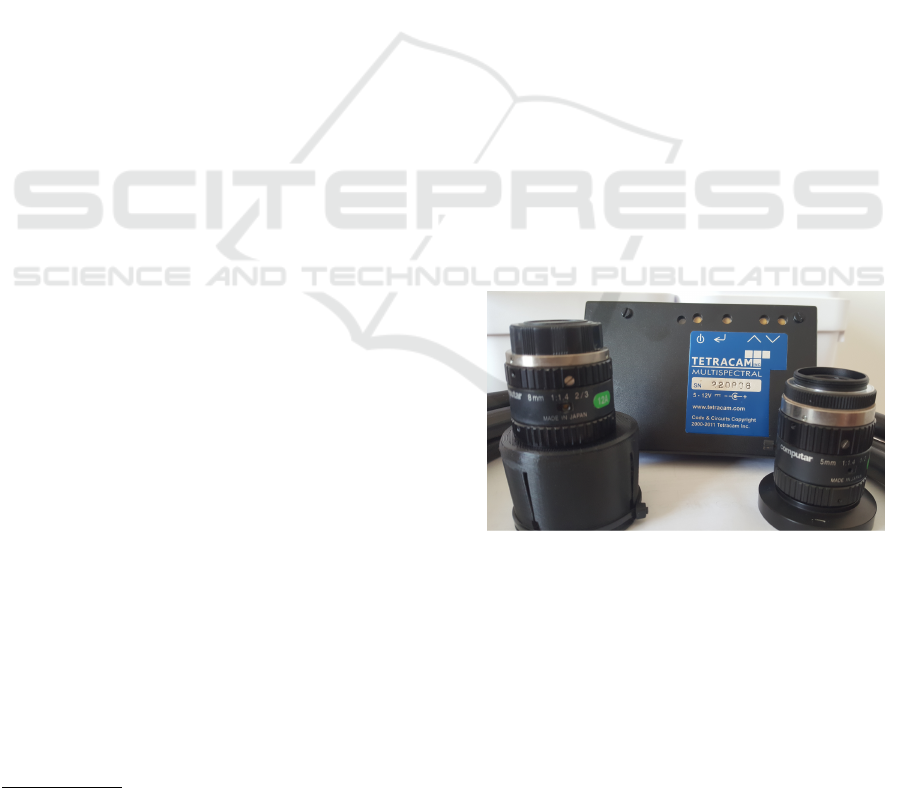
3.2 Materials
The used equipment is a multi-spectral machine,
ADC Lite (COMPUTAR, 2009), which is a
lightweight (198 grams) version of ADC Air Cam-
era. The camera and its accompanying software,
PixelWrench2, is used to capture and process multi-
spectral images. The Figure 1 has the equipment used.
Figure 1: Equipment used in the tests.
The equipment can be used manually or coupled
to a drone to obtain the images in an outdoor environ-
ment, as with industrial scrap. The method used con-
sists of capturing images in a controlled lighting envi-
ronment and to clean the artefacts used in the images.
The chosen materials were iron, copper, brass, alu-
minum, stainless steel and copper wire. These mate-
rials represent metallic materials, which must be sep-
arated from the scrap yard in a steel industry. The
workbench is presented bellow, at Figure 2.
The Anaconda framework was installed to use
Software 2.0 for Scrap Metal Classification
669
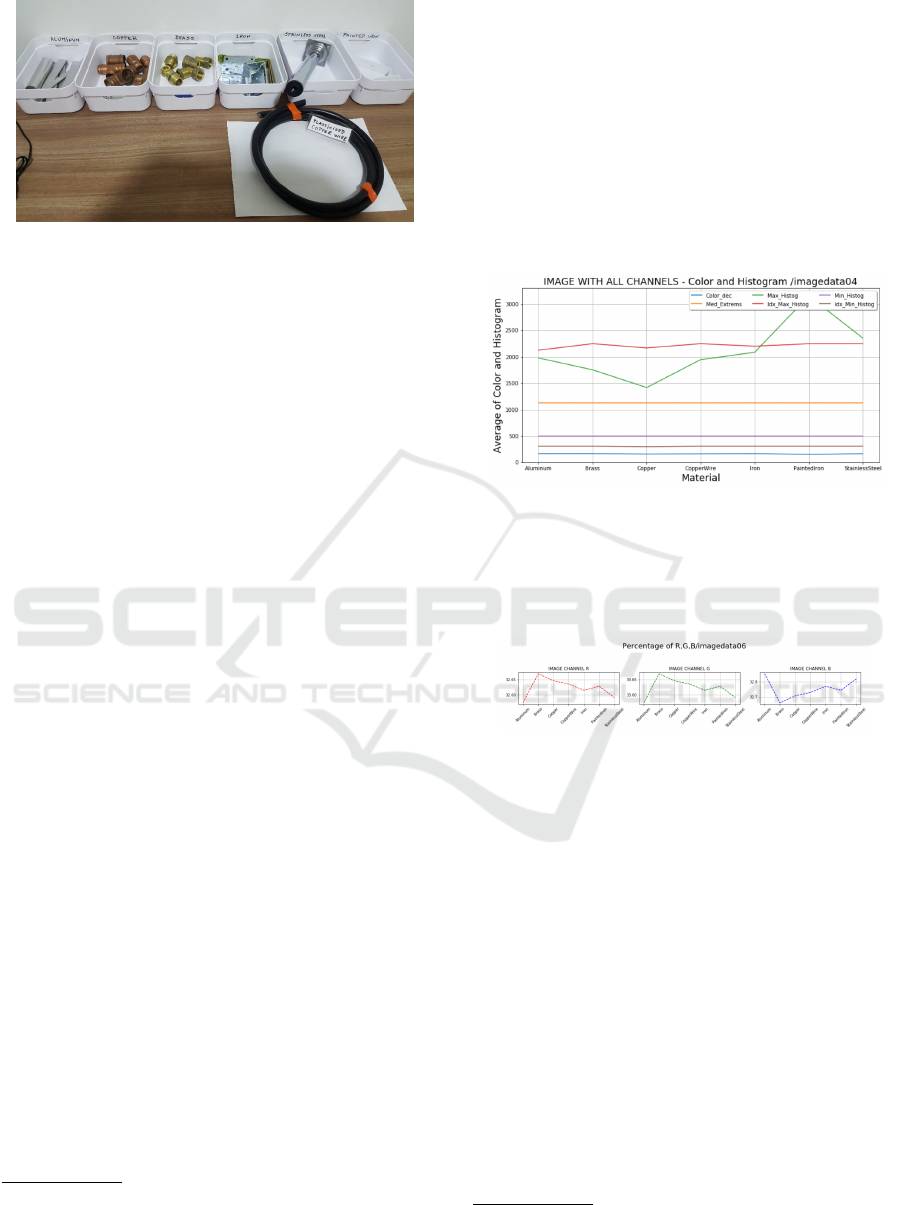
Figure 2: Working environment and samples of metallic
material.
Jupyter with Python programming. The exploration
of the bands of the images focuses on the analysis of
the matrices of the images, in order to obtain clas-
sification parameters for the different materials. An-
other approach could be to use Google’s Collabora-
tory, which provides a Python virtual machine in the
cloud and can also use the GPU’s
9
environment.
Applied techniques used need Python libraries in-
stalled, such as: Pillow, Opencv, Openpyxl, Color-
math, Webcolors, Numpy and Matplotlib, provide a
set of facilities that allow us to analyse different issues
and compose a specific approach to each problem.
3.3 Methods
For the study, several photos of all materials were
generated and stored in separate folders, identified
by each type of conditions of image acquisition. In
each batch of images, the following conditions were
changed: the lighting conditions, background image
of the place where the images were taken and the dis-
tance between the camera and the materials. The im-
ages are generated in TIF
10
format and converted to
other formats using the PixelWrench2 software, pro-
vided with the Tetracam machine.
All the images were classified according to the
type of material, so as to be able to have a database
of multi-spectral images, that can be used in future
ML processing.
A Python program was developed to read all im-
ages from a folder and submit each image to various
techniques, to retrieve image characterization infor-
mation. Following are examples of information ob-
tained:
- Extract each channel image;
- Maximum and minimum histogram values;
- Histogram plotting;
- Spatial filtering;
9
GPU, Graphics Processing Unit.
10
Tagged Image File Format (TIFF) is a standard file for-
mat used in the publishing and printing industry.
- Contrast stretch;
- Edge enhancement;
- Removing Background;
- Extract RGB information;
- Obtain delta from colors;
- Most common colors;;
- Image histogram information;
- Extremes from each band spectrum.
This information is stored in a Pandas DataFrame
table, for each analysed image. Some information
from the table, are printed in Figures 3 and 4.
Figure 3: Plot the information about materials.
Classifications can be obtained by combining sev-
eral parameters and are stored in a database. This
database will be the basis of the training system for
future classifications.
Figure 4: Analysis from image material bands.
After its processing, the information in the Pan-
das
11
table is stored in a database, and will serve as
a basis for ML processing the information about the
analysed materials. Figure 5 presents the database.
4 ANALYSIS AND DISCUSSION
The techniques studied address several problems of a
steel environment: materials that are in dispersed po-
sitions and in external environments, influence of the
luminosity, image noise caused by the external envi-
ronment, or by the factory floor, painted or dirty ma-
terial and material with a lot of reflectance normally
shown for example in stainless steel.
For suppressing images and background colors,
and also suppressing colors in the environment where
11
Pandas is a software library written for the Python pro-
gramming language
ICINCO 2019 - 16th International Conference on Informatics in Control, Automation and Robotics
670
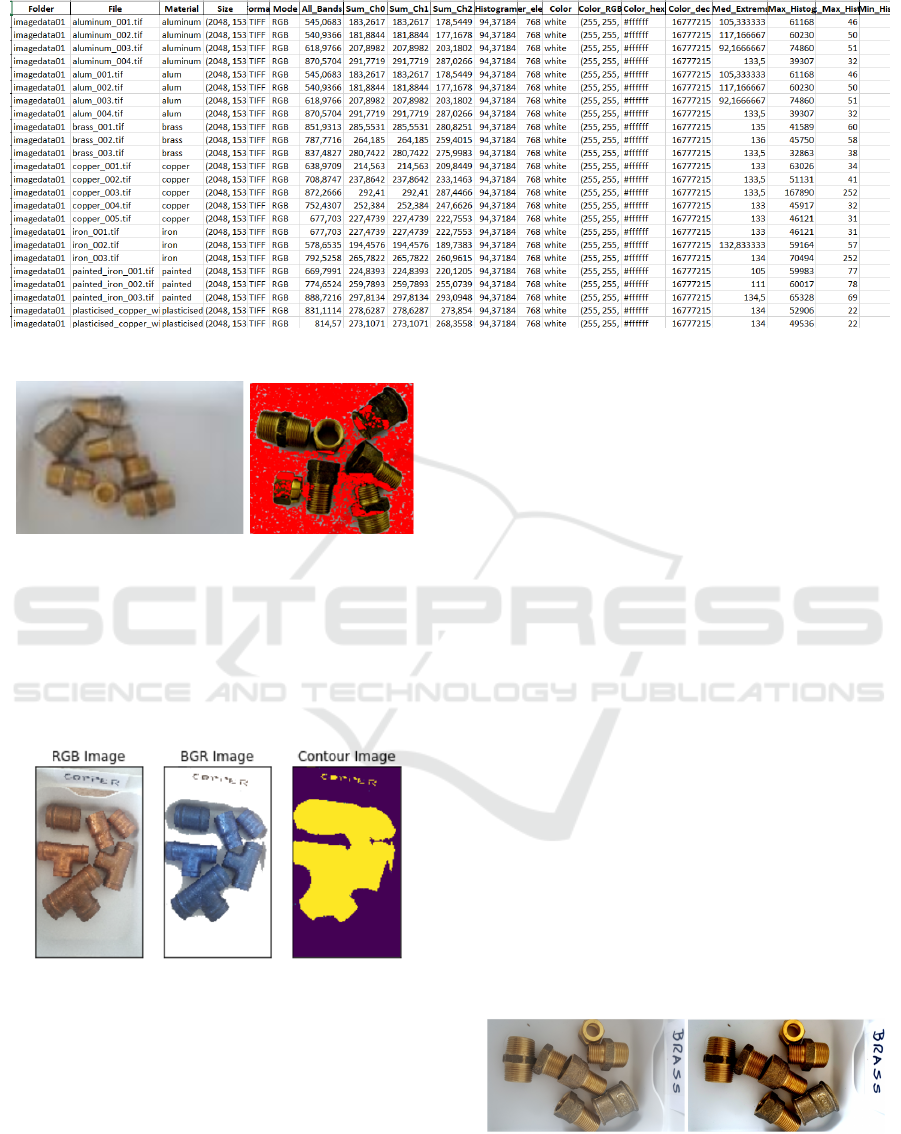
Figure 5: Database obtained by automatic processing of images with Python.
Figure 6: Image noise removal technique using brass.
the images are obtained, there are some issues resul-
tant from changes on each environment. As an exam-
ple, the influence of the floor colors of the scrap yard
must be configured in the system to be disregarded
from the analysis. Some of this techniques are pre-
sented in Figures 6 and 7.
Figure 7: Techniques for area detection for copper metal
analysis.
The use of mathematical computations in multi-
spectral array of images is a process that demands
a lot of computer power in terms of processing and
memory. One approach was to use Google’s Colabo-
ratory, with the project using the cloud and the GPU
provided in that environment. The transfer of images
between the source environment and the cloud should
be scoped, because the large amount of information in
the images generates a large volume of data traffic to
the cloud. Another approach is to install the software
on a computer with a fair amount of memory and pro-
cessing power and with a performant GPU. This was
the approach used in the study. This facilitated the
handling of images in large quantities and with the
required speed, in terms of what is expected in the
implementation of the prototype.
The similarity of color between various materials
and the perception of color noise to the surrounding
area, needs algorithms that make a tolerance in the
color detected. The algorithm implements a color dif-
ference to understand which it is the color sought.
Colormath libraries provide features that allow us to
work in this area using Python. In this case the
conversion between color formats, decimal and other
forms of expression require functions developed us-
ing mathematical expressions with Numpy Python li-
braries. Normally we do not look for a fixed form of
the spectrum, but an approximate color. That depends
on the conditions of luminosity in which the images
were obtained and the level of dirt of the materials.
In a first step, the image was submitted to tech-
niques that improves contrast. Contrast stretching or
normalization, is one such operation applied on im-
ages, which improves the contrast of the image so that
the details present in the image can be clearly seen.
See Figure 8, produced with this technique.
Figure 8: Contrast enhancement technique for better image
analysis.
After that step, we extract the analysis area in an
image, detecting its contours, extracting the relevant
Software 2.0 for Scrap Metal Classification
671
part, thus removing the influence of its background.
This technique makes up Edge Enhancement, that de-
lineates the edges surrounding various objects of in-
terest and makes the shapes and details comprising the
image more conspicuous and perhaps easier to anal-
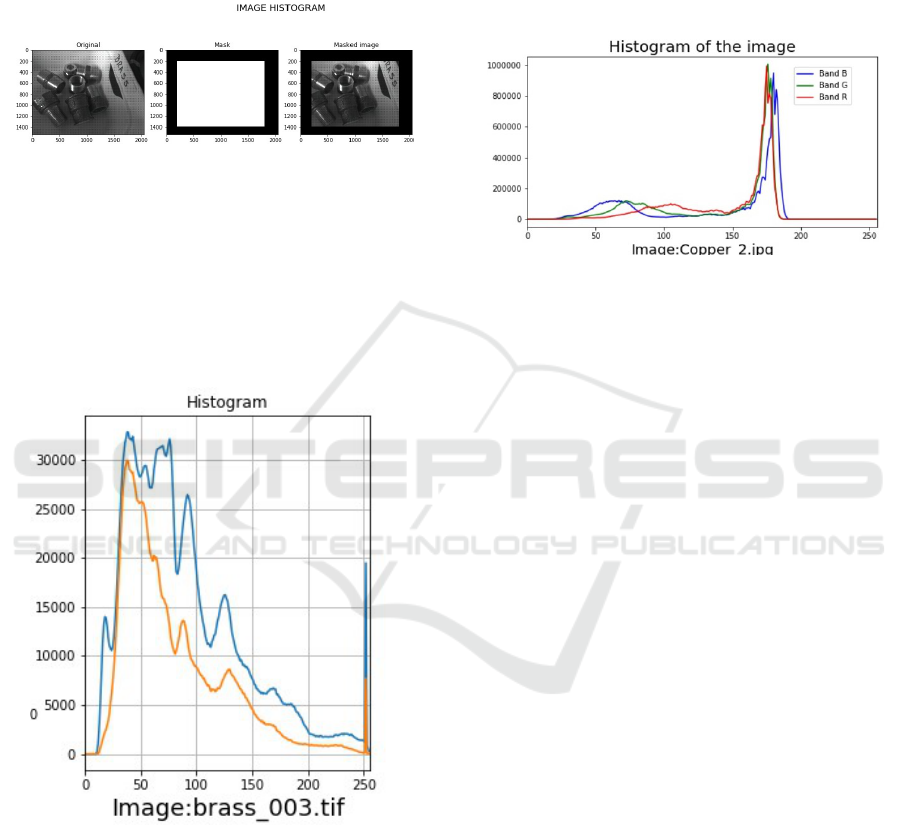
yse. Figure 9 presents this technique.
Figure 9: Plotting extract area to brass histogram.
The background of the image was removed using
techniques of delineation of the contour of the materi-
als, and an auto background with expressive color was
generated. In this case, the color red was used. Tech-
niques were applied to the image obtained from the
contour, disregarding the colors that remained in the
middle of the materials. This eliminates noise in the
image and obtains more assertiveness in the analysis.
Figure 10: Plotting brass histogram.
The Opencv libraries for Python have functionalities
directed to these imaging techniques. The features
have been developed so that they can be adjusted to
the background and context colors where image tech-
niques can be applied. For example, in a black floor
scenario, the colors at the threshold of black should
be considered as image noise. Figure 10, presents this
technique, using Opencv.
Using the histogram image information we can
obtain more technical and visual information. His-
tograms plots how often each intensity value in the
image occurs. Histograms help detect image acquisi-
tion problems, like:
- Over and under exposure;
- Brightness;
- Contrast;
- Dynamic range.
Figure 11: Copper histogram analysis.
Some point operations can be used to alter histogram,
e.g: Addition, Multiplication, Exp and Log and Inten-
sity Windowing (Contrast Modification).
Another issue to consider is the color list used in
the algorithms. Depending on the library used and
the algorithms to implement, each library has its list
of colors. Colour analysis can be made using Mat-
plotlib, or Webcolors colors as a list of valid colors, to
give two examples of used libraries that already have
color lists. For development purposes, a fixed color
list defined was implemented. This color list has the
purpose of serving the color search algorithms in the
context of what is sought.
5 ONGOING WORK
The parameters with higher information were ob-
tained from the histogram of the image. Each ma-
terial has its signature in terms of the spectral image,
both the intensity of its brightness and the positions
of the spectrum, where that maximum is presented.
The minimum values’ positions of the spectrum also
show variations in some materials. This information
is obtained by removing each band of the image. Af-
ter we analysing the maximum value of the spectrum
matrix and its position, in the list of values obtained
(position in the spectrum). The visualization of this
information for copper and brass, can be observed in
Figures 10 and 11, where the difference in the param-
eters is verified in particular in: MaxHistog, IdxMax-
Histog and IdxMinHistog. At the level of the spectral
analysis of each of the bands we have differences be-
tween the band R (Red) and B (Blue) that could be
ICINCO 2019 - 16th International Conference on Informatics in Control, Automation and Robotics
672

observed after a more accurate analysis of the values
of the spectrum, obtained by multiplying its values by
a thousand. The projection of these values presents a
relevant difference, which would not be observed in
Figure 4.
6 CONCLUSIONS
We have already some ML techniques that may al-
low to sectorially develop processes of classifica-
tion of metals. Not all metals have the same ap-
proach and some require several parallel approaches
to achieve classification. Depending on some types
of metal scrap grading requirements, some techniques
will only be possible using Deep Learning. In this
case, the classification of metals is inserted in the ac-
quisition process, where the technique must be dif-
ferent given the large volume of metal that is to be
inspected, and given that it is loaded by truck.
With this approach of ML applied to the images,
it is intended to obtain its classification in terms of the
type of metal used in its composition. Additional ML
methods allowing an analysis of the materials color
are used, so that a phased classification of the mate-
rials can be done. One of the factors to be consid-
ered is the conditions of luminosity in obtaining the
images, and the cleaning of the materials involved in
the images. In an industrial scrap environment, it will
not always be easy to obtain optimum results for the
imaging process, so industrial prototype application
studies should address this issue.
ACKNOWLEDGEMENTS
Thanks to Portucalense University for sharing infor-
mation, contents and follow up of the works on the
theme proposed in this work.
REFERENCES
Andrej Karpathy (2018). Software 2.0 – Andrej Karpathy –
Medium.
Barnab
´
e, P., Dislaire, G., Leroy, S., and Pirard, E. (2015).
Design and calibration of a two-camera (visible to
near-infrared and short-wave infrared) hyperspectral
acquisition system for the characterization of metallic
alloys from the recycling industry. Journal of Elec-
tronic Imaging, 24(6):061115.
Braibant, L., Barnab
´
e, P., Leroy, S., Dislaire, G., and Pi-
rard, E. (2017). Non-ferrous scrap metals classifica-
tion by hyperspectral and multi-energy X-ray trans-
mission imaging. Shaker Verlag - 8th Conference on
Sensor-Based Sorting and Control (SBSC), pages 1–9.
COMPUTAR (2009). Adc lite.
Domingos, P. (2015). The Master Algorithm: How the
Quest for the Ultimate Learning Machine Will Remake
Our World. Perseus Books Group.
Javaid, A. and Essadiqi, E. (2003). Final Report on Scrap
Management, Sorting and Classification of Steel.
Report No. 2003-23(CF) Gouvernment of Canada,
23(August):22.
Kutila, M., Viitanen, J., and Vattulainen, A. (2005). Scrap
metal sorting with colour vision and inductive sensor
array. In International Conference on Computational
Intelligence for Modelling, Control and Automation
and International Conference on Intelligent Agents,
Web Technologies and Internet Commerce (CIMCA-
IAWTIC’06), volume 2, pages 725–729.
Mancini, S. (2013). As vantagens da sucata - 26/11/13 -
ARTIGOS - Jornal Cruzeiro do Sul.
Parliament, T. E. and Council (2003). Directive 2002/96/ec
of the european parliament and of the council. Official
Journal of the European Union.
Paul, Torek; Benjamin, Aubuchon; Kalyani, C. (2016).
Scrap sorting system. US Patents.
Sikka, H. (2018). Democratizing Machine Learning for
Software 2.0 – Medium.
Spencer, D. B. (2005). IDENTIFICAC¸
˜
AO E
CLASSIFICAC¸
˜
AO DE SUCATAS N
˜
AO-
FERROSAS. Fundic¸
˜
ao e Servic¸o -Ano 15 - N
o
.
156.
Vasques, A. C. (2009). Reciclagem de Metais no Brasil.
Technical report, MINIST
´
ERIO DE MINAS E EN-
ERGIA.
Wilson, A., Editor, E., and Systems, V. (2019). Multisen-
sor imaging aids non-ferrous scrap metal sorting. Sys-
tems, Vision, pages 1–7.
Zaparolli, D. (2014). Sider
´
urgicas diversificam meios de
obter sucatas e reaproveitar o ac¸o.
Software 2.0 for Scrap Metal Classification
673
