
Data Quality in Secondary Data Analysis: A Case Study of Ecological
Data using a Semiotic-based Approach
Mila Kwiatkowska
1
and Frank Pouw
2
1
Department of Computing Science, Thompson Rivers University, 805 TRU Way, Kamloops, Canada
2
Department of Environmental Sciences, Thompson Rivers University, 805 TRU Way, Kamloops, Canada
Keywords: Data Quality, Secondary Data Analysis, Ecological Data, Semiotics.
Abstract: Data quality problems are widespread in secondary data when they are used for data warehousing and data
mining. This paper advocates a broad semiotic approach to data quality. The main premises of this expanded
semiotic framework are (1) data represent some reality, (2) data are created and interpreted by humans in a
communication process, (3) data are used for specific purposes by humans, and (4) data cannot be created,
interpreted and used without knowledge. Thus, the semiotic-based approach to data quality in secondary data
analysis has four aspects: (1) representational, (3) communicational, (3) pragmatic, and (4) knowledge-based.
To illustrate these four characteristics, we present a case study of ecological data analysis used in the creation
of an ornithological data warehouse. We discuss the temporal data (ecological notion of time), spatial
ecological data (communication processes and protocols used for data collection), and bioacoustic data
processing (domain knowledge needed for the specification of data provenance).
1 INTRODUCTION
Data quality (DQ) is a well-established research field
and is an essential component of data science, data
warehousing and data mining. The definition,
dimensions, methods of assessment, and management
of DQ have been studied from theoretical and
practical perspectives for several decades (Ivanov,
1972; Andersen, 1991; Wand and Wang, 1996; Price
and Shanks, 2008; Rasmussen 2008; Sebastian-
Coleman, 2013). Previous research has developed
several general approaches and frameworks based on
the understanding of the concept of data, data utilities,
and “data fitness” for the studied problem. They can
be grouped into four main approaches to DQ: system
theoretical, ontological, business (data as a product
and as a service), and semiotic (based on the semiotic
framework for information systems).
The system theoretical approach (Ivanov, 1972)
views data as meaningless digits and characters,
which support information. Thus, DQ is understood
as information quality. This approach defines two
intrinsic aspects of the quality of information:
accuracy and precision. Furthermore, in the system
theoretical approach, the information quality depends
on the quality of the conceptual model and the overall
quality of the system.
The ontological approach (Wand and Wang,
1996) focuses on DQ as a multi-dimensional concept
and defines multiple quality dimensions: accuracy,
precision, legitimacy, validity, reliability, relevance,
importance, consistency, timeliness, completeness,
accessibility, comprehensibility, security, and
usefulness. The framework of Wang and Strong
(1996) organizes these dimensions into four
categories: intrinsic, accessibility, contextual, and
representational.
The business approach (Kahn et al., 1997; Wang,
1998) views data as an asset and as a service. The
approach to data as business asset brings the product
perspective to DQ. The approach to data as service
brings the customer expectations as a measure of DQ.
The semiotic approach to DQ has been developed
by several researchers (Shanks and Darke, 1998;
Shanks and Corbitt, 1999; Price and Shanks, 2004;
Price and Shanks, 2008; Sebastian-Coleman, 2013).
This approach is based on the definition of “data as
signs,” which was introduced by Andersen (1991) as
a part of computer semiotics defined as “a branch of
semiotics that studies the special nature of computer-
based signs.” The semiotic framework for DQ is
based on Stamper’s (1991) semiotic levels: syntactic,
semantic, pragmatic, and social. The first three levels
are defined by Price and Shanks (2004) as follows:
Kwiatkowska, M. and Pouw, F.
Data Quality in Secondary Data Analysis: A Case Study of Ecological Data using a Semiotic-based Approach.
DOI: 10.5220/0007978403770384
In Proceedings of the 8th International Conference on Data Science, Technology and Applications (DATA 2019), pages 377-384
ISBN: 978-989-758-377-3
Copyright
c
2019 by SCITEPRESS – Science and Technology Publications, Lda. All rights reserved
377

(1) syntactic quality determines how well data
corresponds to stored meta-data, (2) semantic quality
defines how the stored data corresponds to the
represented external phenomena, and (3) pragmatic
quality determines the suitability of data for a given
use. The fourth level, social semiotic, is described by
Shanks and Corbitt (1999) as “the shared
understanding of the meaning of symbols.”
In this paper, we take a broader semiotic approach
to DQ. The main premises of the expanded semiotic
perspective are (1) data represent some reality, (2)
data are created and interpreted by humans in a
communication process, (3) data are used for specific
purposes by humans, and (4) data cannot be created,
interpreted and used without knowledge. Based on
these premises, we present a semiotic approach using
four aspects: representational, communicational,
pragmatic, and knowledge-based.
Furthermore, we focus on the problem of DQ in
secondary data analysis. The distinction between
primary data and secondary data (secondary use of
data) is critical for DQ management. Primary data are
collected by organizations and researchers for a
clearly defined purpose. The secondary data analysis
“reuses” the collected data for different purposes. The
secondary data usage includes data warehousing, data
mining, creation of data archives, and building of
integrated repositories, in which the previously
collected data are integrated from multiple sources,
summarized, aggregated and made available to large
groups of users. Furthermore, in many cases, the
primary data collection and use involve tacit
knowledge, which is not formally documented when
the data are used for secondary analysis. Therefore,
traceable data provenance and standardized metadata
specification are the key components of DQ.
This paper is organized as follows. In section 2,
we discuss the necessity of the ecological data sharing
and integration. We discuss the high complexity of
ecological data and we present examples of
ecological data used in the biodiversity studies. In
section 3, we provide a brief introduction to
development of semiotics as the study of signs, sign
systems, and sign processes; and the role of semiotics
as a universal approach and a unifying framework for
multiple disciplines. We describe the proposed
extended semiotic-based framework and give
examples of temporal data (ecological event timing),
spatial data (integration of water-depth measurement,
horizontal cover, and wetland assessment), and time-
series data (bioacoustics signals) to illustrate the
representational, communicational, pragmatic, and
knowledge-based aspects of the extended semiotic
framework. Finally, in the Conclusions section, we
advocate the use of a broader semiotic framework for
DQ in secondary data analysis. We argue that DQ
depends on adequate models of ecological reality,
explicit models of communication and data collection
protocols, specification of data collection goals and
limitations, and explicit specifications of data
provenance.
2 ECOLOGICAL DATA
ANALYSIS
With the availability of small portable sensors for
data collection, ecologists who study biodiversity are
able to acquire, store, and process vast amounts of
ecological data (Pankratz et al., 2017). The large
volumes of sensor-generated data must be integrated
with data coming from other multiple and diverse
sources, such as observations, field surveys, existing
maps and GIS. However, many ecological projects
capture the data in minimally structured formats
without proper mechanism for DQ management
(Madin et al., 2007). The need for a broader
perspective and universal standards in ecological data
collection has been addressed by several researchers
(Cushing et al., 2007; Hampton et al., 2013). This
wider approach allows for (1) data exchange between
ecologists, (2) support for building high-quality data
warehouses and repositories of historical ecological
data, and (3) repurpose and reuse of data for
comprehensive ecological analysis spanning multiple
geographical areas.
Cushing et al. (2007) characterize ecological data
and metadata as “highly complex ontologically,
spatio-temporally and sociologically”. Thus,
ecological data integration, archiving, and data
warehousing have specific requirements regarding
metadata and standardization. In this paper, we
describe an expanded semiotic framework to address
issues concerning DQ in the secondary analysis of
ecological data. We present a case study based on our
experience with data extraction, transformation and
loading in the creation of a data warehouse for the
identification of bird species. This data warehouse,
called ecoDW, is based on multidimensional data
marts implemented in Oracle 12c DBMS. It is a
component of a decision support system proposed to
assist humans in bird identification. EcoDW links
bioacoustics data with their environmental context.
2.1 Ecological Data Provenance
In our case study, we describe the ecological data
DATA 2019 - 8th International Conference on Data Science, Technology and Applications
378

provenance based on the W7 ontological model
proposed by Ram and Liu (2007; 2008) using seven
elements: who, where, what, when, how, which, and
why. The ecological data were made available by Dr.
Erin Bayne from the University of Alberta (Shonfield
and Bayne, 2017). The data (7,957 records), which
span two years (2014-2015), were extracted from the
database maintained by the Ecological Monitoring
Committee of the Lower Athabasca region
(EMCLA). The EMCLA project collects the data for
monitoring uncommon species: owls, amphibians,
and yellow rails. The EMCLA database includes: (1)
bioacoustics recordings downloaded from automated
recording units (ARUs), (2) geographic locations and
timestamps for the recordings, and (3) results from
field assessments done by the technicians around
some of the ARUs (water depth, density of vegetation
and wetland type). These habitat data were integrated
with habitat characteristics derived from CanVec+
habitat maps (Natural Resources Canada, 2014) and
the Alberta Digital Elevation Model. Large portion of
the data in EMCLA database has been collected for
the studies of the Yellow Rail (Coturnicops
noveboracensis), a small, marsh-dwelling bird that
occupies wetlands across southern and central
Canada (Leston and Bookhout, 2015).
3 SEMIOTIC-BASED APPROACH
Originally, the term ‘semiotics’ (from a Greek word
for sign sēmeîon) was introduced by the physician
and philosopher Galen (129-199), who classified
semiotics as a branch of medicine (contemporary
symptomatology). The term ‘semiotics’ (originally
semiology) as a study of signs and sign systems in
language was introduced by the Swiss linguist
Ferdinand de Saussure (1857-1913). The Saussurean
approach to semiotics is dyadic. It is based on two
features: (1) the signified, which is the concept or
object and (2) the signifier, which is indicating the
signified. The term ‘semiotics’ was redefined by the
American logician and philosopher Charles Sanders
Peirce (1839-1914) as a study of all signs (including
non-linguistic signs) and the semiotic process
(semiosis) as “an irreducibly triadic relation among a
sign, its object, and its interpretant” (Sebeok, 1999).
Contemporarily, semiotics is a discipline which can
be broadly defined as the study of signs, sign systems,
and sign processes. Sign processes (in generalized
sense) are underlying the functioning of all living
organisms and, even, the products of humans, such as
computers, sensors, and automata (Sebeok, 1999).
Thus, the semiotic approach and semiotic-based
frameworks have been used in almost all disciplines,
from literary studies through biology to information
science and computer science. A semiotic paradigm
is characterized by its universality, but, at the same
time, it is associated with different traditions and
multiple empirical methodologies. Therefore, to
avoid misinterpretation, we briefly describe basic
terminology needed to present our ecological case
study.
Peirce defined “sign” as any entity carrying some
information and used in a communication process.
Peirce, and later Charles Morris, divided semiotics
into three categories: syntax (the study of relations
between signs), semantics (the study of relations
between signs and the referred objects), and
pragmatics (the study of relations between the signs
and the agents who use the signs to refer to objects in
the world). This triadic distinction is represented by a
Peirce’s semiotic triangle (shown in Figure 1): the
representamen (the form which the sign takes), an
interpretant (the sense made of the sign), and an
object (an object to which the sign refers).
Figure 1: Peirce’s triadic representation of semiosis.
3.1 Representational Aspect
In the extended semiotic-based framework for DQ,
the representational aspect refers to semantics (the
study of relations between signs and the referred
objects). As stated by Kent (1978) “An information
system (e.g., database) is a model of a small, finite
subset of the real world.” Thus, in this sense, data
(data models) represent some parts (views) of reality.
However, reality can be perceived from different
perspectives (worldviews). For example, notion of
time is dependent on the worldview of specific group
of people (or specific purpose). Temporal data are
essential for the analysis of migratory movements and
diurnal/nocturnal behaviours of birds. Specifically,
season and time of day in relationship to sunrise and
sunset are crucial in ecology. Therefore, in our study,
the date and time stamp (from the original data) was
transformed into the ecologically meaningful notion
of time as time before and after sunrise and time
before and after sunset. Thus, new temporal attributes
were constructed using the recording’s civil time and
Re
p
resentamen
Interpretant
Ob
j
ect
Data Quality in Secondary Data Analysis: A Case Study of Ecological Data using a Semiotic-based Approach
379

the ARU’s geographic location. The examples of the
primary data are shown in Table 1. The first column
contains time represented by the ISO 8601 standard:
YYYY-MM-DD, 24-hour clock and an offset from
the UTC time (6 hours before the UTC time). The
second column contains the geographic location
represented by the ISO 6709 standard: latitude and
longitude coordinates in decimal degrees.
Table 1: Automatically recorded date and time data and
geographic point location.
ID
Civil Time
ISO 8601
Geographic Location
ISO 6709
1 2014-06-18 08:36 -06.00 55.72731 -110.9788
2 2014-05-29 08:36 -06.00 56.22676 -110.84226
3 2014-06-08 05:00 -06.00 56.89742 -111.91476
The date/time and geographic location attributes were
used to calculate local sunrise and sunset times (using
the maptools package from the R studio). The timing
of the sunrise/sunset is calculated for two calendar
days giving four attributes: last and next sunrise time
and last and next sunset time. Table 2 shows the
calculated local last sunrise and sunset times for the
records from Table 1.
Table 2: Calculated last sunrise and sunset times.
ID Last Sunrise Time Last Sunset Time
1 2014-06-18 04:38 2014-06-17 22:11
2 2014-05-29 04:47 2014-05-28 21:53
3 2014-06-08 04:36 2014-06-07 22:16
The sunrise and sunset times were used to calculate
the time elapsed after sunrise and the time before
sunset. The results for the three records are shown in
Table 3.
Table 3: Examples of automatically recorded date and time
and sunrise/sunset oriented timing.
ID Civil Time ISO 8601
Time After
Sunrise (min)
Time Before
Sunset (min)
1 2014-06-18 08:36 -06.00 23
7
81
5
2 2014-05-29 08:36 -06.00 22
4
80
4
3 2014-06-08 05:00 -06.00 2
3
1,03
7
The described transformation process illustrates
the need for an explicit ecological model of reality, in
which the notion of time is based on the sunrise and
sunset. The sunrise and sunset timing, daybreak,
dawn, first hours after sunrise, twilight, and the
number of hours of daylight are essential for the
studies of bird activities, such as vocalization,
foraging, roosting or migration. For example, the
yellow rails vocalize most frequently after complete
darkness. As another example, common swifts (Apus
apus) perform daily vertical ascents (up to 2.5 km) in
the twilight of dawn and dusk (Dokter et al., 2013).
3.2 Communicational Aspect
The expanded semiotic-based approach stresses the
fact that data are created and interpreted by humans
(in general, living entities or artificially created
agents) in a communication process. The
communicational aspect is even more important in the
secondary data analysis, where data come from
multiple and, often, heterogeneous sources and the
participants/agents have multiple perspectives.
In our case study, the primary data for the habitat
include an ARU’s geographic location and in-field
habitat assessment. Since in-field assessments were
done for some ARU locations, the habitat
characteristics for the remaining ARUs were derived
from CanVec+ habitat maps (Natural Resources
Canada, 2014) and the Alberta Digital Elevation
Model. As a result, the secondary data for the habitat
have three sources: automatically measured
geographic locations, human observations, and the
generalized habitat maps (based on aggregated data
from several years).
We argue that secondary data analysis requires (1)
an explicit communication model for all agents: ARU
(automata), field technicians, and GIS specialists; and
(2) explicit specification of the data collection
protocols. The following three examples illustrate the
complexity of the ecological data collection and the
necessity of explicit communication and protocol
specifications.
3.2.1 Water Accumulation Data
Water accumulation data were based on the water
depth measurements done manually by the
technicians using a meter stick at 21 points around
ARUs, yielding values between 0 and 100 cm (the
length of the meter stick). However, the technicians
were not able to take all measurements (in some
places water was too deep to measure or the wetland
was unsafe to walk on). The technicians
communicated the fact that the measurement was
impossible by entering values out of range (negative
values and values > 100), so called sentinel values.
Thus, 165 records had invalid values (disguised
missing values), which had to be omitted in the pre-
processing for the ecoDW. Table 4 shows the invalid
values and their frequency.
DATA 2019 - 8th International Conference on Data Science, Technology and Applications
380
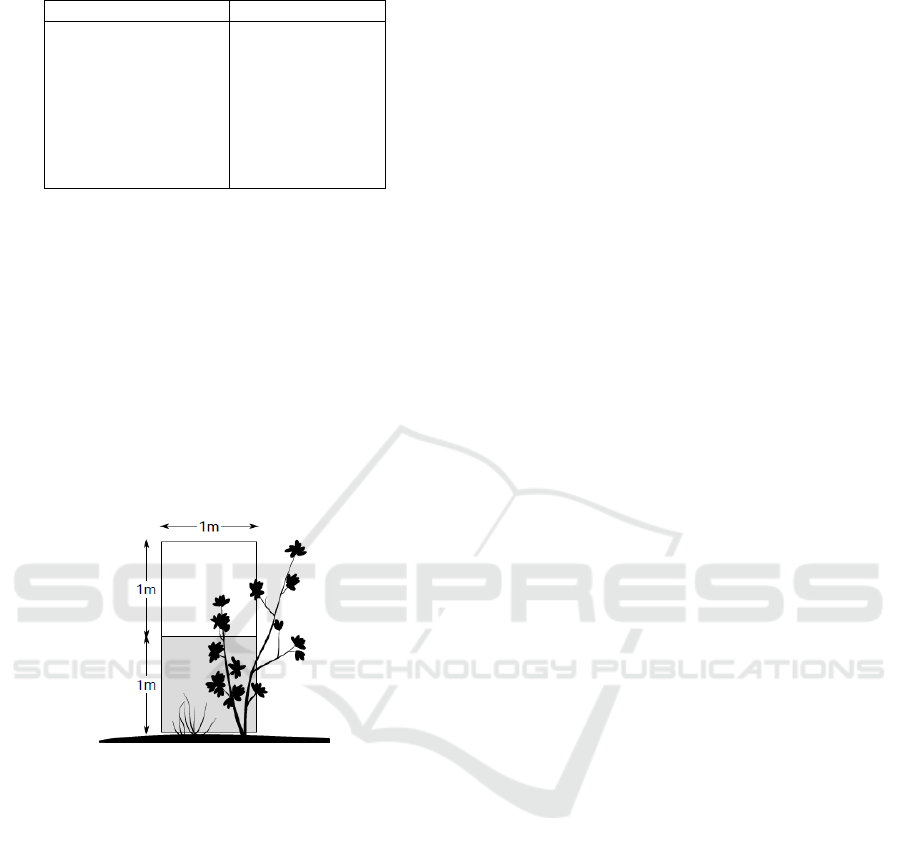
Table 4: Disguised missing data for the water depth.
Depth Recorded (cm) Number of Records
99,999
9,999
999
-5
-881
-882
-883
-884
12
15
18
3
9
88
13
7
3.2.2 Horizontal Cover Data
The protocol for horizontal cover (density of
vegetation) estimation uses cover boards (1 x 1 m
square) placed at 0.5 m and at 1.5 m above the ground
for 5 points around the ARU. Horizontal coverage
estimates range from completely un-obscured (0%) to
completely obscured (100%). Figure 2 illustrates the
use of cover boards. The low cover (grey cover board
square) is estimated as 30% and the high cover (white
cover board square) is estimated as 10%. The
horizontal cover is calculated as 20% (an average of
the low and high covers).
Figure 2: Sketch of a horizontal cover board in use.
In some circumstances the placement of the board
was impractical, and the technicians communicated
this fact by entering values outside of valid range (57
records had invalid values).
3.2.3 Wetland Assessment Data
In our study, the protocol for the wetland assessment
(wetland type identification) used the Ducks
Unlimited Enhanced Wetland Classification
(DUEWC) (Ducks Unlimited, 2015). The percentage
of each DUEWC category was judged and recorded
by the technicians. The DUEWC codes were
provided for the manual data entry at the site.
However, for some sites (e.g., disturbed habitats) the
technicians were not able to find corresponding
codes, and they entered description (not DUEWC
class) to communicate the unusual habitat, for
example: “burn”, “compressor”, “cutline”, and
“highway”. Although these descriptions represent
invalid values, they are important for the ecological
studies. Therefore, we have created new habitat
categories for ecoDW: “Undefined”, “Anthropogenic
Disturbance” and “Natural Disturbance.”
3.3 Pragmatic Aspect
In the expanded semiotic-based framework for DQ,
the pragmatic aspect is understood in a broad sense
and it combines the pragmatic level and the social
level from the semiotic DQ framework proposed by
Shanks and Corbitt (1999). Thus, we define
pragmatic aspect as usability and usefulness (Kahn et
al. 1997) and, also, as integration of stakeholder
viewpoints, biases, cultural and political aspects
(Shanks and Corbitt, 1999). Our broad definition of
pragmatic aspect is based on the European continental
pragmatic tradition (perspective approach), in which
pragmatics is viewed as “a general functional (i.e.
cognitive, social and cultural) perspective on
linguistic phenomena” (Huang, 2007).
We illustrate the pragmatic aspect of DQ using an
example of the purpose of the water depth
measurements. The main goal of the in-field water
depth measurements was not to determine water
accumulation but to study the preferred habitat of
yellow rails: marshes with shallow water and areas
with an average early-July water depth of 5-10 cm.
Since the water depth fluctuates (due to weather
conditions) and the in-field measurements have
limited precision, we used a fuzzy-set approach to
transform the measurements into fuzzy linguistic
variables. For the secondary data analysis, we have
created fuzzy membership functions for shallow,
medium, and deep water. Thus, the optimal habitat
for the yellow rail was defined between shallow and
medium. This approach reduced the dimensionality of
data and, at the same time, allowed for efficient
identification of preferred habitats.
3.4 Knowledge Aspect
In the expanded semiotic-based framework for DQ,
the knowledge aspect is orthogonal to the
representational, communicational, and pragmatic
aspects. Each of these three aspects requires specific
domain knowledge. Furthermore, we argue that in
secondary data, the tractability of the data to the
primary sources is critically important – data
provenance is a key component of the quality of
secondary data. We present an example of a
bioacoustics signal processing to illustrate the need
Data Quality in Secondary Data Analysis: A Case Study of Ecological Data using a Semiotic-based Approach
381
for an explicit specification of the transformation
steps for the derivation of secondary data. This
specification allows to (1) re-run the transformations
for new primary data and (2) perform an audit to
evaluate secondary data quality.
3.4.1 Data Provenance Specification
Bioacoustic signal processing is knowledge-intensive
and data-centric (Di Ciccio et al., 2015); therefore, it
requires an explicit specification of domain
knowledge and the required workflows. In our study,
the bioacoustic files (ARU’s field recordings) are
processed and used for bird identification.
In general, two approaches are used for pattern
identification in bird vocalizations: feature-based
matching and time-series analysis. The feature-based
identification uses more than 40 features, and the
types of features depend on a particular bird species.
Since ecoDW stores data for multiple species, the
time-series analysis with dimensionality reduction
has been chosen. For the acoustic data
transformations, we used the Piecewise Aggregate
Approximation (PAA) technique, which was
introduced by Keogh et al. (2000). PAA compared
favourably to other signal-reduction techniques such
as Discrete Fourier Transform and Discrete Wavelets
Transform (Keogh et al., 2000) and has the additional
advantage of equalizing signals that differ only in
intensity (loudness can be ignored in bird
identification) through signal normalization (Kasten
and McKinley, 2007). Next, the PAA was converted
to a symbolic representation using a lower bounded
approximation of the Euclidean distance of the
original time series through the process of Symbolic
Aggregate approXimation (SAX) (Lin et al., 2003).
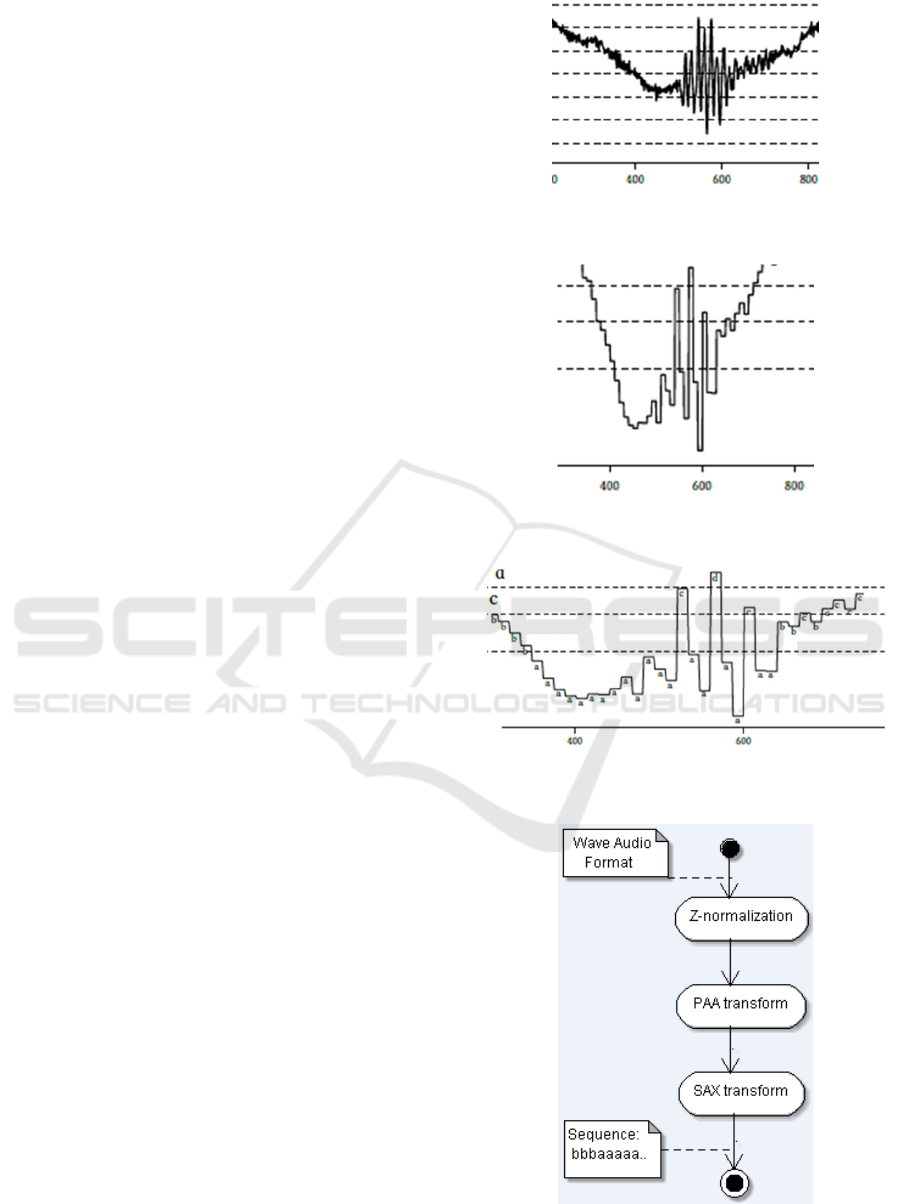
Figure 3 shows a short segment of an acoustic
recording of a Yellow Rail (Coturnicops
noveboracensis) typical vocalization, called “click”.
The segment uses a Waveform Audio File Format
which represents analogue sound as amplitude over
time. Figure 4 shows the PAA representation and
Figure 5 shows the final results from SAX symbolic
representation using 8-letter alphabet. Thus, the
bioacoustic signal for a typical call of yellow rail is
transformed to “bbbaaaaaaaaaaacaadaacaabbcb”.
The bioacoustic processing is intrinsically
complex. Therefore, all steps with specific
transformation methods and their parameters must be
clearly defined. Figure 6 shows the workflow for
bioacoustic signal processing used for secondary data
derivation. We use an UML activity diagram to
represent the three steps of the workflow: Z-
normalization, 10-fold PAA reduction, and symbolic
SAX reduction based on 8-letter alphabet.
Figure 3: Segment of acoustic recording for a single “click”
in a Yellow Rail vocalization.
Figure 4: The “click” segment reduced by the 10-fold
Piecewise Aggregate Approximation (PAA).
Figure 5: The PAA “click” segment in a Symbolic
Aggregate approXimation (SAX) representation.
Figure 6: Workflow for the PAA/SAX transformation from
a bioacoustic signal to a sequence of symbols.
DATA 2019 - 8th International Conference on Data Science, Technology and Applications
382

The symbolic representation of bird vocalization
has two main advantages: (1) significant reduction of
the required space in the database and (2) availability
of various text mining algorithms for data analysis.
4 CONCLUSIONS
In this paper, we advocated the use of a broader
semiotic perspective on data quality in secondary data
analysis. We proposed an expanded semiotic
framework based on four aspects: representational,
communicational, pragmatic, and knowledge-based.
We have shown that knowledge aspect is orthogonal
to the other aspects, and requires an explicit
specification. The expanded framework has been
used for ecological secondary data analysis and
transformation in the creation of an ornithological
data warehouse, ecoDW. We presented examples of
ecological data analysis and transformation to
illustrate four main premises of the expanded
semiotic framework: (1) data represent some reality,
(2) data are created and interpreted by humans in a
communication process, (3) data are used for specific
purposes by humans, and (4) data cannot be created,
interpreted and used without knowledge. These four
premises were used to define the four aspects of our
framework: representational, communicational,
pragmatic, and knowledge-based.
We illustrated the representational aspect using
the example of the conversion of civil date-time
stamp and geographic location into ecologically
useful temporal data representing hours before and
after sunrise and sunset. We demonstrated the
communicational aspect using three examples: the
measurement of water depth, horizontal cover and
habitat classification. In all three examples, the
problems with in-field data collection forced the
technicians to enter invalid values as sentinels (out of
range values or descriptions instead of valid codes) to
communicate their atypical observations. These
“invalid values” were carefully analysed and used for
secondary data modelling. We illustrated the
pragmatic aspect using the goal-oriented approach to
fuzzification of imprecise primary data. In particular,
we described the re-use of water depth measurements
for the creation of fuzzy descriptors for the preferred
habitats for bird species (e.g., Yellow Rail).
Furthermore, we demonstrated that each step in data
collection, analysis, and transformation requires pre-
existing domain knowledge (data cannot exist
without knowledge). Thus, the knowledge aspect is
orthogonal to all three aspects: representational,
communicational, and pragmatic. For example, the
addition of new classes to the habitat groups were
done after careful analysis of data to preserve the
observational data about the environment of the study
sites. Otherwise, a mechanical cleaning of data by
removing the data with invalid codes would eliminate
important information about anthropogenic and
natural disturbances. In addition, we illustrated the
knowledge-based aspect using the specification for
bioacoustic signal processing based on PAA/SAX
transformation. This transformation process converts
a complex acoustic signal into a string of characters
(based on 8-letter alphabet) and preserves sufficient
discriminatory information for the inter-species bird
identification. We showed that knowledge-intensive
data transformations and derivation of secondary data
require explicit specification of the domain
knowledge and workflow protocols.
This paper presented data quality framework as a
crucial component of secondary data analysis. It
outlined the first steps in explicit specification of
semiotic-based aspects using a case study of
ecological data. Future work has two directions:
practical and theoretical. The practical direction
requires further testing and evaluation of ecoDW,
which has been created as a first component of a
decision support system for bird identification. The
theoretical direction requires further work on building
the semiotic-based framework based on existing
approaches to metadata specification (e.g., RDF Data
Cube ontology from W3C with extensions for spatio-
temporal components) and workflow specifications
for data provenance. Furthermore, more research is
needed for the possible use of Linked Data approach
and future publication of the data on a SPARQL
endpoint with tools for data visualization and
exploration for the ornithologists and environmental
researchers.
REFERENCES
Andersen, P. B., 1991. A Theory of Computer Semiotics,
Cambridge University Press.
Cushing, J. B., Nadkarni, N., Finch, M., Fiala, A., Murphy-
Hill, E., Delcambre, L. and Maier, D., 2007.
Component-based end-user database design for
ecologists. Journal of Intelligent Information Systems.
29(1): 7-24.
Di Ciccio C., Marrella, A. and Russo, A., 2015.
Knowledge-Intensive Processes: Characteristics,
Requirements and Analysis of Contemporary
Approaches. Journal of Data Semantic, 4(29): 29–57.
Dokter, A. M., Akesson, S., Beekhuis, H. et al., 2013,
Twilight ascents by common swifts, Apus apus, at
Data Quality in Secondary Data Analysis: A Case Study of Ecological Data using a Semiotic-based Approach
383

dawn and dusk: acquisition of orientation cues? Animal
Behaviour, 85(3): 545-552.
Ducks Unlimited, 2015. Field Guide of Boreal Wetland
Classes in the Boreal Plains Ecozone of Canada.
Version 1.1.
Hampton, S. E., Stasser, C. A., Tewksbury, J. J., Gram, W.,
Budden, A. E., Batcheller, A. L. et al., 2013. Big data
and the future of ecology, Frontiers in Ecology and
Environment, 11(3): 153-162.
Huang, Y., 2007. Pragmatics, Oxford University Press Inc.,
New York. NY, USA.
Ivanov, K., 1972. Quality-control of information: On the
concept of accuracy of information in data-banks and
in management information systems. Stockholm: The
Royal Institute of Technology KTH. Unpublished PhD
thesis.
Kasten, E. P. and McKinley, P. K., 2007. MESO:
Supporting online decision making in autonomic
computing systems. IEEE Transactions on Knowledge
and Data Engineering. 19(4):485–499.
Kahn, B. K., Strong, D. M. and Wang, R. Y. 1997. A Model
for Delivering Quality Information as Product and
Service. In Proceedings of International Conference on
Information Quality, Cambridge, 80-94.
Kent, W., 1978. Data and Reality: Basic Assumptions in
Data Processing Reconsidered, Elsevier Science Inc.,
New York, NY, USA.
Keogh, E., Chakrabarti, K., Pazzani, M., and Mehrotra, S.,
2000. Dimensionality reduction for fast similarity
search in large time series databases. Knowledge and
Information Systems, 3(3):263–286.
Leston, L. and Bookhout, T. A., 2015. Yellow Rail
(Coturnicops noveboracensis), version 2.0. In The Birds
of North America, Poole, A. F. editor, Cornell Lab of
Ornithology, Ithaca, NY, USA.
Lin, J., Keogh, E., Lonardi, S. and Chiu, B. 2003. A
symbolic representation of time series. In Proceedings
of 8th ACM SIGMOD Workshop on Research Issues in
Data Mining and Knowledge Discovery, 2–11.
Madin, J., Bowers, S. and Schilhauer, M., 2007. An
ontology for describing and synthesizing ecological
observation data, Ecological Applications, 2, 279-296.
Natural Resources Canada, 2014, CanVec+ Feature
Catalogue, Technical Report, Sherbrooke, QC.
Pankratz, R. F., Hache, S., Sólymos, P. and Bayne, E. M.,
2017. Potential benefits of augmenting road-based
breeding bird surveys with autonomous recordings.
Avian Conservation and Ecology, 12(2):18.
Price, R., and Shanks, G., 2004. A Semiotic Information
Quality Framework, In Proceedings of the IFIP
International Conference on Decision Support Systems
(DSS2004), Prato, Italy, 658-672.
Price R., and Shanks G., 2008. Data Quality and Decision
Making. In Handbook on Decision Support Systems 1.
International Handbooks Information System.
Springer, Berlin, Heidelberg.
Ram, S. and Liu, J., 2007, W7 Model: an Ontological
Model for Capturing Data Provenance Semantics. In
Lecture Notes in Computer Science 4512. Chen, P.
Editor, Springer: 17-29.
Ram, S. and Liu, J., 2008, A Semiotics Framework for
Analyzing Data Provenance Research, Journal of
Computing Science and Engineering, 2(3): 221-248.
Rasmussen, K. B., 2008. General Approaches to Data
Quality and Internet-Generated Data, In Nigel G
Fielding, N. G., Raymond M Lee, R. M. and. Blank, G.
Editors, The Sage Handbook of Online Research
Methods, London: Sage, 79-96.
Sebastian-Coleman, L., 2013. Measuring Data Quality for
Ongoing Improvement: A Data Quality Assessment
Framework. Morgan Kaufmann Publishers Inc., San
Francisco, CA.
Sebeok T. A., 1999, Signs: An introduction to semiotics.
University of Toronto Press.
Shanks, G. and Corbitt, B., 1999. Understanding data quality:
Social and cultural aspects. In Proceedings of the 10th
Australasian Conference on Information Systems,
Wellington: MCB University Press Ltd., 785–797.
Shanks, G. and Darke, P., 1998. Understanding Metadata
and Data Quality in a Data Warehouse, Australian
Computer Journal, 30(4): 122-128.
Shonfield, J., and Bayne, E. M., 2017. Autonomous
recording units in avian ecological research: current use
and future applications. Avian Conservation and
Ecology 12(1):14.
Stamper, R., 1991. The semiotic framework for information
systems research, In Information Systems Research:
Contemporary Approaches and Emergent Traditions,
Nissen, H., Klein, H. and R. Hirshheim, R. editors,
North Holland: Elsevier Science Publishers, 515–527.
Wand, Y. and Wang, R. Y., 1996. Anchoring data quality
dimensions in ontological foundations,
Communications of the ACM, vol. 39 (11): 86–95.
Wang, R. Y., 1998. A product perspective on total data
quality management, Communications of the ACM,
41(2): 58-65.
Wang, R. Y. and Strong, D, 1996. Beyond Accuracy: What
Data Quality Means to Customers, Journal of
Management Information System, 12(4): 5-33.
DATA 2019 - 8th International Conference on Data Science, Technology and Applications
384
