
A Simulator for Drones and FANET Management Supporting
Multimedia Traffic under Human Mobility
M. Tropea, F. De Rango and P. Fazio
Dimes Department, University of Calabria, via P. Bucci 39/c, 87036 Rende (CS), Italy
Keywords:
FANET, Coverage, Drones, Mobility Model, Footprint, Simulator.
Abstract:
In this paper a simulator for the management of a team of Unmanned Aerial Vehicles (UAVs) and drones has
been proposed. This new network is known as Fly Ad-Hoc Network (FANET), and it is a particular type of
Mobile Ad-Hoc Network (MANET) but with some specific aspects that allow to provide new services in future
generation networks. One of the possible applications is emergency situations or scenario where drones can
provide an additional or complementary access networks supporting web services and multimedia traffic. In
this paper a simulator for FANET deploying has been proposed providing the possibility to simulate different
scenarios with different coverage areas. New coverage model has been included in the features and also
interesting human mobility model to support more realistic users mobility. Moreover, additional modules for
traffic pattern generation have been implemented to create scenario where mobile users can activate multimedia
calls and traffic on FANET. Some simulations have been led out to show how the simulator works.
1 INTRODUCTION
In this paper the capability of Unmanned Aerial Ve-
hicles (UAVs) of providing wireless connectivity to
users in a coverage area is analyzed. These devices
are able to form temporary communication network
in order to cover specific regions in many different
situations such as disaster and emergency events. In
particular, in this paper the task is that to provide a
study on a simulation environment created ad hoc for
the UAVs/drones coverage purpose. The proposed
simulator is realized in java and it is a platform able
to permit of simulating different scenarios and situa-
tions in which users need to communicate each other.
The simulator is able to consider a real map get by
Google on which insert a series of specific Points of
Interest (PoI) that represent the points in which users
move in order to reach the prefixed destination. The
simulator permits to set a series of parameters such
as users mobility, drone height and coverage radius,
different types and percentage of users in the map,
type of multimedia traffic and its percentage in the
simulation. Moreover, the paper proposes two mod-
els, a human mobility model, that tries to provide a
way the users use for moving in the covered area, and
a footprint model, able to model the drone channel
and to provide the mathematical formulation for cal-
culating the correct height of the drone on the base
of the coverage radius. Moreover, in order to calcu-
late the available bandwidth for the drones in the path
followed by the users in their movements, a standard
Link State protocol has been considered in which the
topological changes are due to change in the parame-
ters status (bandwidth along the path) and the protocol
update are operated on periodical base. The results of
the simulative campaigns are shown in order to vali-
date the goodness of the proposed simulator software.
There are other important topics that are object of re-
search about Drones beyond the coverage providing
such as that regards the bandwidth management per-
forming mobility prediction of the users and the op-
portune admission call (Fazio et al., 2012; Fazio et al.,
2016; Fazio et al., 2017). The rest of this paper is
organized as follows: Section 2 presents the related
work on the considered research topic. In Section 3, a
description of the FANET simulator is given. In Sec-
tion 4, we describe the simulation environment cre-
ated in java. Section 5 shows the simulator implemen-
tation details. The numerical results are presented in
Section 6. Finally, Section 7 concludes the paper.
2 RELATED WORK
In the last years a lot of research has been focused
on the Unmanned Aerial Vehicles (UAVs) technology.
376
Tropea, M., De Rango, F. and Fazio, P.
A Simulator for Drones and FANET Management Supporting Multimedia Traffic under Human Mobility.
DOI: 10.5220/0007979003760383
In Proceedings of the 9th International Conference on Simulation and Modeling Methodologies, Technologies and Applications (SIMULTECH 2019), pages 376-383
ISBN: 978-989-758-381-0
Copyright
c
2019 by SCITEPRESS – Science and Technology Publications, Lda. All rights reserved

Many researchers have analyzed and studied many
different aspects of these new devices in order to show
their potentiality and capacity in many real contexts.
2.1 Simulator of Drones and UAVs
In this paragraph some of the literature works about
simulators proposed for UAVs/Drones devices under
different points of view and applicative domains will
be presented. The papers (De Rango et al., 2017a;
De Rango et al., 2017b) propose a simulator suit-
able for the agriculture domain in order to design
novel coordination and control techniques of a UAVs
team. The works presented many coordination tech-
niques both for monitoring the area and for coordinat-
ing the actions of the drones in the presence of par-
asites in order to analyze how the performance can
significantly change if more constraints, such as en-
ergy, communication range, resource capacities, are
accounted. In (Bustamante et al., 2017) the authors
present the development of a virtual reality simula-
tor for the management of a UAV (Unmanned Aerial
Vehicle), focused on improving the quality of grown-
up people. This research has collected characteris-
tics of gestures and physical movements from users
made by other related research in order to study the
same interaction within a virtual world. In (Lom-
bardo et al., 2016) the authors adopt the popular ap-
proach of leveraging the X-Plane flight simulator to
simulate the environment and aircraft dynamics. This
approach has found recent success in visualizing and
optimizing algorithms for basic UAV flight control
as well as formation flight. In (Zema et al., 2017)
the authors describe a novel simulation architecture
to implement distributed networked control systems.
Their proposal consists in the integration of already-
present and validated solutions into a compact pack-
age that features scalability and negligible architec-
tural delays.
2.2 Coverage Issues in Drones
In this paragraph some works about coverage issues
are shown. This typology of research is very studied
and analyzed because the FANET represents a tech-
nology able to improve and guarantee prompt help in
many real emergency situations. Then, many aspects
of the coverage and connectivity issues are object of
study. In (Al-Hourani et al., 2014) the authors pro-
vided a statistical generic Air-to-Ground RF propaga-
tion model for Low Altitude Platforms (LAPs), that
can substantially facilitate the planning efforts of air-
borne wireless services, since the RF planning can be
performed based on merely simple urban parameters,
rather than depending on site specific 3D-models that
are unlikely to be easily available and updated. In
(Park et al., 2015), an effective coverage decision al-
gorithm is proposed, which aims at providing seam-
less handover and thus establishing a fully connected
aerial network. They further calculate the seamless
handover success probability and the false handover
initiation probability to evaluate the proposed cover-
age decision algorithm. (Sae et al., 2016) studies the
coverage aspects of a Low Altitude Platform (LAP)
system that can form a temporary communication net-
work. The system consists of multiple autonomous
drones equipped with dual-band Wi-Fi access points
(APs) with ad hoc capabilities to form a mesh net-
work. The suitability of the LAP system is evaluated
from the coverage point of view with calculations and
simulations. In (Xie et al., 2017), the authors intend to
study the optimal deployment density of Drone Small
Cells (DSCs) to achieve maximum coverage consid-
ering the inter-cell interference considering both LoS
and NLoS links.
3 FANET SIMULATOR
The simulator to be implemented must allow to ana-
lyze the trend over the time of a network composed of
drones. The drones fly over a city and communicate
with each other trying to create a network through an
appropriate messages exchange. During the flight the
drones will have to be able to guarantee a connection
to the people who are within their coverage range and
who request the connection. The purpose of the sim-
ulations is therefore to analyze the network in terms
of bandwidth occupation, delays and lost packet. The
simulation area is a map that can be taken by google
maps platform in order to make the proposed environ-
ment extremely general and parametric. This permits
of considering whatever area in which we want an-
alyze the human movements on the basis of chosen
area characteristics while the users utilize their multi-
media applications such as Video and VoIP calls. The
chosen area has been represented by the class ”Grid”.
It contains all the information as: number of people in
the map; the number of clients classified by typology;
number of used drones; size of the field; list of Points
of Interest where a person can stop.
While the main actors are represented by the
classes:
• Drone: could be defined as the main class, as
guarantor of the functioning of each protocol that
is developed, such as the Link State, for the real-
ization of the network.
A Simulator for Drones and FANET Management Supporting Multimedia Traffic under Human Mobility
377
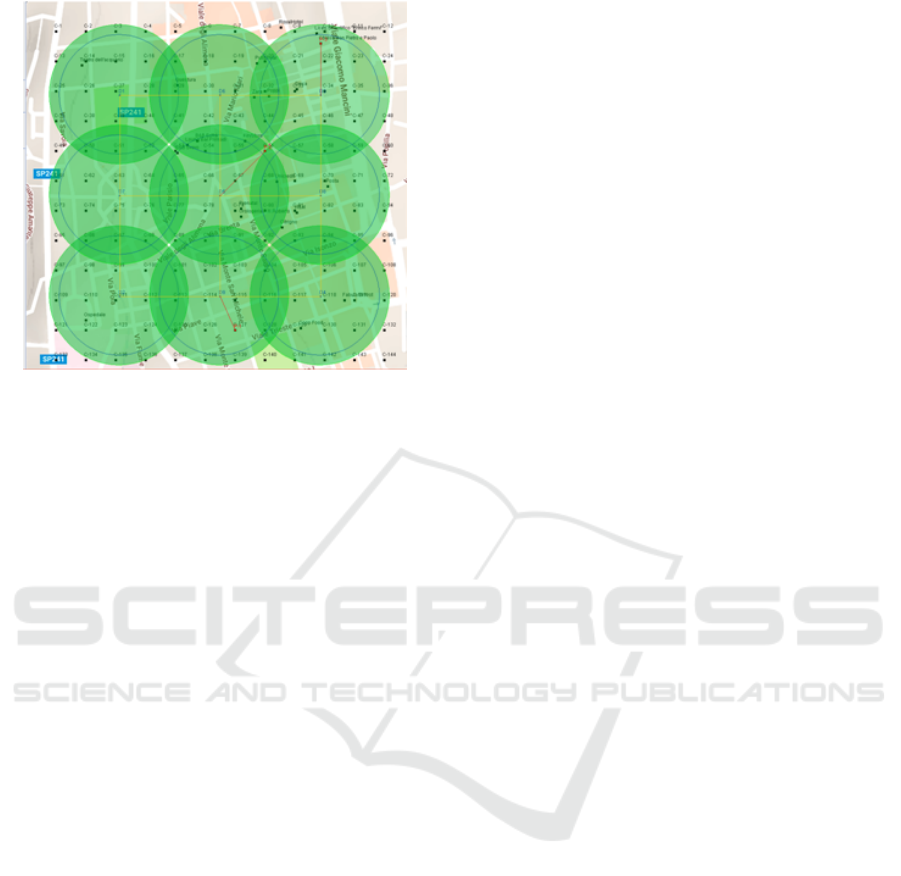
Figure 1: Reference Scenario with drone coverage foot-
print.
• Client: a person must follow a specific model of
mobility, which we will see in the following, and
must be able to have the possibility of making au-
dio and video calls. He must also be able to send
information, such as his position, to the people
who request it.
As said so far, the paper focuses on the realiza-
tion of a simulator that allows to analyze a network
composed of drones, a FANET. For the realization of
this network we have relied on a classical graph struc-
ture, in which the nodes represent the Drones and the
Clients, and the links represent the connections be-
tween them. The graph is created considering a sparse
graph since the number of edge departing from a node
is independent of the number of nodes in the graph.
The network will be created by exchanging messages
between nodes that are at a distance allowing com-
munication. So the number of links varies according
to the number of nodes in the network and to their
distance. A key feature of our simulations is to keep
track of changes in link bandwidth, so, in addition to
information regarding the distance between nodes, an
edge stores the bandwidth parameter. Furthermore, an
edge is always identified by the couple of nodes that
it links. To manage the neighborhood information be-
tween nodes, a list is created for each vertex where
neighboring vertices will be stored.
3.1 FANET Creation and Management
The network is created dynamically by exchanging
messages between drones and also between drones
and clients. The main feature of the network is
that it must be able to create and manage itself au-
tonomously even when there are topological changes
or changes that affect the status of the links. For this
task, in this work, the FANET network uses one of the
most popular routing protocols, the Link State proto-
col. The method ”StartLinkState()” was implemented
in the Drone class to manage Link State operation.
This method is called up whenever a change of state
occurs in the network.
The following messages are sent for the creation
of the FANET:
• HELLO: it allows establishing the connection be-
tween drones and between drone and client;
• ACK: drone message of response to the received
Hello message;
• BYE: it allows the disconnection from the drone,
both for drones and for clients;
• LSA (Link State Advertisement): it contains the
Link State Table of the reference drone and will
be forwarded in flooding to all the nodes of the
network.
• LSU (Link State Update): it is a Link Update (LU)
collector and allows network traffic reduction.
• LU: it is not a proper packet of the standard Link
State operation. It is a message that the drone
sends itself whenever there is a band update on
one of its links. To reduce traffic, these messages
are grouped in a single LSU message that will
be manage every 30 seconds. The drone keeps
track of the status changes of its links and at the
end it will update its LSA Database and generate
an LSA packet that will contain its own table of
neighbor nodes with updated bandwidth capabili-
ties.
All these packets inherit from the general class
”LinkStatePacket”, which contains the standard infor-
mation of each packet and it will be characterized by:
• the ID of the node that generates them;
• a sequence number that will be increased for each
generation;
• a numeric value to represent the Time To Live
(TTL) of the packet.
In the simulation process, each created drone will
have two tables that will continue to update during
the simulation: 1) LSA Table: it keeps track of neigh-
boring nodes. This table will be the one that is sent
from time to time for topological changes. In fact,
if the drone realizes that some neighboring node is
no longer connected, or notices a change in the sta-
tus of the links, then it will put the related changes
in this table and forward it to the neighboring nodes
via an LSA message. 2) LSA DB: it keeps track of
SIMULTECH 2019 - 9th International Conference on Simulation and Modeling Methodologies, Technologies and Applications
378

all the information on the network and will be cre-
ated and modified each time an LSA from the other
nodes on the network is received. When the simulator
starts, each drone must send a Hello message to the
nearby drones. The neighboring drones are all those
drones that are within a certain range of coverage, set
to 300 meters. The neighboring drones will respond
and, upon receiving the ACK, the drone that made the
Hello request will create a new line within own LSA
DB and own LSA Table.
Once all the ACK have been received, the drones
generate a LSA packet which will be forwarded to all
the neighboring nodes, which process the data in the
table contained in the packet and update their LSA
Database. They will then forward the received LSA
packet to all the neighbors, except to the node from
which they received it. Obviously, in this way, it will
be possible to obtain equal LSAs from several drones
and, in fact, a check on the sequence number of the re-
ceived LSA packet is always performed. Each drone
stores a list consisting of couple of values that will in-
dicate: the ID of the nodes from which an LSA was
received; the highest sequence number relative to the
LSAs received from that specific node. If an LSA
is received with a sequence number lower than that
stored in the list then it will be discarded and it will
not managed. The LSA packets will then be sent in
flooding in the network whenever there is a topologi-
cal change, as can be the connection/disconnection of
a new node and in the simulator this happens when-
ever a Client connects or disconnects from the net-
work.
3.2 Human Mobility: Mobility Model in
Urban Space
There are a lot of studies on this subject and several
interesting models for our case, including a study by
the University of Milan (Jahromi, 2017). They ana-
lyzed data sets on smartphone call information in Mi-
lan for 67 days, detecting over 69 million phone calls
and over 20 million text messages. Later, they also
analyzed the WiFi datasets and GPS data with which
they found the movement of 178 people within 4 years
(between 2007 and 2011).
After the analysis of the data, they have obtained
a model of people mobility based on the classifica-
tion in 3 categories of Points of Interest (PoI) that are
visited daily:
• Mostly Visited PoI (MVP): the places most visited
by a user that may be their workplace, or their
home.
• Occasionally Visited PoI (OVP): the places of in-
terest of a user, but occasionally visited. Often it
corresponds to favorite places or meeting points
visited during the week.
• Exceptionally Visited PoI (EVP): points of interest
rarely visited.
On this type of model we developed our idea of
mobility which includes 3 types of users:
• Worker: who represents the classic type of person
who spends most of the day at work. The students
can fit into this category.
• Housewife: who represents the type of person
who spends most of the time, especially in the
morning, at home.
• Pensioner: who represents the type of person who
is free to move.
Each type of user will spend the time in the day in
a different way and will visit most likely the points of
major interest, also based on time slots, so we tried to
represent this mobility in the simulator by considering
the following models.
3.3 Footprint Model
For that concerns air to ground channel model in the
considered urban scenario, the ground receiver can
receive two main signals: one is the Line of Sight
(LoS) signal and the other one is the Non-Line of
Sight (NLos) signal (Al-Hourani et al., 2014). These
two typologies of signal can be considered as sepa-
rately conditions and, then, they are studied consider-
ing different probabilities of occurrence. These two
propagation conditions can be considered separately
assuming they have different probabilities of occur-
rence. Typical, as discussed in (Feng et al., 2006), it
can be assumed that the signal received by the desti-
nation can be considered only in one of the two pre-
vious typologies. Each typology has a specific prob-
ability of occurrence which is a function of environ-
ment, density and height of buildings and elevation
angle. The probability of receiving LoS and strong
NLoS components are significantly higher than fad-
ing (Feng et al., 2006). Therefore, the impact of small
scale fading can be neglected. A common approach
to model air to ground propagation channel is to con-
sider LoS and NLoS components along with their oc-
currence probabilities separately. Note that for NLoS
connections due to the shadowing effect and reflection
of signals from obstacles, Path Loss (PL) is higher
than LoS. Hence, in addition to the free space prop-
agation loss, different excessive path loss values are
assigned to LoS and NLoS links. As it is possible
to view in figure 2 a coverage area is represented in
which h is the height of the drone and r is the radius of
A Simulator for Drones and FANET Management Supporting Multimedia Traffic under Human Mobility
379
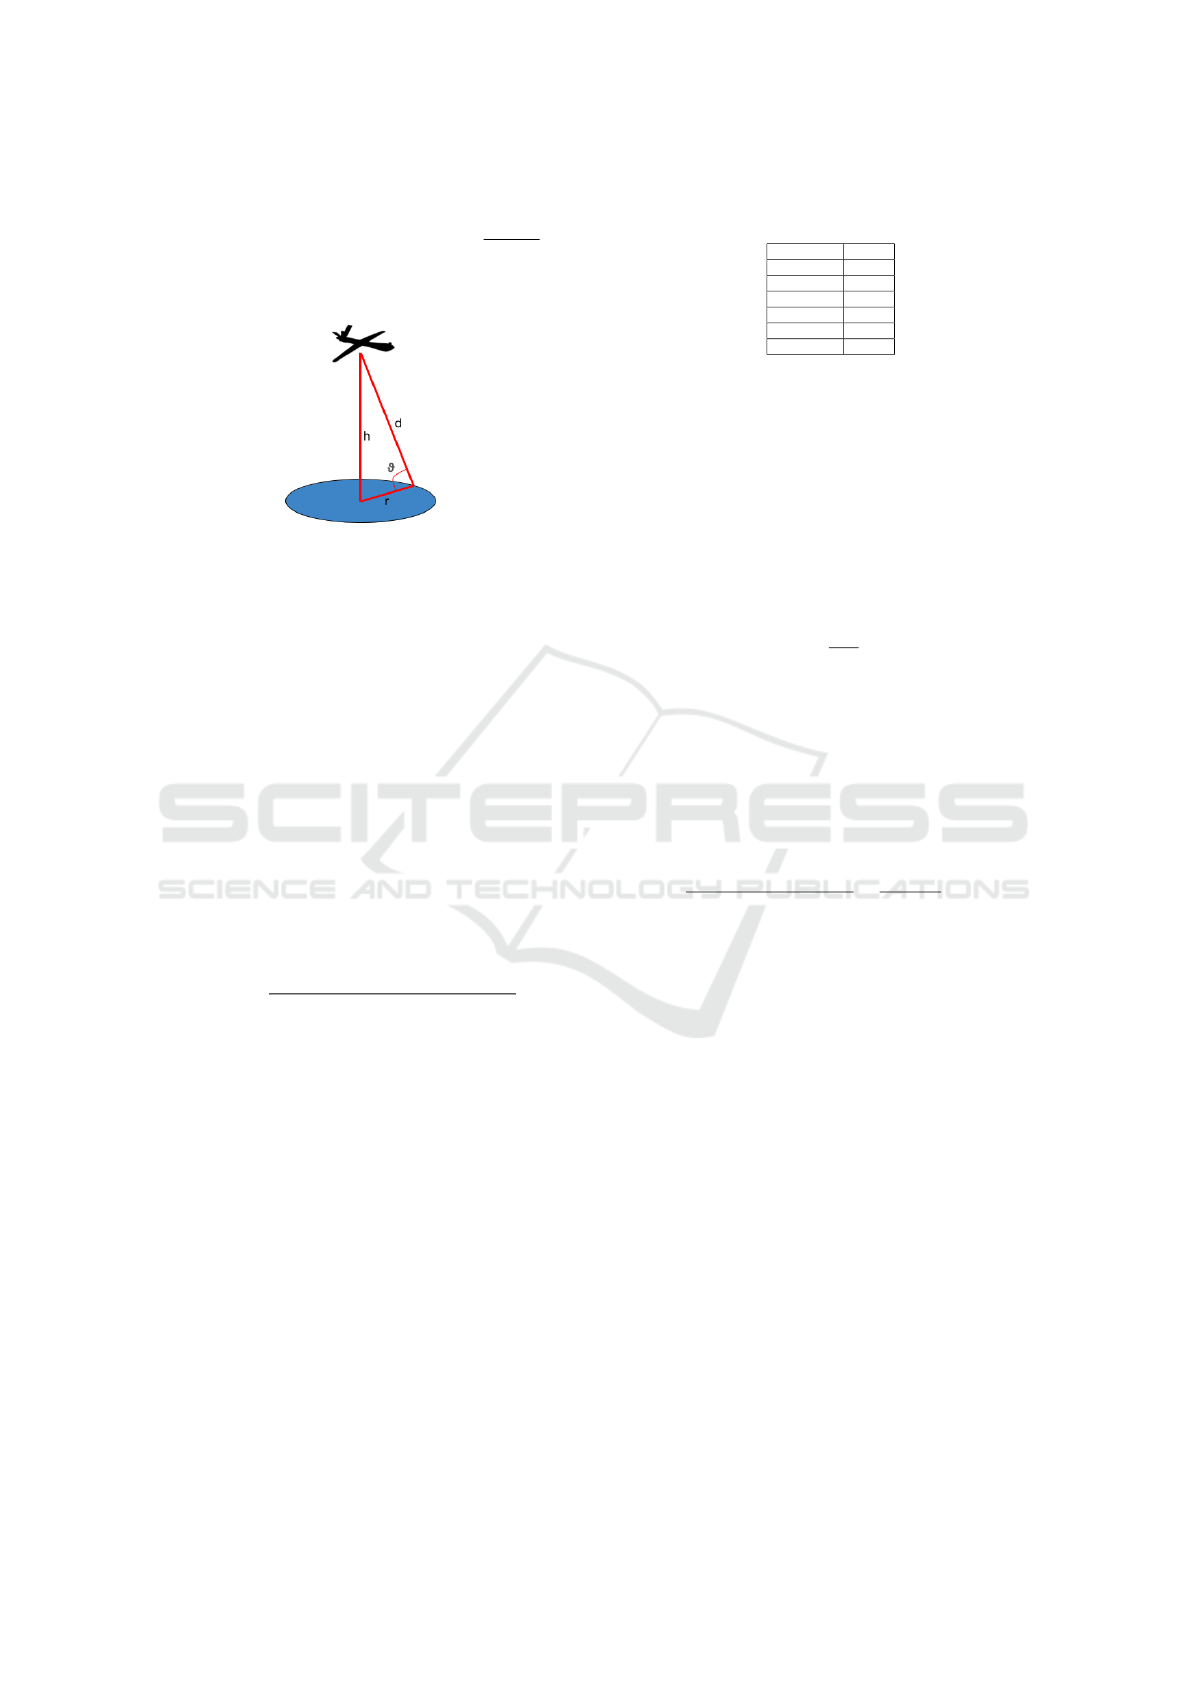
the coverage, d is the distance between an user on the
edge of the coverage area and the drones in the sky. d
is given by the following formula: d =
√
r
2
+ h
2
, in-
stead the angle θ, in radiant, between r and d is given
by: θ = tan
−1
(h/r).
Figure 2: UAV Footprint.
On the basis of this consideration, in the following
the formulas respectively of PL for the LoS and NLoS
conditions as in (Al-Hourani et al., 2014):
PL
LoS
(dB) = 20log(4 f
c
d/c) + ξ
LoS
(1)
PL
NLoS
(dB) = 20log(4 f
c
d/c) + ξ
NLoS
(2)
where PL
LoS
and PL
NLoS
are the average (PL) for
LoS and NLoS links, ξ
LoS
and ξ
NLoS
are the aver-
age additional loss to the free space propagation loss
which depend on the environment, c represents the
speed of light, f
c
the carrier frequency. The probabil-
ity P
r
of having LoS connections at an elevation angle
of θ is given by (Zheng et al., 2013)
P
r
(LoS) =
1
1 + α·exp(−β[(180/π)θ −α)]
(3)
where α and β are constant values which depend
on the environment (rural, urban, dense urban, etc.).
The NLoS probability is P
r
(NLoS) = 1 −P
r
(LoS).
The formula represented in equation 3 indicates that
the probability of having LoS connection between the
drone in the sky as Access Point (AP) and the users in
the coverage area is an increasing function of θ. This
means that by increasing the elevation angle θ, the
shadowing effect decreases and clear LoS path exists
with high probability. Finally, the average PL as a
function of the altitude h and coverage radius r be-
comes:
¯
PL(r,h) = P
r
(LoS) ·PL
LoS
+ P
r
(NLoS) ·PL
NLoS
. (4)
On the base of the previous drone channel model
we want to provide a formula for computing the opti-
mal altitude h for the maximum ground coverage area
Table 1: Considered parameters in mathematical formula-
tion.
Parameter Value
f
c
2 GHz
ξ
LoS
1 dB
ξ
NLoS
20 dB
α 9.6
β 0.28
γ
th
10dB
of radius r. Consider a drone in the sky able to trans-
mit a signal of power P
tran
, then the received power
P
rec
can be represented by the following formula:
P
rec
(dB) = P
tran
−PL(r, h). (5)
Once the received power P
rec
is calculated, an user
in the coverage area of the drone at an height of h is
able to receive the signal if its Signal to Noise Ra-
tio (SNR) is greater than a fixed threshold (γ
th
). This
means that:
γ(r,h) =
P
rec
N
> γ
th
(6)
where N is the noise power. From the previous
formula, it is possible to assert that to find the max-
imum achievable coverage radius we should have:
γ(r,h) = γ
th
. For a fixed transmit power, the optimal
drone height which results in maximum coverage is
computed by solving the following equation as it is
possible to view in (Feng et al., 2006):
180(ξ
NLoS
−ξ
LoS
)βZ
π(Z + 1)
2
−
20µ
log(10)
= 0 (7)
where Z = α · exp([(180/π)tan
−1
(µ) − α]) and
µ = h/r. By solving equation 7, µ
opt
= h
opt
/r
max
is computed and using equation 5, h
opt
and r
max
are
found.
4 SIMULATION ENVIRONMENT
In order to allow the movement of people, an urban
scenario was created taking as an example the google
map of the center of the city of Cosenza, in the south-
ern of Italy. Some Points of Interest (PoI) have been
chosen, such as shops, restaurants, hotels, churches,
etc. and then people’s homes: a grid of 144 houses
was chosen to cover most of the map. Subsequently,
the people movement has been realized. Each person
will start its day at 00:00 and will stay at home until 8
am. Later, based on the proposed model, people will
move throughout the day. In the simulator it is possi-
ble to set, in addition to the number of people, the
percentage of workers, housewives and pensioners.
The movements of the people are determined by the
SIMULTECH 2019 - 9th International Conference on Simulation and Modeling Methodologies, Technologies and Applications
380
”start()” method, which based on the time slots and
the various probabilities determines the next action
of the person and, in particular, the next destination.
Once the next destination is determined, each person
will try to reach it by following a path. The proposed
algorithm for finding the best route consists in search-
ing each time for a next PoI that can be reached within
a radius of 90 meters and that represents the PoI closer
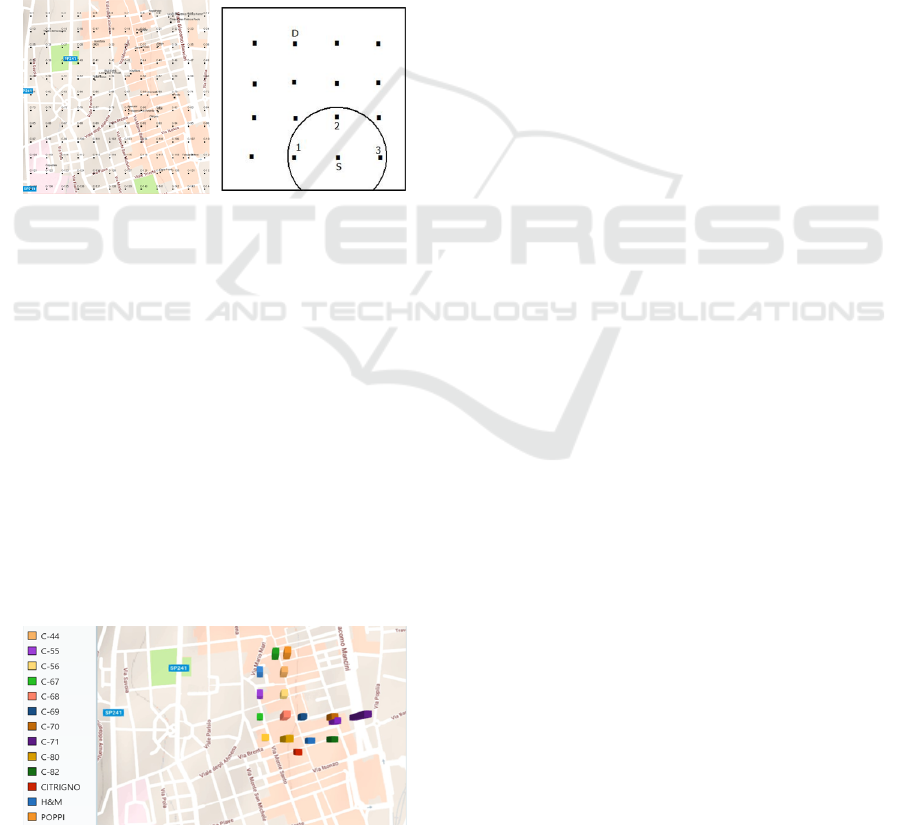
to the destination. To better understand the reasoning,
it is possible to take the following figure, figure 3, as
an example: a person moves from point S to point D.
Within his range of action (where there are points 1,
2 and 3, as it is possible to view in figure) the point
2 satisfies the conditions of the algorithm, that is, it
represents the point reachable from S within a radius
of 90 meters and closer to the destination.
Figure 3: Example of search for the next PoI to reach the
destination.
A grid arrangement was then chosen, therefore, to
avoid the problem of not finding another PoI within
the radius of action that would allow the movement.
A person performs his movements towards the chosen
destination, moving at a speed of 3 km/h. There is a
procedure that is the heart of the whole movement as
it recursively, if after a movement the destination has
not been reached, recalculates the next PoI generating
again the events for the movement. Usually, a per-
son who is not working or not at home can stay in
a PoI with a time varying between 10 and 60 minutes
each time. All activities end at 22:00, the limit beyond
which the day of the people is considered concluded.
People will return home and this determines the end
of the simulation.
Figure 4: View of the PoI visited by a person during a day.
5 SIMULATOR
IMPLEMENTATION
We have implemented a simulator in order to analyze
various aspects of the FANET. In particular, the goal
is to control how the network behaves during a day us-
ing a Link State Standard approach in which network
drones will send an LSA to neighboring nodes when-
ever a topological change occurs. We have considered
as simulation area a portion of the city of Cosenza (in
the southern of Italy). In particular, we have consid-
ered the surrounding area of ”Corso Mazzini” (one of
the most important street of the city) where the peo-
ple who move in this area are able to make audio or
video calls. In our work we have considered three dif-
ferent video and audio calls distributions as shown in
the following:
• 30% of audio streams and 70% of video streams;
• 50% of audio streams and 50% of video streams;
• 70% of audio streams and 30% of video streams.
Simulations were carried out considering the num-
ber of users in the area of interest in increasing. In
addition to the variable parameters, different fixed pa-
rameters have been set for the simulations: we have
set the drones without problems of autonomy; each
drone will have available 10 Mbps of bandwidth ded-
icated to the call admission of users within its range
of coverage; the range of coverage has been set with
a radius of 175m and the optimal height of the drone
has been obtained equal to about 120 meters from the
ground (Hayajneh et al., 2016; Mozaffari et al., 2015);
all drones are equipped with a buffer that stores video
and audio packets before forwarding them to the net-
work. The size of this buffer has been fixed to a
maximum of 50 packets; the communication range
between the drones has been set to 300 meters; the
movement speed of people has been set at 3 Km/h;
a person can move from one PoI to another within
a radius of 90m; 166 PoIs were chosen: 144 houses
placed as checkerboard and 22 other PoIs including
shops, refreshment points and entertainment; each
person will be able to make a call each time it is in a
PoI. Considering the proposed mobility model, it can
therefore be noted that, with 70% of workers spend-
ing most of their time at work, the flow of calls in the
network will be quite limited; to have a more realistic
case we have chosen to have users divided as follows:
70% of workers; 20% of housewives; 10% of pen-
sioners. For all the simulations, a network topology
consisting of 9 drones, distant 252 meter each other,
in rows of 3 has been considered, able to cover most
of the area of interest. The resultant network will be
so composed as shown in fig 1.
A Simulator for Drones and FANET Management Supporting Multimedia Traffic under Human Mobility
381
6 SIMULATION RESULTS
A series of simulations have been started with a grow-
ing number of people. The network was analyzed
from a minimum of 50 people to a maximum of 150.
For each simulation the considered parameters have
been:
• jitter of audio and video streams;
• delay of audio and video streams;
• number of packets sent, received and lost;
• bandwidth requests accepted and refused;
• number of calls made;
• percentage of bandwidth occupied for each drone
for that concerns the admission of calls.
The simulation results show the trend of some pa-
rameters such as sent and received packets, accepted
and refused requests of bandwidth, delay of the two
typologies of streaming. These parameters allow to
evaluate the goodness of the proposed simulator in
which we have varied some ingress parameters. In
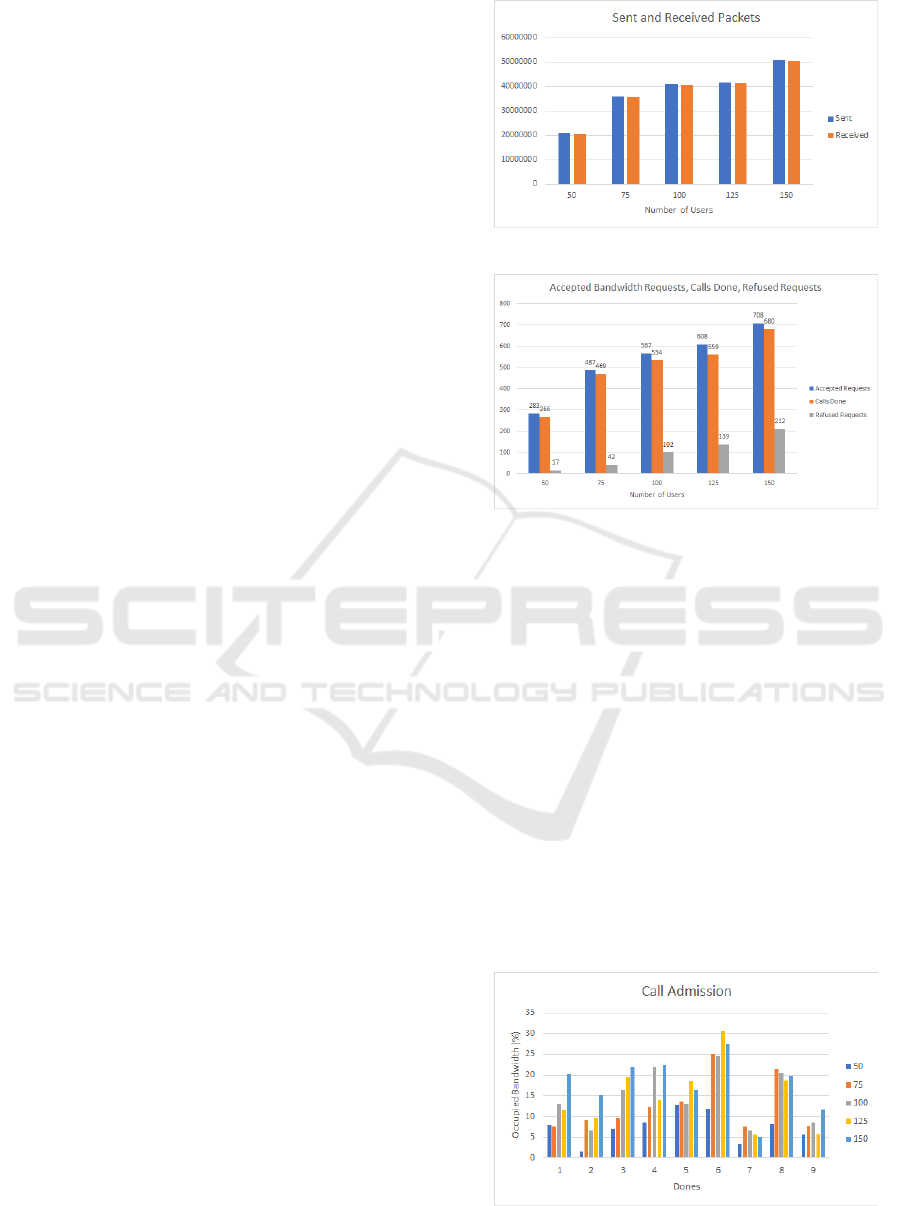
particular, in figures 5 it is possible to view the num-
ber of sent and received packets while the number
of accepted bandwidth requests, calls done and re-
fused requests are shown in figure 6. The figure 5
shows how the number of packets increases varying
the number of people and how the number of lost
packets is very low. From the figure 6 it can be seen
how the number of bandwidth requests increases with
the number of people and how, therefore, the num-
ber of calls made and the number of bandwidth re-
quests refused will increase. In addition, in the figure
7, we see which drones have a greater demand load
and, therefore, a higher percentage of occupied band-
width. The drones 6 and 8 are those with the highest
occupancy rate, due to a greater concentration of PoIs
in the area covered by them. Furthermore, it can be
seen how the percentage of bandwidth increases for
an increasing number of people. In the figures 8 and
9 it is possible to view the delays in both multime-
dia considered traffics. Figure 8 shows the delay in
user communications that consider VoIP multimedia
traffic. Finally, figure 9 shows the delays, minimum,
medium and maximum for video traffic. The figures
show delays in line with the typical delay of these ty-
pologies of multimedia traffics.
7 CONCLUSIONS
In this paper we present the implementation of a
UAVs/drones simulator environment created in java
and useful for analyzing different aspects of the so
Figure 5: Sent and Received packets vs number of users.
Figure 6: Accepted bandwidth requestes, Calls done, re-
fused requestes vs number of users.
called FANET. The possibility of providing tempo-
rary communication network composed of these new
kinds of devices is a very important research topic of
these last years. This aspect is very important in many
cases, first of all in emergency situations when it is
important to guarantee efficient communications in
the considered area. In this paper we propose a simu-
lation environment for UAVs coverage. The proposed
simulator is created in order to provide a platform
able to permit of simulating different scenarios and
cases in which users need to communicate each other.
The performance evaluation of our proposed simula-
tor has been considered using multimedia traffic such
as video and audio streaming as typology of users’ ap-
plications. We have simulated a team of drones able
to cover a specif area where the considered footprint
Figure 7: Number of call admission vs drone for different
number of users.
SIMULTECH 2019 - 9th International Conference on Simulation and Modeling Methodologies, Technologies and Applications
382
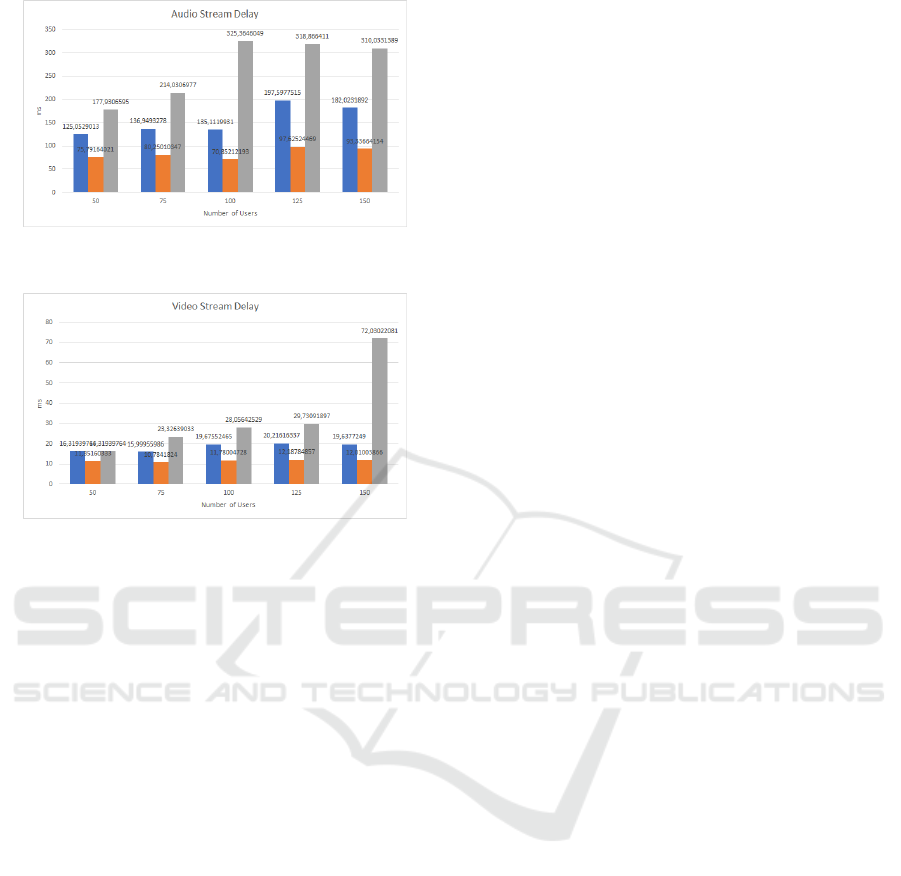
Figure 8: Audio stream delay (min, medium, max) vs num-
ber of users.
Figure 9: Video stream delay (min, medium, max) vs num-
ber of users.
and human mobility model have been taken in consid-
eration for carried out simulation results.
REFERENCES
Al-Hourani, A., Kandeepan, S., and Jamalipour, A. (2014).
Modeling air-to-ground path loss for low altitude plat-
forms in urban environments. In 2014 IEEE Global
Communications Conference, pages 2898–2904.
Bustamante, A., Guerrero, G., Rodrigues, N., and Pereira,
A. (2017). Uav simulator for grown-up people quality
of life enhancement. In 2017 12th Iberian Conference
on Information Systems and Technologies (CISTI),
pages 1–6. IEEE.
De Rango, F., Palmieri, N., Santamaria, A. F., and Potrino,
G. (2017a). A simulator for uavs management in agri-
culture domain. In 2017 International Symposium on
Performance Evaluation of Computer and Telecom-
munication Systems (SPECTS), pages 1–8. IEEE.
De Rango, F., Palmieri, N., Tropea, M., and Potrino, G.
(2017b). Uavs team and its application in agriculture:
A simulation environment. SIMULTECH, 2017:374–
379.
Fazio, P., De Rango, F., and Tropea, M. (2017). Pre-
diction and qos enhancement in new generation cel-
lular networks with mobile hosts: A survey on dif-
ferent protocols and conventional/unconventional ap-
proaches. IEEE Communications Surveys & Tutorials,
19(3):1822–1841.
Fazio, P., Tropea, M., De Rango, F., and Voznak, M. (2016).
Pattern prediction and passive bandwidth manage-
ment for hand-over optimization in qos cellular net-
works with vehicular mobility. IEEE Transactions on
Mobile Computing, 15(11):2809–2824.
Fazio, P., Tropea, M., Veltri, F., and Marano, S. (2012). A
novel rate adaptation scheme for dynamic bandwidth
management in wireless networks. In 2012 IEEE
75th Vehicular Technology Conference (VTC Spring),
pages 1–5.
Feng, Q., McGeehan, J., Tameh, E. K., and Nix, A. R.
(2006). Path loss models for air-to-ground radio chan-
nels in urban environments. In 2006 IEEE 63rd Vehic-
ular Technology Conference, pages 2901–2905.
Hayajneh, A. M., Zaidi, S. A. R., McLernon, D. C., and
Ghogho, M. (2016). Optimal dimensioning and per-
formance analysis of drone-based wireless communi-
cations. In 2016 IEEE Globecom Workshops (GC Wk-
shps), pages 1–6. IEEE.
Jahromi, K. K. (2016/2017). Human mobility in urban
space. Doctoral Dissertation, Universitas Studiorum
Mediolanensis.
Lombardo, C., Miller, I., and Wallace, J. (2016). Studying
the interaction of uas and human pilots using the x-
plane flight simulator. In 2016 International Confer-
ence on Unmanned Aircraft Systems (ICUAS), pages
557–561. IEEE.
Mozaffari, M., Saad, W., Bennis, M., and Debbah, M.
(2015). Drone small cells in the clouds: Design, de-
ployment and performance analysis. In 2015 IEEE
Global Communications Conference (GLOBECOM),
pages 1–6. IEEE.
Park, K., Cho, B., Park, K., and Kim, H. (2015). Opti-
mal coverage control for net-drone handover. In 2015
Seventh International Conference on Ubiquitous and
Future Networks, pages 97–99.
Sae, J., Yunas, S. F., and Lempiainen, J. (2016). Cover-
age aspects of temporary lap network. In 2016 12th
Annual Conference on Wireless On-demand Network
Systems and Services (WONS), pages 1–4.
Xie, J., Dong, C., Li, A., Wang, H., and Wang, W. (2017).
Optimal deployment density for maximum coverage
of drone small cells. In 2017 IEEE 86th Vehicular
Technology Conference (VTC-Fall), pages 1–6.
Zema, N. R., Trotta, A., Sanahuja, G., Natalizio, E.,
Di Felice, M., and Bononi, L. (2017). Cuscus:
Communications-control distributed simulator. In
2017 14th IEEE Annual Consumer Communications
& Networking Conference (CCNC), pages 601–602.
Zheng, Y., Wang, Y., and Meng, F. (2013). Modeling
and simulation of pathloss and fading for air-ground
link of haps within a network simulator. In 2013 In-
ternational Conference on Cyber-Enabled Distributed
Computing and Knowledge Discovery, pages 421–
426.
A Simulator for Drones and FANET Management Supporting Multimedia Traffic under Human Mobility
383
