
Case Study on Model-based Application of Machine Learning using
Small CAD Databases for Cost Estimation
Stefan B
¨
orzel
1
and J
¨
org Frochte
2
1
Breuckmann GmbH & Co. KG, Dieselstraße 26-28, 42579 Heiligenhaus, Germany
2
Dept. of Electrical Engineering & Computer Science, Bochum University of Applied Sciences,
Kettwiger Straße 20, 42579 Heiligenhaus, Germany
Keywords:
Cost Estimation, Small Databases, Model-based Approach, Feature Generation from CAD Data.
Abstract:
In many industries, the development is aimed towards Industry 4.0, which is accompanied by a movement
from large to small quantities of individually adapted products in a multitude of variants. In this scenario, it is
essential to be able to provide the price for these small batches fast and without additional costs to the customer.
This is a big challenge in technical applications in which this price calculation is in general performed by local
experts. From the age of expert systems, one knows how hard it is to achieve a formalised model-based on
expert knowledge. So it makes sense to use today’s machine learning techniques. Unfortunately, the small
batches combined with typically small and midsize production enterprises (SMEs) lead to smaller databases
to rely on. This comes along with data which is often based on 3D data or other sources that lead in the
first step to a lot of features. In this paper, we present an approach for such use cases that combines the
advantages of model-based approaches with modern machine learning techniques, as well as a discussion on
feature generation from CAD data and reduction to a low-dimensional representation of the customer requests.
1 INTRODUCTION
In many industries, the development is aimed towards
Industry 4.0, which is accompanied by a movement
from large to small batches of individually adapted
products in a multitude of variants. This is made
possible on the one hand by production machines
equipped with more processors, sensors and radio
links, which allow the machines to achieve a model
of their environment and to communicate with each
other to be more flexible. On the other hand, this
technology alone cannot support the development of
Industry 4.0 - it needs intelligent components for pro-
cess control as a further development of the static
process that often still exists today. This is widely
discussed in different papers like e. g. (Li and Nigge-
mann, 2018), (Kuschicke et al., 2017) or (Windmann
and Niggemann, 2015).
However, the demand for machine learning tech-
niques often starts much earlier than in the produc-
tion itself. A customer first asks for a price for these
small batches. This is a big challenge for small and
medium-sized companies. The question can often be
answered only by few experts in the organisation and
the customers are often not willing to pay for the ini-
tial price estimation. Also, the greater flexibility on
the customer side in Industry 4.0 leads to more vari-
ants being requested because they change their pro-
cesses more quickly as well. Hence it is reasonable
to increase the degree of automation of the price esti-
mation with machine learning techniques. One issue
is the accuracy of the offered price because too cheap
offers lead to loss of profits and too expensive offers
may lead to the loss of customers. The main challenge
for this is the provided amount of data in typical ap-
plication scenarios. In small and medium-sized com-
panies, which produce small batches, comparatively
fewer data is generated per product variant. There-
fore techniques which require huge amounts of data
like deep neural networks are in general not feasible
here. The data situation demands feature engineering
with the goal to come to general features which can
be applied to a broad spectrum of products.
In many application areas, Computer-Aided-
Design (CAD) data, which contain three-dimensional
representations of parts, together with simulation re-
sults are the starting point for a product variant. Cus-
tomers submit CAD data which is essential to calcu-
late the price. For machine learning, this means we
somehow will have to measure the difference between
258
Börzel, S. and Frochte, J.
Case Study on Model-based Application of Machine Learning using Small CAD Databases for Cost Estimation.
DOI: 10.5220/0007979802580265
In Proceedings of the 11th International Joint Conference on Knowledge Discovery, Knowledge Engineering and Knowledge Management (IC3K 2019), pages 258-265
ISBN: 978-989-758-382-7
Copyright
c
2019 by SCITEPRESS – Science and Technology Publications, Lda. All rights reserved

the CAD data of a new request and existing product
variants in our database. This case study will concen-
trate on CAD data describing forms.
1.1 Related Work
Moulds are indispensable for the repeatable and cost-
effective mass production of various parts or products
in today’s world. This economical production is of-
fered by many foundries worldwide. Due to this wide
range of different foundries, inquiries from compa-
nies are usually sent to several foundries. This sit-
uation causes foundries a lot of work in processing
inquiries and estimating costs for making the neces-
sary moulds and producing the castings. On this oc-
casion, several authors have investigated the question
of cost estimation of moulds in the last two decades.
The publication (Wang et al., 2003) describes a way
for their use in injection moulding to present inquiries
with the customer, part and mould information that
can be stored in a database. Their approach is mainly
a case based principle, which is extended by a neu-
ral network to measure similarity and speed up the
search for similar cases in the database. (Mukher-
jee et al., 2005) list an integrated solution for cal-
culating mould costs. A weighted sum of various
mould costs is calculated and evaluated with the ac-
tual costs. (Chougule and Ravi, 2006) present a para-
metric model for calculating tool costs for casting
steel and grey cast iron. The parameters of the cast-
ing are determined from the volume body. This work
is not using machine learning as such but the pre-
sented analytical model is related to our model-based
approach. The analytical model – mainly a formula –
consists of some parameters which are available from
the request and some which need to be estimated.
The estimation is performed here by expert knowl-
edge and/or simulation. It is an example of existing
models in this application field with free parameters.
In our work, we will use machine learning to pro-
vide an estimation for these parameters. In the work
(Denkena et al., 2009) inquiry processes of 10 enter-
prises were examined. The explosive nature of the
topic is discussed and a model for rule-based deci-
sion support is presented, which is based on geomet-
ric information of the casting. This leads to a faster
and more accurate calculation possibility. To estimate
the similarity between different CAD entries in our
database our approach is related to (Burrows et al.,
2011) when it comes to defining a metric for CAD
data. In (Burrows et al., 2011) this metric is used to
determine the difference between bridge designs. The
used machine learning technique is unsupervised with
the goal to judge if a design is feasible or not. We pro-
vide approaches for a supervised regression technique
and production application in opposite to bridge con-
struction problems.
1.2 Contribution and Structure
In this work, we . . .
• . . . provide a general process framework for re-
gression problems based on CAD data in scenar-
ios with small data sets.
• . . . perform a case study using this framework for
cost estimation of forms. This case study consists
of
– how features can be generated from CAD data
by computation,
– a feature selection and compression and
– the design and choice of a feasible metric and
regression technique.
Furthermore we emphasis in this work the fact that it
is not necessary to perform a price prediction solely
using Machine Learning. We denote such an ap-
proach – a regression technique to predict the price
based on given features – “model-free” in this work
to distinguish it from our approach, even if in other
circumstances one would like to argue that the trained
neural network or similar eager learner is a model
itself. For transparency issues and to deal with the
given limits concerning the database it makes sense
to just apply the regression technique to some com-
plex estimate factors in a formula – the model – for a
cost estimation instead.
As we will show the estimation of a single or a
few parameters is often a feasible approach. The in-
fluence of the accuracy of the predicted parameters is
also shown by an error propagation of the manufac-
turing costs in this work.
The rest of this paper is organised as follows.
First, Section 2 contains the presentation of the sug-
gested framework. In Section 3 the application case
from High-Pressure-Die-Casting (HPDC) manufac-
turing, including the aspect of manufacturing costs,
is briefly outlined. The next section describes the
feature engineering from CAD data and the assem-
bling of databases. This includes the reduction of
the feature space in order to address small databases.
With this work done we apply in Section 5 different
machine learning approaches and present the results.
Section 6 draws a conclusion.
Case Study on Model-based Application of Machine Learning using Small CAD Databases for Cost Estimation
259
estimated
price
f(x,intuitivefactors)
(once derived by experts)
intuitivefactor
generalized
feature
regression
technique
CAD data
feature
generation
feature
generation
CAD data base
generalized feature
data base
price
request
1.
2.
3.
5.4. 6.
9. 8. 7.
customer
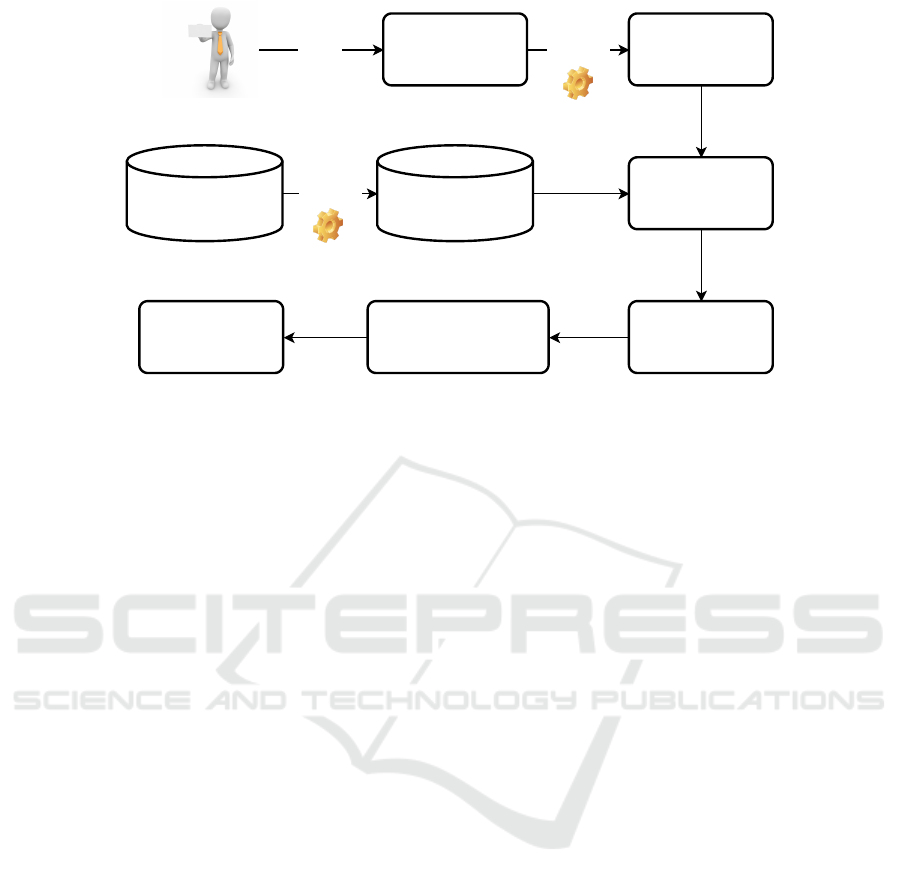
Figure 1: Process overview.
2 A PROCESS FRAMEWORK
FOR MODEL-BASED PRICE
ESTIMATION BASED ON
SMALL CAD DATABASES
Figure 1 illustrates the suggested process. We first
start with the existing method of price estimation,
which we would like to automate. Now we locate
the parts of this process that need expertise and the
ones that can be derived easily from the request of the
customer. The result is a price model
price = f (x,intuitive factors), (1)
which depends on a vector variable x with known or
easily derivable parameters from the request and on
one or more intuitive factors. With this term, we de-
scribe all aspects of the formula or model that are hard
to formalise or describe in a formal model. In prac-
tice, this means every factor the expert cannot teach
easily non-experts how to estimate. This model rep-
resents step 8 in Figure 1. Once we derived it, it is of
course fixed and only depends on its variables. The
use of such a model brings up the need to estimate
the influence of the intuitive factors we now wish to
compute using a machine learning approach. The rea-
son is, that in general error boundaries between the
predicted and the real price are required, but not for
the factors in the formula. Sometimes this can be
formed by an analytic error analysis and sometimes
it needs some sensitivity analysis, see e. g. (Saltelli
et al., 2008). In this paper, we assume that these intu-
itive factors can be computed based on the informa-
tion provided by CAD data, which comes along with
the request (steps 1 & 2 in Figure 1). Our database
contains products produced in the past together with
their production costs. To compute the distance be-
tween two requests we need to develop a feature gen-
eration process taking us from step 2 to 3 and from
step 4 to 5 in Figure 1. The goal of this feature en-
gineering is a low dimensional space which is able to
capture all the necessary aspects from the data with-
out relying on a special variant of the product. So
the features itself must provide some generalisation.
Using these features we can use a common machine
learning technique for regression in step 6 and pre-
dict values for the intuitive factors. Together with
our model, we can now estimate the price for the re-
quested product.
3 MAIN INFLUENCE OF
MANUFACTURING COSTS
To work out an appropriate offer for a die-cast part,
it is essential to know the design of the mould in
order to produce the it, as this has an influence on
the production of the mould and the later production
process of the cast part. When using standardised
moulds with fixed sizes, the most important quantity
to be determined for each standard is the number of
economically reasonable mould nests n. It describes
how many parts can be produced with one mould at
the same time and is the quantity we want to pre-
dict using machine learning techniques as mentioned
in Section 1. Since parts can only be produced as a
whole with moulds, n is an integer and is different for
each mould standard because of their different dimen-
sions. For reasons of symmetry, this value is in most
KDIR 2019 - 11th International Conference on Knowledge Discovery and Information Retrieval
260
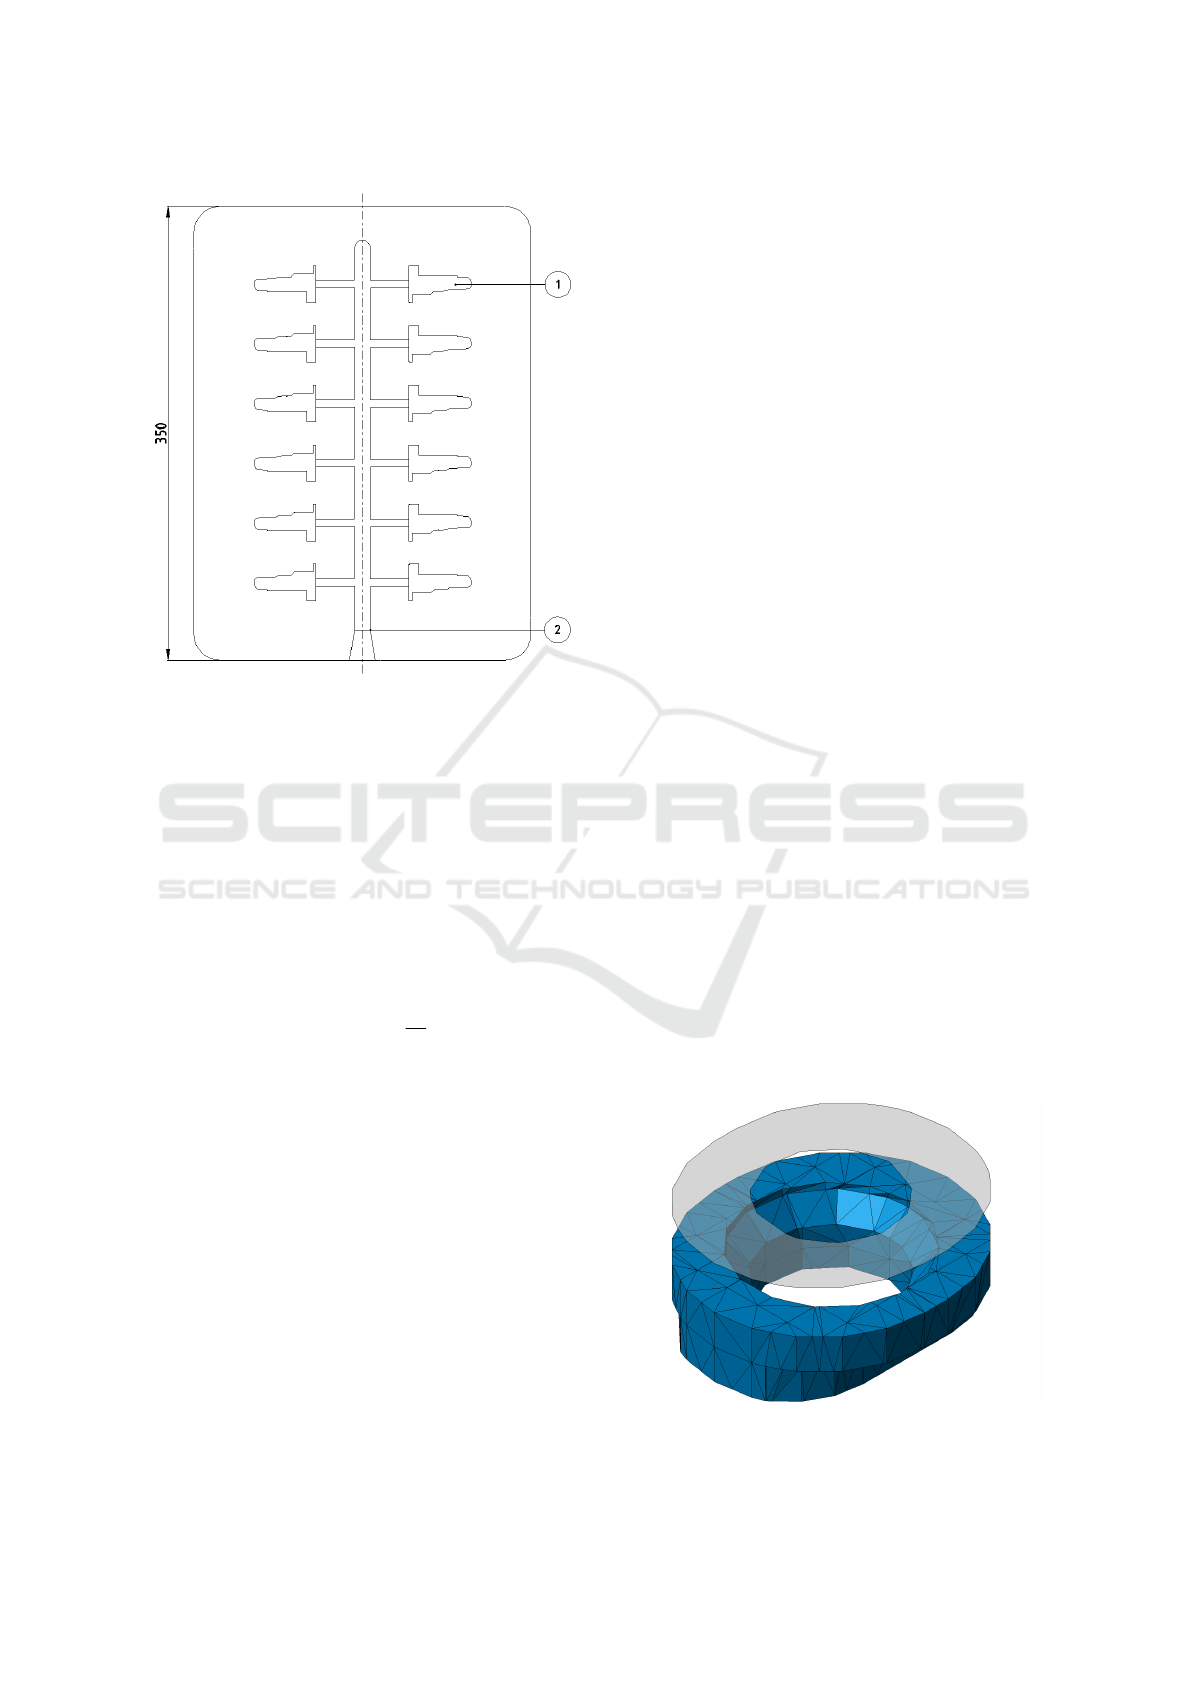
Figure 2: Concept sketch of a mould half of the company
Breuckmann internal mould standard E350 with a simpli-
fied cast tree (2) and 12 mould nests (1).
cases even-numbered. An example for the company
Breuckmann internal mould standard E350 (which is
a coding for its main dimension of 350mm) and its
12 mould nests to produce silicon tombac parts, a
special brass alloy for technically demanding appli-
cations with a tensile strength of over 500 MPa (com-
pared to the often used aluminium alloy Al-226 with
240MPa), is shown in Figure 2. After the mould nests
number n is worked out, the simplified equation (2) is
used to calculate the manufacture costs MC in e/part.
MC = V c
M
+
c
G
n
(2)
The equation is part of the two-step cost price cal-
culation, a business instrument for determining offer
prices. In this formula, V is the volume of the cast-
ing part and n the number of mould nests. Costs that
affect the material, such as raw material costs, burn-
up surcharges and other material surcharges, are sum-
marised to the size c
M
in e/m
3
. Variable costs in-
curred by the die casting mould, the die casting ma-
chine, the casters and other process variables of the
foundry are summarised in e/piece with c
G
. Post-
processing steps such as deburring processes, drilling
and thread cutting processes or coating processes are
neglected for the sake of simplicity. To calculate
the gross sales price, administration and distribution
costs, special costs, profit surcharges, rebates, dis-
counts and taxes would then be included. Since the
goal is to predict the number of mould nests n for a
cost estimate, in opposite to let this parameter been
worked out exactly by a specialist in hours of work,
it is important to know which deviation of the costs
is generally accepted by the market. This acceptance
usually ranges between 10 % and 20 % deviation from
the cost estimate and can be improved by prior con-
sultation with the customer and transparent behaviour.
This specification should serve as a target range for
this work.
4 FEATURE ENGINEERING AND
DATABASE CREATION FROM
CAD DATA
In order to be able to calculate features from 3D data,
these are first meshed and saved in the Stereolithog-
raphy (STL) file format, which is a 3D representa-
tion of the object as a list of triangles. An example
is shown in Figure 3. With this representation, fea-
tures can be derived and calculated using scripts and
analytical equations. A feature to be mentioned, for
example, would be the volume V required to deter-
mine the material requirement for filling the mould
cavity. An efficient way to calculate the volume V
is shown in (Zhang and Chen, 2001). Another fea-
ture is the area projected in direction of demould-
ing S (as shown in Figure 3), against which the hy-
draulic casting pressure acts and attempts to open the
mould. The full list of features can be found in Ta-
ble 1. The database created for this work with a
total of 700 data sets consists of data from die casting
moulds with its id (identifying number), its acronym
for the mould standard, the number of its mould nests
n and the extracted features of the associated cast-
ings. The requests are from the period between early
2014 and late 2018 and were taken from the request-
archive for silicon tombac parts. Of the 700 data
Figure 3: Area projected in direction of demoulding calcu-
lated from meshed CAD part data.
Case Study on Model-based Application of Machine Learning using Small CAD Databases for Cost Estimation
261
Table 1: Extracted Features from CAD Data.
symbol description unit
O surface mm
2
V volume mm
3
M = V /O casting module mm
S area projected in direction
of demoulding
mm
2
a smallest side length of
smallest bounding box
orthogonal to direction of
demoulding
mm
b largest side length of small-
est bounding box orthog-
onal to direction of de-
moulding
mm
h height in direction of de-
moulding
mm
A
b
= a · b area of projected bounding
box
mm
2
V
b
= a · b · h volume of bounding box mm
3
η
A
= S/A
b
occupancy rate of area 1
η
V
= V /V
b
occupancy rate of volume 1
O
g
surface with influence on
demoulding
mm
2
q = O/O
g
demouldability quotient 1
sets, 526 can be assigned to the most common mould
standards: E350 with 240, P360 with 98 and V360
with 188 moulds. Overall, this accounts for about
75 % of all moulds offered. With the small number
of data set, the features must be selected and reduced
in order to fit the regression model as well as possi-
ble. To achieve this, the feature-importances of the
Random-Forest-Regression (RFR) and the Pearson-
Correlation-Coefficient (PCC) between the features
and the number of mould nests n are considered.
Since the E350 mould standard has the most data
records, as shown in Section 4, the procedures are
demonstrated using it. By using the RFR feature-
importances, the features are ranked as shown in Ta-
ble 2. The placement shows that by accumulating the
first six features about 95 % of the feature importance
is covered. The PCC shows that the features a and
b also seem to be relevant. When testing and training
the models, the first six features of the PCA were used
and some features were removed or exchanged for
testing purposes. It turned out that the mean-relative-
error (mre) could be decreased by about 0.5 % if fea-
ture S is exchanged for a. Based on the described con-
siderations, five features V,O,V
b
,A
b
,b are selected by
their feature-importance and a is chosen instead of
S because the results are more accurate. The result-
ing workflow, from the CAD data to the composed
features, is shown in Figure 4. Nevertheless, a six-
feature generation
CAD data
feature selection
all features
PCA
most relevant features
composed features
Figure 4: Generation, selection and reduction of features
from CAD data.
Table 2: Features ranked by RFR feature importances and
listed PCCs values.
rank symbol
RFR
importances
/ %
PCC
/ 1
1 A
b
76.6 -0.44
2 S 7 -0.46
3 O 4.4 -0.41
4 V
b
3.8 -0.33
5 b 2.2 -0.61
6 V 1.2 -0.38
7 O
g
1.1 -0.31
8 M 0.9 -0.48
9 η
A
0.8 0.16
10 a 0.7 -0.57
11 η
V
0.6 0.43
12 h 0.4 -0.33
13 q 0.3 0.16
dimensional characteristic space for the given amount
of data is still too large for this application due to the
low data density. This circumstance is also known as
the curse of dimensionality. There the next logical
step is to reduce the feature space keeping as much
information as possible. Two standard approaches
for this process step are using Principal-Component-
Analysis (PCA) assuming a linear model or using
an autoencoder with the option to capture non-linear
relations. Because of the small database, a simple
model is the first choice for a stable composed fea-
ture space. It turned out that with a PCA, the data set
can be reduced to three principal components with a
total variance of approximately 96 %, as shown in Ta-
ble 3. Due to this coverage, the features transformed
into this three dimensional space are used. To ex-
KDIR 2019 - 11th International Conference on Knowledge Discovery and Information Retrieval
262

plore some Details of the PCA its first three Principal-
Components (PC) are listed in Table 4 and discussed.
The first PC PC
1
is made up of equal parts of the se-
lected features. Only the feature b, which describes
the long side of the bounding box contributes a little
less to the first main component 0.33. The feature b
is strongly represented with −0.89 in the second PC
PC
2
and thus significantly determines its direction. In
the third main component PC
3
, the short side of the
bounding box a dominates with −0.69. In addition,
the casting volume V and its surface O are still repre-
sented with 0.5 and 0.41, respectively.
Table 3: PCA on the features A
b
,V
b
,O,V,a,b.
principal
component
explained
variance ratio
/ %
accumulated
/ %
1 79.92 79.92
2 9.88 89.80
3 6.15 95.95
4 2.89 98.84
5 0.88 99.72
6 0.28 100.00
Table 4: The first three PC of the PCA.
symbol PC
1
PC
2
PC
3
A
b
0.44 -0.07 -0.30
V
b
0.43 0.16 0.09
O 0.43 0.19 0.41
V 0.43 0.07 0.50
a 0.39 0.36 -0.69
b 0.33 -0.89 -0.11
5 REGRESSION MODELS AND
RESULTS
The trained regression models are evaluated with a
test set of 20 % of the data set. For validation, the
predicted number of mould nests ˆn of the test set is
compared with the actual number of mould nests n
according to (3) and noted as the mean relative devi-
ation of mould nests ¯n
rel
. Since the machine learning
techniques, due to the small number of data sets and
a few special cases, are forced to generalise as well as
possible, strong relative deviations occur in some sit-
uations. Here those deviations greater than 50 % (see
(4)) are defined as outliers. The outliers are sorted out
before the scoring.
¯n
rel
=
1
k
k
∑
i=1
n
i
− ˆn
i
n
i
(3)
n
rel
=
n − ˆn
n
≥ 50 % (4)
Each regression model is tested using the
Stratified-ShuffleSplit-Cross-Validator (SSSCV)
from sklearn (Pedregosa et al., 2011). This procedure
evaluates the regression models statistically, making
sure that each subset has an approximately equal
distribution that reduces the variance of the estimate.
Due to the small number of data sets, 100 splits are
performed to get a sense of the true value and its
uncertainty. For each of the 100 passes of the SSSCV,
the mean relative deviation ¯n
rel
is calculated and
the number of outliers o is counted according to the
criterion in (4). This count o is divided by the number
of test records k of each run and noted as the relative
number of outliers
o
rel
=
o
k
. (5)
According to the SSSCV, the 100 pairs of values con-
sisting of ¯n
rel
and o
rel
are used to calculate their mean
value µ and standard deviation σ respectively. The re-
sult of the SSSCV is then listed in Table 5 as µ ± 2σ.
The two standard deviations cover about 95 % of the
test runs and represents the uncertainty of the mean µ.
The regression models RFR, K-nearest-Neighbor-
Regression (KNR) and an ANN are trained and
scored, as described in the paragraph before, for each
mould standard separately. The Implementations of
the RFR and KNR were used from scikit-learn (Pe-
dregosa et al., 2011). All were manually tested and
tuned. In RFR, after 64 trees, there is no significant
change in accuracy and dispersion. The maximum
depth of the trees with eight nodes seems to give a
good generalisation. A change in the default settings
of the KNR does not seem to improve accuracy or
generalisation, so the number of neighbours remains
at five. For the fully connected ANN created with
Keras, two hidden layers with 16 neurons each and
an L2 regularization of 1/1000 proved to be suitable
for a good fit and generalisation of the data. For its
three input neurons for the composed features and its
hidden layer, the Rectified-Linear-Units (ReLU) acti-
vation function is used. For the regression purpose,
the activation function of its one output neuron was
set to linear. The results from the described training
and the used regression models, which are trained for
each mould standard detached, are shown in Table 5.
The results in Table 5 shows the relative number
of outliers o
rel
and the mean relative deviation of the
number of mould nests ¯n
rel
for each mould standard
and regression model. One can see that the RFR has
the lowest outlier rate, taking into account all three
mould standards. With the P360 mould standard,
the ANN has difficulties in estimating the number of
Case Study on Model-based Application of Machine Learning using Small CAD Databases for Cost Estimation
263
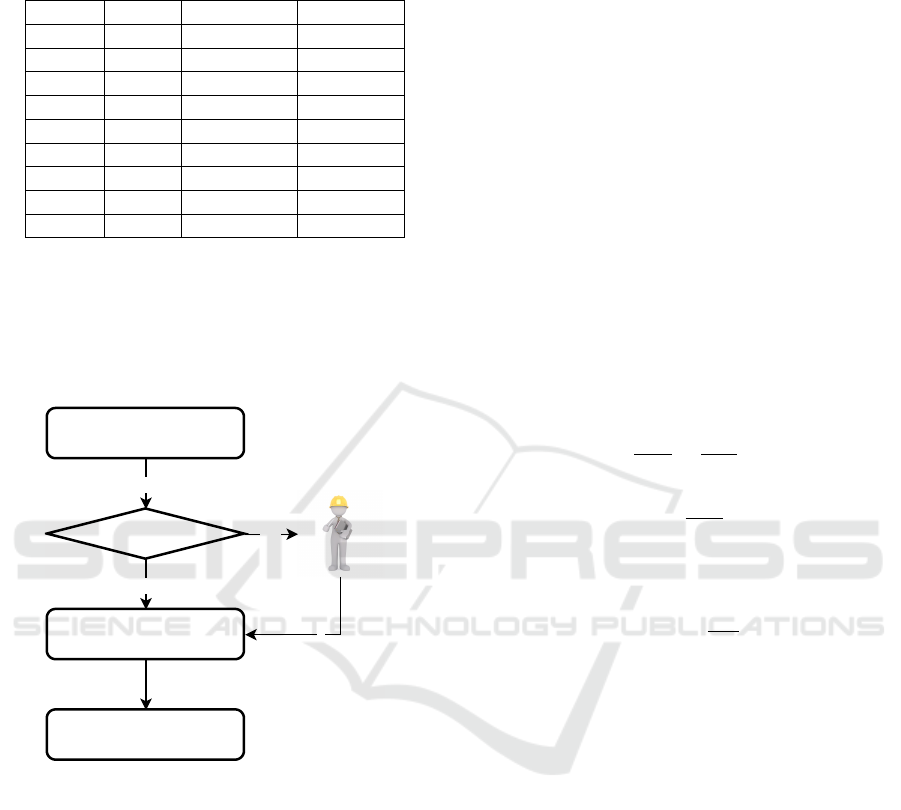
Table 5: Training results. Each mould standard has been
trained and tested with its own RFR, KNR and ANN. The
results for o
rel
and ¯n
rel
are noted as µ ± 2σ.
mould model o
rel
/ % ¯n
rel
/ %
E350 RFR 7.6 ± 6.6 15.7 ± 3.1
E350 KNR 9.1 ± 7.2 16.0 ± 3.2
E350 ANN 7.4 ± 6.4 15.7 ± 3.5
P360 RFR 12.2 ± 13.7 15.9 ± 6.1
P360 KNR 13.3 ± 13.6 15.8 ± 5.8
P360 ANN 12.7 ± 16.0 20.9 ± 4.9
V360 RFR 8.3 ± 7.5 16.1 ± 3.7
V360 KNR 9.2 ± 8.6 16.0 ± 3.5
V360 ANN 9.9 ± 9.7 17.8 ± 3.6
mould nests n due to the small number of data sets of
98 moulds, as listed in Section 4, with 20.9 % mean
relative deviation. For the mean relative deviation, the
KNR is close to the results of the RFR, but has more
relative outliers o
rel
. With this consideration, the RFR
wins with a slight advantage over the KNR and ANN.
n
regression method
no
outlier?
price model
estimated price
yes
n
expert
Figure 5: Process to deal with outliers.
To simplify the further discussion about outliers,
only the RFR results for the E350 mould standard are
considered. In the 100 runs of the SSSCV, 27 out
of the 240 parts for this mould standard have been
identified and counted as outliers. At this point, the
character of the SSSVC method should once again
be pointed out. Not every part appears equally often
in the test set during 100 runs. However, the counts
clearly show which parts are noticeable as outliers
and how they can be identified. 11 of these parts are
counted only one to five times. There are no special
characteristics to be proven for these parts. Here one
can assume outliers due to the character of the SSSCV
method and the small database. 13 parts have multiple
features that deviate about two to five times from the
mean value, e. g. the volume, the surface or its dimen-
sions. These parts stand out so clearly from typical
silicon tombac castings that they will also require an
individual consideration by an expert for the prepara-
tion of an offer in the future. The remaining three out-
lier parts can be justified due to atypical mould con-
struction work.
In order to check the influence of a misjudgment
of the number of mould nests on the manufacturing
costs, an error-propagation is carried out. To perform
the error propagation, the simplified equation (2),
which is explained in Section 3, is used to calculate
the manufacture costs MC. Furthermore, the param-
eters of interest must be derived partially. As this is
in our case only the number of mould nests n, this is
done according to (6). Since only one quantity is de-
rived, the uncertainty of the production costs u
MC
can
be calculated as presented in (7) and its relative un-
certainty u
MC,rel
as shown in (9). With (8) the mean
relative deviation of the mould nests number ¯n
rel
from
Table 5 is used to calculate the uncertainties of the
mould nest numbers u
n
.
∂MC
∂n
=
−c
G
n
2
(6)
u
MC
=
∂MC
∂n
u
n
(7)
u
n
= n · ¯n
rel
(8)
u
MC,rel
=
u
MC
MC
(9)
Based on the database described in Section 4 and
the mean relative deviations of the mould nest num-
ber ¯n
rel
of the results from the RFR given in Table 5,
the relative uncertainties of the manufacturing costs
u
MC,rel
were calculated for data sets of the respective
mould standards E350, P360 and V360. In Table 6,
these are given as the mean value µ and twice the
standard deviation σ of the respective mould standard.
The specification of the two standard deviations cover
about 95 % of the data sets and serve as an uncertainty
for the mean value. With a mean relative uncertainty
u
MC,rel
of about 10 % to 14 % of the manufacturing
costs, with the framework shown in this work, it is
possible to prepare quick target price quotations with
a high degree of automation which satisfies the accep-
tance of uncertainties of a cost estimate between 10 %
and 20 %, as explained in Section 3. If methods are
also used to support quotation creation, as shown in
(Wang et al., 2003), uncertainties can be further re-
duced. Additional post-processing steps also may re-
duce the relative uncertainties in unit costs. The pre-
sented procedure was implemented and was able to
reduce the average processing time . The process step
KDIR 2019 - 11th International Conference on Knowledge Discovery and Information Retrieval
264

Table 6: Mean relative Uncertainty of Manufacturing costs
u
MC,rel
noted as µ ± 2σ.
mould standard u
MC,rel
/ %
E350 10.4 ± 3.9
P360 14.0 ± 1.5
V360 13.0 ± 2.3
for determining the number of mould nests could on
average be reduced on average by a factor of 4.
6 CONCLUSIONS
To recap, the initial CAD data is too complex and our
database too small to be processed directly to a learn-
ing approach. These kind of databases are quite com-
mon for production processes in Industry 4.0 scenar-
ios, especially in SMEs. With our work, we introduce
a framework on how to deal with such use cases. The
starting point is to reduce the CAD data to a lower di-
mensional feature space using expert knowledge. De-
pending on the number of features that are suggested
by the expert, we process using feature selection and
reduction. To reduce the complexity of the regres-
sion task even further, we proposed the use of a price
model with just some missing factors. We were able
to show that using a random forest model about 500
data records are sufficient to develop a price predic-
tion which meets the requirements. Results that do
not meet the requirements are easy to spot as outliers.
These still require the expert to perform a price pre-
diction by hand. It is reasonable to assume that the
number of outliers will decrease over time the system
is used because the database will increase. Indeed,
the methodology comprises nine distinct steps, where
we have evaluated different approaches. One aspect
that comes along with the smaller data sets is that in
these application cases expert knowledge needs to be
combined with machine learning techniques in many
steps like the generation of the data or the building of
the model for the estimation. But unlike expert sys-
tems, the result is a self-learning method which is able
to improve itself without consuming additional time
from the experts. This illustrates that small databases
even with a high variety, which comes along with
small batches in Industry 4.0, is a challenge that can
be mastered using the presented framework.
REFERENCES
Burrows, S., Stein, B., Frochte, J., Wiesner, D., and M
¨
uller,
K. (2011). Simulation data mining for supporting
bridge design. In Proceedings of the Ninth Aus-
tralasian Data Mining Conference-Volume 121, pages
163–170. Australian Computer Society, Inc.
Chougule, R. and Ravi, B. (2006). Casting cost estimation
in an integrated product and process design environ-
ment. International Journal of Computer Integrated
Manufacturing, 19(7):676–688.
Denkena, B., Lorenzen, L.-E., and Sch
¨
urmeyer, J. (2009).
Rule-based quotation costing of pressure die casting
moulds. Production Engineering, 3(1):87–94.
Kuschicke, F., Thiele, T., Meisen, T., and Jeschke, S.
(2017). A data-based method for industrial big data
project prioritization. In Proc. of the Int. Confer-
ence on Big Data and Internet of Thing, BDIOT2017,
pages 6–10, New York, NY, USA. ACM.
Li, P. and Niggemann, O. (2018). A data provenance based
architecture to enhance the reliability of data analy-
sis for industry 4.0. In 2018 IEEE 23rd Int. Confer-
ence on Emerging Technologies and Factory Automa-
tion (ETFA), volume 1, pages 1375–1382. IEEE.
Mukherjee, N., Ravi, B., et al. (2005). An integrated frame-
work for die and mold cost estimation using design
features and tooling parameters. The international
journal of advanced manufacturing technology, 26(9-
10):1138–1149.
Pedregosa, F., Varoquaux, G., Gramfort, A., Michel, V.,
Thirion, B., Grisel, O., Blondel, M., Prettenhofer,
P., Weiss, R., Dubourg, V., Vanderplas, J., Passos,
A., Cournapeau, D., Brucher, M., Perrot, M., and
Duchesnay, E. (2011). Scikit-learn: Machine learning
in Python. Journal of Machine Learning Research,
12:2825–2830.
Saltelli, A., Ratto, M., Andres, T., Campolongo, F., Cari-
boni, J., Gatelli, D., Saisana, M., and Tarantola, S.
(2008). Global sensitivity analysis: the primer. John
Wiley & Sons.
Wang, H., Ruan, X.-Y., and Zhou, X. (2003). Research on
injection mould intelligent cost estimation system and
key technologies. The International Journal of Ad-
vanced Manufacturing Technology, 21(3):215–222.
Windmann, S. and Niggemann, O. (2015). Data-driven as-
sistance functions for industrial automation systems.
In Journal of Physics: Conference Series, volume
659, page 012045. IOP Publishing.
Zhang, C. and Chen, T. (2001). Efficient feature extraction
for 2d/3d objects in mesh representation. In Proceed-
ings 2001 International Conference on Image Pro-
cessing (Cat. No. 01CH37205), volume 3, pages 935–
938. IEEE.
Case Study on Model-based Application of Machine Learning using Small CAD Databases for Cost Estimation
265
