
Analysis of Sensor Locations on Human Body for Wearable Sensor
based Activity Classification during Fast Bowling in Cricket
Jayamini Ranaweera and Pujitha Silva
Department of Electronic and Telecommunication Engineering, University of Moratuwa, Sri Lanka
Keywords: Human Activity Classification, Fast Bowling, Pattern Recognition, Wearable Technology, Cricket.
Abstract: This paper focuses on determining best body sensor position among calf, thigh, upper trunk and forearm when
classifying Run Up, Delivery Stride and Follow Through phases during fast bowling in cricket by the usage
of a machine learning model. Nine-axis Inertial Measurement Units (IMU) were used to collect data at 350Hz
and Madgwick’s quaternion based algorithm was used for orientation estimation. The study also focused on
determining best quaternion to be considered for such activity classification requirements in fast bowling.
Three fast bowlers with Mixed type bowling action were considered for the study. A sliding window with 200
samples/window with 50% overlap collected eight, time domain statistical features from the sensor data and
Principal Component Analysis was used to reduce dimensionality of the feature set. A linear kernel based
Support Vector Machine classified the features into the three main phases and five-fold cross validation was
used to determine model performance. The results indicate that fourth quaternion on calf or forearm is the
best quaternion and body position to be considered for activity classification of fast bowling action in cricket.
1 INTRODUCTION
1.1 Phases in Fast Bowling Action
Biomechanical analysis of fast bowling action in
cricket reveals that there are three key phases during
motion: Run Up, Delivery Stride and Follow Though.
As illustrated in Figure 1, each of these phases
comprises of sub key motion activities as well.
Figure 1: Phases in fast bowling action (Craig, 2013).
In cricket, fast bowlers are more prone to injures.
Research (Craig, 2013; Burnett et al., 1998) has
demonstrated different types of injuries occurring in
each of the key phases during fast bowling. Most
injuries in fast bowling occur during Delivery Stride
phase. Further, research (Worthington et al., 2013;
Wickington et al., 2017) points to biomechanical
parameters contributing towards enhancing
performance of fast bowlers. Motion analysis can be
used to monitor such biomechanical parameters for
performance enhancement. Therefore, there is a
requirement to analyse the motion of fast bowlers in
each phase for the purposes of injury prevention and
performance enhancement.
However, wearable sensors (when used for
motion analysis) provide continuous data samples
during motion. As a result, a model is necessary to
segment the data samples into its key phases for
analysis purposes.
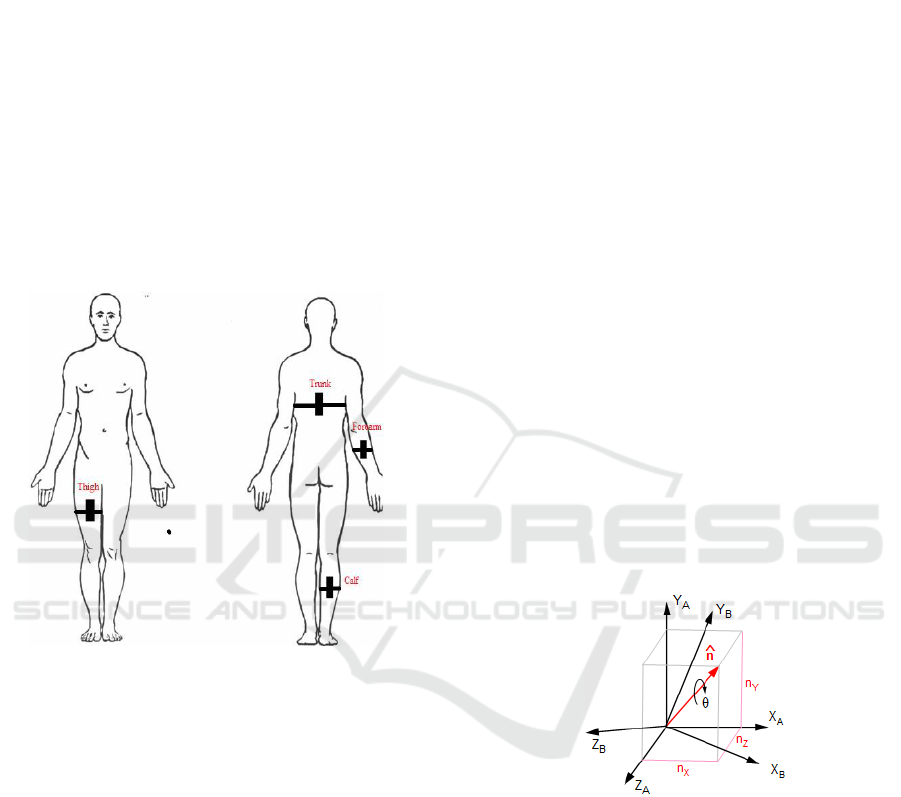
1.2 Body Sensor Locations
As the first step towards this activity segmentation, it
is important to determine which body sensor location
would provide the best results during classification of
key phases in fast bowling action. Therefore,
wearable sensors were placed on different locations
on the body during bowling to collect data. However,
it was evident that certain locations would provide
more deviations of the sensor values during bowling.
Sensor placement for Inertial Measurement Unit
(IMU) based bowling action legality classification
(Salman et al., 2017) used three IMU sensors placed
on upper arm, forearm and wrist. Previous research
(Attal et al., 2015; Olguin et al., 2006; Pirttikangas et
al., 2006) has conducted extensive analysis to
understand the effect of placing sensors on different
body locations and their effect on measurement of
Ranaweera, J. and Silva, P.
Analysis of Sensor Locations on Human Body for Wearable Sensor based Activity Classification during Fast Bowling in Cricket.
DOI: 10.5220/0008065100210031
In Proceedings of the 7th International Conference on Sport Sciences Research and Technology Support (icSPORTS 2019), pages 21-31
ISBN: 978-989-758-383-4
Copyright
c
2019 by SCITEPRESS – Science and Technology Publications, Lda. All rights reserved
21
bodily movements. The effect of placing sensors on
wrist, thigh, neck, chest, lower back, waist, calf, etc.
have been examined. There has been a general
tendency to obtain better results when sensors were
placed on the waist. It is assumed, that this may be
due to the proximity of waist towards the centre of
mass in the human body. Further, research (Attal et
al., 2015) illustrated that accuracy of human activity
recognition decreased when the number of wearable
sensors used increased beyond a certain number.
Therefore, it was important to determine the best
number of sensors to be used for such human activity
classification tasks. Following research concentrated
on studying the effect of activity classification for
sensors placed on the forearm, upper trunk, thigh and
calf (Figure 2).
Figure 2: Body sensor placement positions for the study.
1.3 Inertial Measurement Units
Most of the research on activity classification (Groh
et al., 2015; Aoki et al., 2013; Wu et al., 2016) with
wearable sensors have focused on using Inertial
Measurement Units (IMU’s) which comprises of a
three-axis accelerometer, three-axis gyroscope and
three-axis magnetometer. The range of
accelerometer, gyroscope, magnetometer values and
resolution depend on the specific application. IMU’s
used for trick classification (Groh et al., 2015) during
snowboarding used +/- 16g accelerometer and +/-
2000
o
/s gyroscope with 16-bit resolution. When the
movement speed increases accelerometer range needs
to increase accordingly. Fast bowling in cricket
requires a sampling rate of beyond 300Hz. However,
a major constraint at present is finding IMU’s with
greater accelerometer ranges. In most IMU based
applications, magnetometer is also included to help
eradicate drifting errors which are caused due to
gyroscopic drifting. Magnetometer assists to provide
the earth’s horizontal magnetic field and
accelerometer provides the vertical acceleration due
to gravity which act as the base for drift compensation
(Roetenberg, 2006). Another key parameter for IMU
selection is its physical size. Since, majority of the
IMU based applications are wearable, most studies
(Salman et al., 2017; Groh et al., 2015; Gowda et al.,
2017) have focused on physically smaller IMU’s.
IMU developers have managed to reduce the size of
the component while also increasing their
performance parameters. Hence, 9-axis IMU’s were
used as relevant wearable sensors for this research.
This was achieved by using Kairos (Gawsalyan, et al.,
2017; Kathirgamanathan et al., 2018) motion analysis
system for data collection.
1.4 Orientation Estimation Algorithm
The outputs from the Kairos motion analysis system
were four quaternion values per each sensor. The
orientation estimation algorithm used in the system
was based on Madgwick’s orientation estimation
filter (Madgwick, 2010) (quaternion based). By
visualization, it is easier to understand a quaternion
with reference to the rotation created by rotating
frame B to A as illustrated below in Figure 3. In a
nutshell, it represents the orientation of frame B with
reference to frame A.
Figure 3: Quaternion rotation (Norris, 2011).
Where,
= quaternion real component
,
,
= quaternion
imaginary components
= imaginary vectors with
=
=
= -1
= rotation angle
= rotation axis components
icSPORTS 2019 - 7th International Conference on Sport Sciences Research and Technology Support
22
As a result, in this research, the effect of each
quaternion on each body sensor location for activity
classification of three key phases in fast bowling was
analysed.
1.5 Activity Classification in Cricket
Most common classification related problem for
bowling is centred at determining if a certain bowling
action is legal or not. Vision based systems are
generally used to segment the bowling window to
analyse the legality of bowling actions. However,
modern research (Attal et al., 2015) has also used
wearable sensors to collect three-dimensional
rotational data and used supervised classification
techniques such as k-Nearest Neighbour, Naïve
Bayes, Support Vector Machines, etc. to classify the
legality of bowling actions. Initial research
(Rowlands et al., 2009) on usage of wearable sensors
in cricket has used inertial sensors placed at the centre
of mass of a ‘Front On’ fast bowler to determine Run
Up speed, Pre-Delivery Stride length and Hip
Rotational Angle.
2 METHOD
This research focuses on extraction of time domain
statistical features from IMU data, which act as inputs
to a supervised classifier to classify the three main
phases of Run Up, Delivery Stride and Follow
Through for every quaternion at each of the four
specified body locations. Five-fold cross validation
was used to determine model performance. The body
locations and corresponding quaternions were
analysed for their performance during classification.
The body position which produces best classification
results can be considered as the suitable location to
collect data for such classification tasks in fast
bowling. Therefore, a pattern recognition algorithm
was developed to determine the best on body sensor
position.
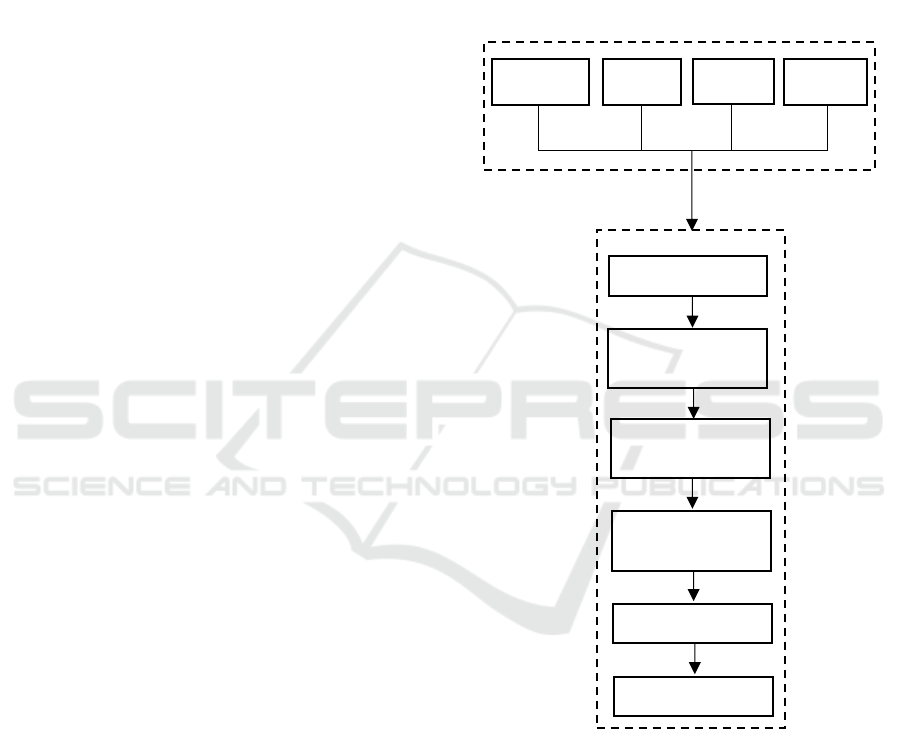
2.1 System Design
As illustrated in Figure 4, the system initiates with
IMU sensors (MPU 9250) being placed on the
specific locations collecting quaternion data at
350Hz. The collected data were sent wirelessly by an
ESP 8266 microcontroller to a PC to be stored in a
.csv file in real time for post processing. Data were
collected for each of the three phases (Run Up,
Delivery Stride and Follow Through). During post
processing, a sliding window collected time domain
features from the data followed by a dimensionality
reduction step. The dimensionally reduced data set
was fed into a supervised classifier and its
corresponding performance was analysed. Data from
each quaternion on every specified body location
were classified and the body position and quaternion
with best performance was selected. R programming
language was used for all machine learning aspects of
the analysis.
Figure 4: System flow diagram.
2.2 Signal Processing and Connectivity
Microcontrollers are generally used as the signal
processing unit in motion analysis systems. Further,
wireless transmission of orientation data,
visualization and analysis on a secondary computer
ease the data collection process. Therefore, a Wi-Fi
based ESP 8266 microcontroller was used in this
research as the brain of the system to run the
orientation estimation and data transmission
algorithms. As illustrated in Figure 5, the Kairos
Thigh
Forearm
Calf
Trunk
q
1
,q
2
,q
3
,q
4
q
1
,q
2
,q
3
,q
4
q
1
,q
2
,q
3
,q
4
q
1
,q
2
,q
3
,q
4
Body Sensor Positions
Pattern Recognition
.csv File
Sliding
Window
Time Domain
Feature Selection
Dimensionality
Reduction
Classification
Evaluation
Analysis of Sensor Locations on Human Body for Wearable Sensor based Activity Classification during Fast Bowling in Cricket
23
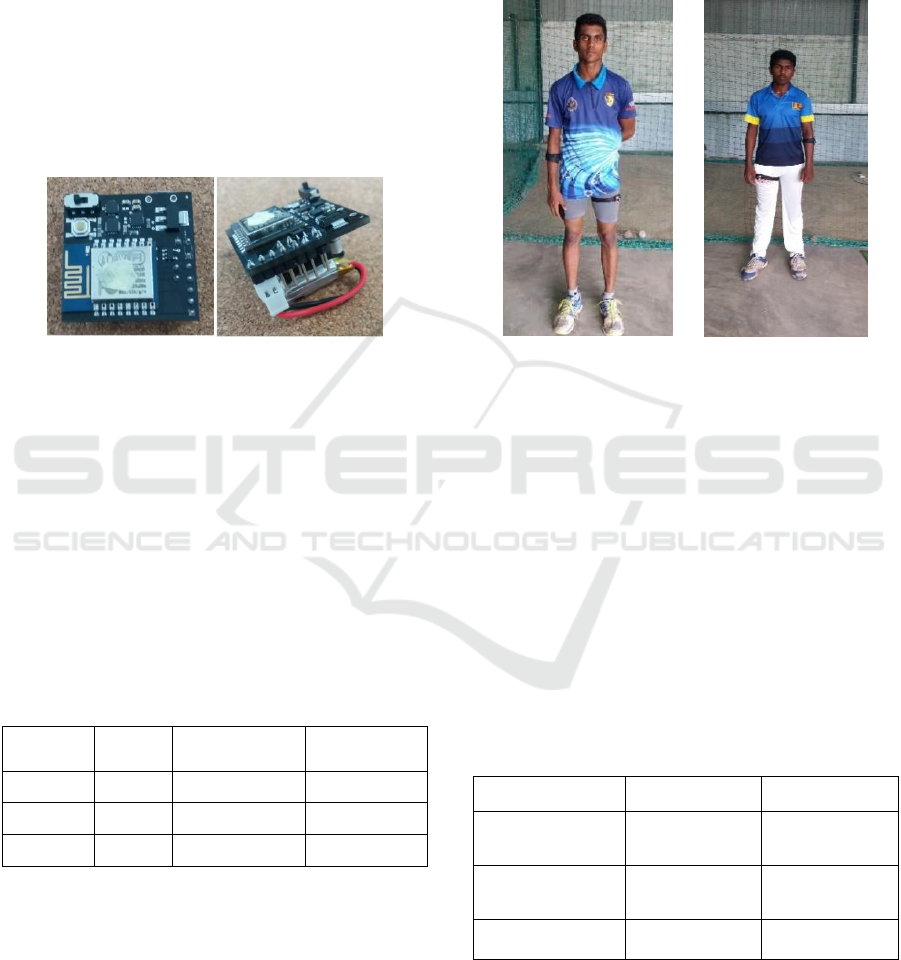
motion analysis system comprises of an ESP 8266
module integrated with a MPU 9250 IMU.
For this application, User Diagram Protocol
(UDP) was used to transmit data from microcontroller
to computer. It was possible to achieve sampling and
transmission rates of better than 350Hz. However, a
drawback of UDP was the loss of certain data packets
during transmission (in some instances). A Python
based socket programming application was
developed to collect the transmitted data and store in
a .csv file in the computer before being input to the
machine learning model. Finally, a 180mAh Lithium
Polymer battery was used to power the circuit after
analysing peak power consumption during operation.
Figure 5: IMU Sensor with battery and ESP module.
2.3 Data Collection
Three participants were selected for the initial data
gathering to determine body sensor position that
would provide best accuracy results for classification.
All participants belonged to ‘Mixed type’ fast
bowling action type and were active cricketers at the
instance of data collection. Official consent was
obtained from each participant to participate in the
data gathering and to take photos and videos during
the session. Table 1 represents age, height and weight
for the three participants.
Table 1: Fast bowlers age, height and weight distribution.
Bowler
Age
Height (cm)
Weight (Kg)
1
27
164
63
2
17
172
60
3
17
170
65
Sensors mounted using Velcro straps were placed
on specific body positions (Figure 6,7) and the
subjects were requested to bowl with the sensors. As
specified previously, four positions on the body were
considered as potential sensor placement areas.
• Thigh – Sensors were placed on the front leg (left
leg for right arm bowlers and vice versa).
• Forearm – Sensors were placed on the bowling
arm (right arm for bowlers delivering with right
arm and vice versa).
• Trunk – Sensors were placed on the upper trunk.
• Calf – Sensors were placed on the front leg (same
as the thigh).
Figure 6: Second bowler. Figure 7: Third bowler.
2.4 Definition of Classes for Supervised
Classification
One critical parameter for the classification model
was to derive the separate classes for every phase:
Run up, Delivery Stride and Follow through.
Therefore, data gathering was conducted separately
for each phase. Data collection was initiated and
ended visually for each phase (Figure 8).
• Full delivery – 5 iterations per subject
• Run Up – 4 iterations per subject
• Delivery Stride - 4 iterations per subject
• Follow Through - 4 iterations per subject
Table 2: Data gathering sequence per class.
Segment
Beginning
End
Run Up
First Clap
Pre-Delivery
Stride end
Delivery Stride
Mid Bound
Start
Ball Release
Follow Through
Ball Release
Final Clap
The beginning and end for each phase was defined
as specified above in Table 2.
icSPORTS 2019 - 7th International Conference on Sport Sciences Research and Technology Support
24
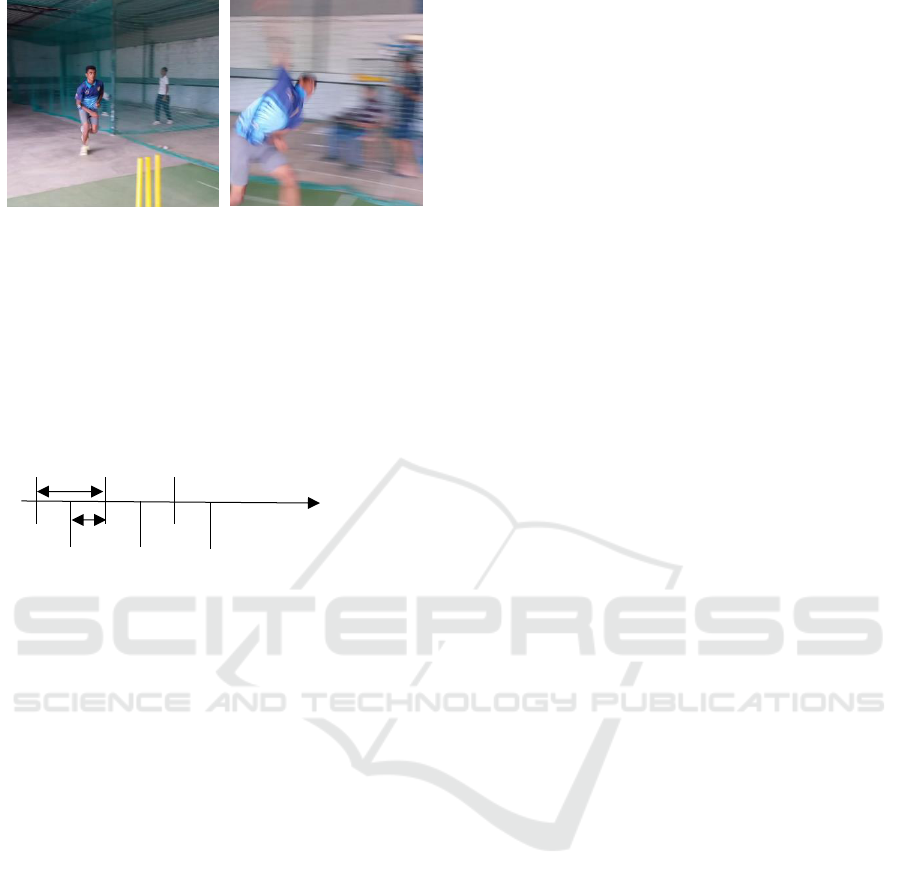
Figure 8: Illustration of Delivery Stride phase.
2.5 Feature Selection
A sliding window was used to obtain features for the
classification model. Each window comprised of 200
samples and a window overlap of 50% was used
(Figure 9). This was done independently for every
quaternion on each body sensor position.
Figure 9: Sliding window for feature collection.
Time domain statistical features were used for this
analysis. Hence, eight, time domain statistical
features were calculated for each sliding window:
Mean, Median, Variance, Skewness, Kurtosis,
Median Absolute Deviation, Root Mean Square and
Interquartile Range.
2.6 Feature Scaling
A standardization step was required prior to
dimensionality reduction for features which were out
of scale. In this approach, mean and standard
deviation of entire feature vector was calculated. The
dataset was scaled by subtracting every element by
the mean and dividing by the standard deviation.
2.7 Dimensionality Reduction
2.7.1 Principal Component Analysis (PCA)
To minimize over fitting and for visualization
purposes PCA was used for dimensionality reduction.
PCA transforms the original variables into a new set
of small variables without losing the most important
information of the original data. Owing to
requirements of visualization in this study, the
original dataset was transformed into two principal
components. This was achieved by assuming
directions with largest variances as the most
important. In this instance PC1 (First Principal
Component) and PC2 (Second Principal Component)
were generated and they were orthogonal to each
other with PC1 acting as the most important direction.
2.8 Classification
2.8.1 Support Vector Machine (SVM)
Support Vector Machine (SVM) has been used as a
classification (Attal et al., 2015; Fei et al., 2004) and
regression algorithm. Throughout literature (Attal et
al., 2015; Fei et al., 2004) SVM’s have been used for
human movement classification as a supervised
classifier. However, literature (Attal et al., 2015)
illustrates that k-NN classifier has performed better in
human movement classification tasks compared to
SVM’s in certain instances. But in this scenario, the
requirement was to compare one classifier against
different datasets. In k-NN, selecting correct ‘k’
number across all datasets was challenging. Hence a
SVM was more suitable in this instance. Following
characteristics in SVM were also considered for its
selection.
• Suitable for instances with less number of classes.
In this instance, there were three classes (bowling
phases).
• Suits classification with higher number of
features. Current classification consisted of eight
features.
• When there is non-uniform weighing among
features.
In SVM’s, features are mapped into high dimensions
and a corresponding hyperplane is selected to best
classify the results. However, it was noted that
application of PCA reduced dimensionality prior to
classification. Therefore, a linear ‘kernel’ was used
for the SVM for classification.
2.9 Evaluation
Five-fold Cross Validation was used to evaluate every
model. The dataset was divided into five subsets
where one of them acted as the test set and the others
as training sets. For each subset Accuracy, Precision
and Recall were calculated. This was repeated five
times and the average of each parameter was
considered as the final value. Finally, F-measure was
calculated from the averages of Precision and Recall.
Body sensor position and quaternion providing best
values among the evaluation parameters were
50% overlap
200 samples/window
Samples
Analysis of Sensor Locations on Human Body for Wearable Sensor based Activity Classification during Fast Bowling in Cricket
25
selected as the suitable quaternion and best on body
sensor position.
Where,
The above parameters were derived based on the
confusion matrices generated for each classification.
Table 3: Example 3x3 confusion matrix.
Run
Up
Delivery
Stride
Follow
Through
Run Up
13
0
1
Delivery Stride
6
31
1
Follow Through
9
0
27
From the matrices (example in Table 3),
Accuracy would be indicated by sum of diagonal
values (correctly classified instances) divided by total
number of instances. Precision would be defined from
the confusion matrix as the ratio of number of
correctly classified instances per phase (class) to the
number of predictions per phase. Whereas Recall
would be the ratio of number of correctly classified
instances per phase to the number of instances per
phase.
3 EXPERIMENTAL RESULTS
3.1 Original Data Patterns
The first step was to observe the data patterns
generated from the IMU sensors when each fast
bowler completed his action. The experiment initiated
with data collection from sensors on calf, followed by
thigh, trunk and forearm.
Collecting data from trunk was a challenge due to
the difficulty in holding the sensors steady during
delivery. Further, the sensors were positioned in a
way not to discomfort the bowler during delivery.
The experiment was conducted at ‘Cric Sri Lanka’
indoor cricket academy. The head coach of the
academy was present and was given the responsibility
to observe the deliveries. This was done to highlight
if any variations were observed in the bowler’s
actions from the normal action. The bowlers were
requested to perform their deliveries with the
intention of hitting a stump placed at the batmen’s
end. This was done to generalize each delivery from
the bowlers.
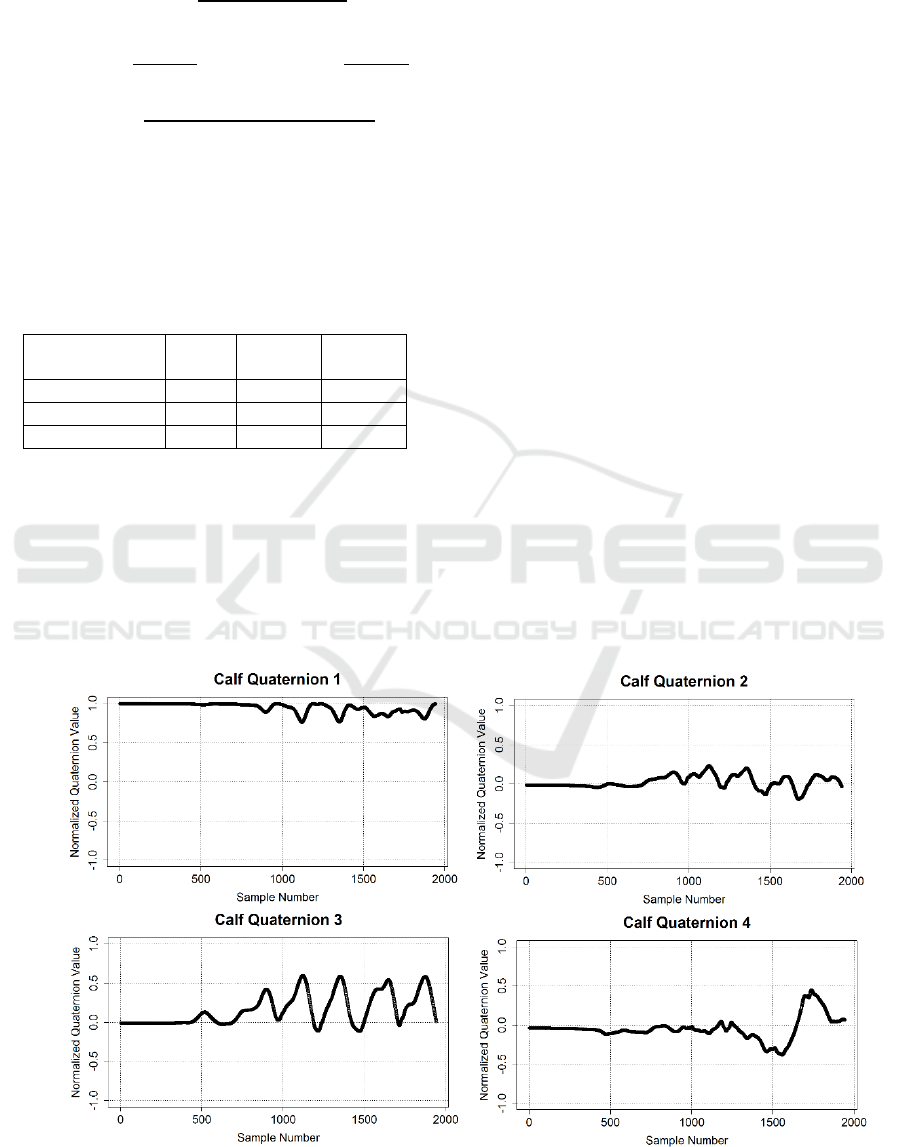
Figures 10, 11, 12 and 13 illustrate the patterns
generated from first bowler, during full delivery, for
every quaternion at calf, thigh, forearm and trunk.
The graphs illustrate normalized quaternion value on
y-axis and the relevant sample number on the x-axis.
Figure 10: Quaternion illustration of sensor data from calf for fast bowler 1.
icSPORTS 2019 - 7th International Conference on Sport Sciences Research and Technology Support
26
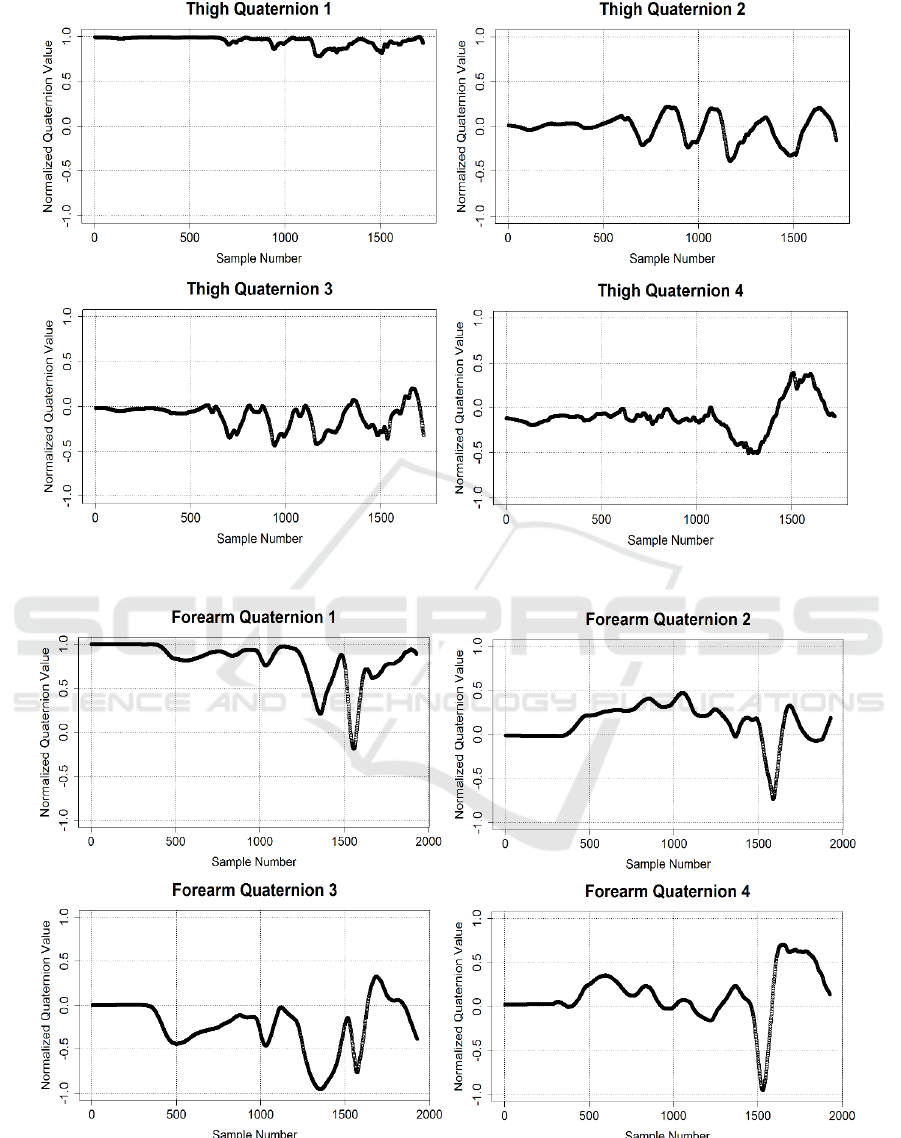
Figure 11: Quaternion illustration of sensor data from thigh for fast bowler 1.
Figure 12: Quaternion illustration of sensor data from forearm for fast bowler 1.
Analysis of Sensor Locations on Human Body for Wearable Sensor based Activity Classification during Fast Bowling in Cricket
27
The initial graphs developed from the sensor on the
calf (Figure 10) demonstrated fluctuations among all
quaternions. Quaternion 1, 2 and 3 demonstrated
consistent deviations and fourth quaternion showed
sudden variations in the graph, which may indicate
boundaries for different phases in bowling. Graphed
data plot from thigh (Figure 11) demonstrated
similarities to the data from the calf. Only fourth
quaternion demonstrated higher variations in the plot.
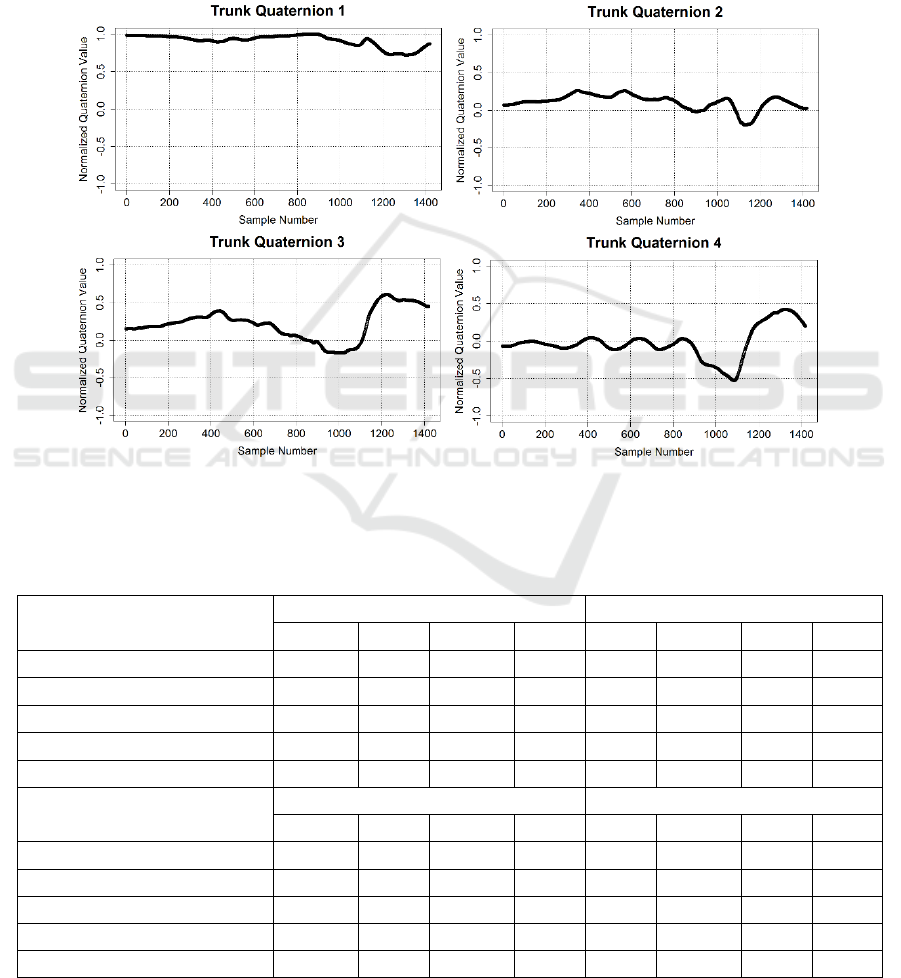
From the sets of data received from trunk (Figure 13),
quaternion 3 and quaternion 4 demonstrated higher
variations. All quaternion data from forearm (Figure
12) demonstrated higher fluctuations/variations
throughout the plot. However, it was difficult to
determine separability of phases and performance by
observing the original plots. Hence it was necessary
to observe the results from the machine learning
model to determine best sensor location for
classification of three key phases in fast bowling.
Figure 13: Quaternion illustration of sensor data from trunk for fast bowler 1.
3.2 Classification Results
Table 4: Performance parameter results from classification.
Evaluation Parameter
Forearm
Trunk
Q1
Q2
Q3
Q4
Q1
Q2
Q3
Q4
Accuracy (%)
93.02
89.76
83.79
96.39
78.14
92.24
78.34
93.92
Standard Deviation (+/- %)
1.77
2.79
2.8
2.11
2.39
3.35
4.87
3.16
Precision (%)
93.18
89.97
84.35
96.45
79.02
92.56
81.53
93.63
Recall (%)
92.9
89.51
84.37
96.22
78.29
91.84
78.32
94
F-Measure (%)
93.04
89.74
84.36
96.34
78.66
92.19
79.89
93.81
Evaluation Parameter
Thigh
Calf
Q1
Q2
Q3
Q4
Q1
Q2
Q3
Q4
Accuracy (%)
73.73
58.57
54.44
89.17
96.38
85.67
75.9
99
Standard Deviation (+/- %)
4.26
3.87
4.61
2.53
1.57
0.66
3.84
0.2
Precision (%)
74.54
58.97
59.75
89.37
96.43
85.9
78.27
99
Recall (%)
73.5
58.43
54.1
89.03
96.37
85.34
76.57
99
F-Measure (%)
74.02
58.7
56.79
89.2
96.4
85.62
77.41
99
Q1 – Quaternion 1 Q2 – Quaternion 2 Q3 – Quaternion 3 Q4 – Quaternion 4
icSPORTS 2019 - 7th International Conference on Sport Sciences Research and Technology Support
28
The results from Table 4 indicate that forearm and
calf provided best classification results when
classifying Run Up, Delivery Stride and Follow
Through phases of fast bowling action in cricket. In
all body positions, the fourth quaternion has produced
good performance results with best Accuracy,
Precision, Recall and F-Measure results. The fourth
quaternion on calf has produced the best Accuracy,
Precision, Recall and F- Measure of 99%. Fourth
quaternion on forearm, also produced a good
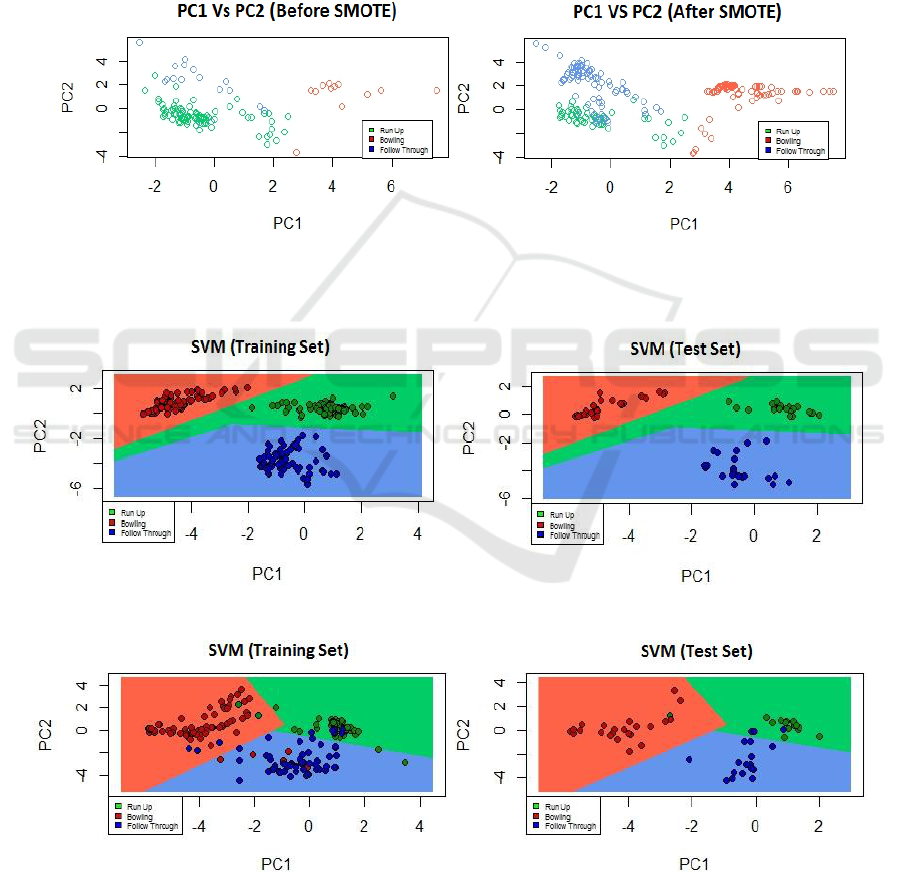
Accuracy level of 96.39%. During the study, it was
observed that among the three phases, Run Up had
more data points in comparison to the other two
phases. Hence, Synthetic Minority Over-Sampling
Technique (SMOTE) (Chawla et al., 2002) was used
to balance the data sets by oversampling data in
Delivery Stride and Follow Through phases after
applying PCA to eradicate the errors that may be
caused due to unbalanced classes (phases) on the
SVM classification model. Corresponding results
have been visualized in Figure 14.
Figure 14: Balancing of data sets by using SMOTE.
3.3 Visualisation of Classification Results
Figure 15: Training set vs Test set plot of fourth quaternion data from calf.
Figure 16: Training set vs Test set plot of fourth quaternion data from thigh.
Analysis of Sensor Locations on Human Body for Wearable Sensor based Activity Classification during Fast Bowling in Cricket
29
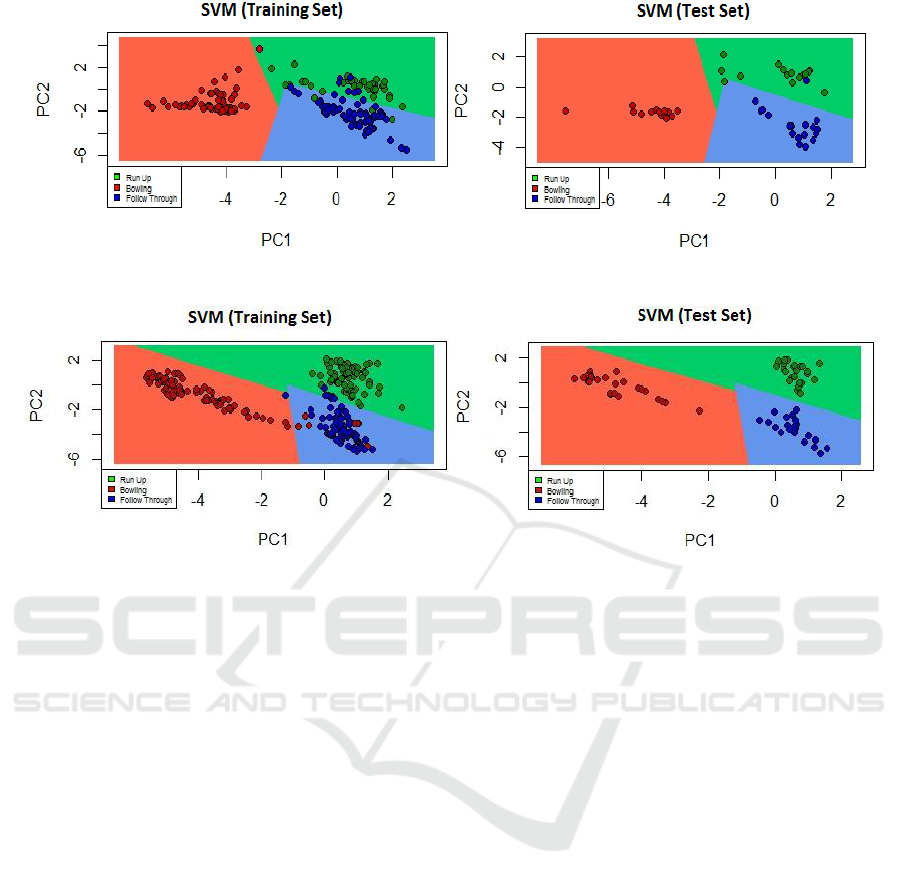
Figure 17: Training set vs Test set plot of fourth quaternion data from trunk.
Figure 18: Training set vs Test set plot of fourth quaternion data from forearm.
Above visualization results in Figures 15,16,17 and
18 presents fourth quaternion plots for every on-body
sensor position derived from five-fold cross
validation. Corresponding training and test sets have
been plotted in relation to the subset providing best
results among the five subsets. Hence, it is clearly
visible that calf and forearm demonstrates best
classification results from SVM classifier.
4 CONCLUSION
This paper introduces an analysis towards the
determination of best Inertial Measurement Unit
(IMU) body placement position to classify the three
main phases (Run Up, Delivery Stride and Follow
Through) of fast bowling action in cricket. The results
indicate that both forearm and calf are suitable
positions among calf, thigh, trunk and forearm for
placing sensors in relation to activity classification of
fast bowling in cricket. However, calf provides best
overall performance from the SVM based
classification model. Among all the quaternions
considered the fourth quaternion provides best results
among all quaternions. Hence it can be concluded that
fourth quaternion on calf or forearm can be
considered for future similar applications of activity
classification in cricket. However, there is a case to
continue the study further to determine the effect of
using raw tri-axial accelerometer, gyroscope and
magnetometer values in the classification. Further,
the effect of using a more derived measurement such
as a yaw, pitch and roll can also be considered.
The above experiment used individual sensors for
each on body position. Further, there is a requirement
in future, to study the effect of using multiple sensors
for similar activity classification of fast bowling
action in cricket. The results from the study (Olguin
et al., 2006) indicate a rapid increase in accuracy
when a second sensor is added for classification. This
trend of increase in classification accuracy continues
when all three sensors are used for classification.
Although the study (Olguin et al., 2006) uses an
unsupervised classification method, there is a definite
case to add a secondary sensor to increase
classification accuracy of the discussed model in the
current research. The results indicate that fourth
quaternions on calf and forearm can be used for this
purpose, since they represent high individual
classification accuracies and represent upper and
lower body segments. Finally, in future, the effect on
model performance can be studied by increasing the
number of participants and repeating the experiment.
icSPORTS 2019 - 7th International Conference on Sport Sciences Research and Technology Support
30

REFERENCES
Craig, (2013). The Bowler’s Back. Internet:
https://biomechanics101.wordpress.com/2013/12/06/th
e-bowlers-back/.
Burnett, A.F., Barrett, C.J., Marshall R.N., Elliott B.C., and
Day R.E (1998). Three-dimensional measurement of
lumbar spine kinematics for fast bowlers in cricket.
Clinical Biomechanics, vol. 18, issue 8, pp. 574-583.
Worthington, P.J., King, M.A., and Ranson, C.A. (2013).
Relationships between fast bowling technique and ball
release speed in cricket. Journal of Applied
Biomechanics, 29 (1), pp. 78 –84.
Wickington, K.L., and Linthorne, N.P. (2017). Effect of
Ball Weight on Speed, Accuracy, and Mechanics in
Cricket Fast Bowling, Sports, vol. 5(1).
Salman, M., Ali, S.Q., and Qamar, M. (2017).
Classification and legality analysis of bowling action in
the game of cricket, Data Mining and Knowledge
Discovery, vol. 31, issue 6, pp. 1706-1734.
Attal, F., Mohammed, S., Dedabrishvili, M., Chamroukhi,
F., Oukhellou, L., and Amirat, Y. (2015). Physical
Human Activity Recognition Using Wearable Sensors,
Sensors, vol. 15, issue 12, 31314–31338.
Olguin, D.O., and Pentland, A. (2006). Human Activity
Recognition: Accuracy across Common Locations for
Wearable Sensors, IEEE 10th International Symposium
on Wearable Computers, Montreux, Switzerland.
Pirttikangas, S., Fujinami, K., and Nakajima, T. (2006).
Feature Selection and Activity Recognition from
Wearable Sensors. In Ubiquitous Computing Systems;
Springer: Berlin, Germany, pp. 516–527.
Groh, B.H, Kautz, T., Schuldhaus D., and Eskofier, B.M.
(2015). IMU-based Trick Classification in
Skateboarding, KDD Workshop on Large-Scale Sports
Analytics, Sydney, Australia.
Aoki, T., Venture, G., and Kulic, D. (2013). Segmentation
of Human Body Movement using Inertial
Measurement Unit, IEEE International Conference on
Systems, Man, and Cybernetics.
Wu, J., Sun, L., and Jafari, R. (2016). A Wearable System
for Recognizing American Sign Language in Real-time
Using IMU and Surface EMG Sensors, IEEE Journal
of Biomedical and Health Informatics, vol. 20, issue 5.
Roetenberg, D. (2006). Inertial and Magnetic Sensing of
Human Motion. PhD Thesis, University of Twente,
Netherlands, Page 15.
Gowda, M., Dhekne, A., Shen, S., Choudhury, R.R., Yang,
X., Yang, L., Golwalkar, S., and Essanian, A. (2017).
Bringing IoT to Sports Analytics, 14
th
USENIX
Symposium Networked Systems Design and
Implementation, Boston.
Gawsalyan, S., Janarthanan, T.S., Thiruthanikan,
N., Shahintha, R., and Silva, P. (2017). Upper limb
analysis using wearable sensors for cricket, Second
International Conference on Electrical, Computer and
Communication Technologies, India.
Kathirgamanathan, B., Silva, P., and Fernandez, J. (2018).
Implication of obesity on motion, posture and internal
stress of the foot: an experimental and finite element
analysis. Computer Methods in Biomechanics and
Biomedical Engineering. 22. 1-8.
Madgwick, S.O.H. (2010). An efficient orientation filter for
inertial and inertial/magnetic sensor arrays.
Norris, T., and Norris, A. (2011). Internet:
http://www.tobynorris.com/work/prog/csharp/quatvie
w/help/orientations_and_quaternions.htm.
Rowlands, D., James, D.A., and Thiel, D. (2009). Bowler
analysis in cricket using centre of mass inertial
monitoring, Sports Technology, Volume 2, pp. 39-42.
Fei, H., and Reid, I. (2004). Dynamic Classifier for Non-
Rigid Human Motion Analysis, BMVC.
Chawla, N.V., Bowyer, K.W., Hall, L.O., Kegelmeyer,
W.P. (2002). SMOTE: Synthetic Minority Over –
sampling Technique. Journal of Artificial Intelligence
Research, vol 16, pp. 321-357.
Analysis of Sensor Locations on Human Body for Wearable Sensor based Activity Classification during Fast Bowling in Cricket
31
