
Identifying Different Types of Social Ties in Events from Publicly
Available Social Media Data
Jayesh Prakash Gupta
1 a
, Hannu K
¨
arkk
¨
ainen
1 b
, Karan Menon
1 c
, Jukka Huhtam
¨
aki
1 d
,
Raghava Rao Mukkamala
3,5 e
, Abid Hussain
3 f
, Ravi Vatrapu
5,6 g
, Jari Jussila
4 h
,
Henri Pirkkalainen
1 i
and Thomas Olsson
2 j
1
Unit of Information and Knowledge Management, Tampere University, Tampere, Finland
2
Faculty of Information Technology and Communication, Tampere University, Tampere, Finland
3
Department of Digitalization, Copenhagen Business School, Copenhagen, Denmark
4
HAMK Smart Research Unit, H
¨
ame University of Applied Sciences, H
¨
ameenlinna, Finland
5
Department of Technology, Kristiania University College, Oslo, Norway
6
Dept. of ITM, Ted Rogers School of Management, Ryerson University, Toronto, Canada
Keywords: Tie Strength, Weak Ties, Social Media, Twitter, Facebook.
Abstract:
Tie strength is an essential concept in identifying different kind of social ties - strong ties and weak ties. Most
present studies that evaluated tie strength from social media were carried out in a controlled environment and
used private/closed social media data. Even though social media has become a very important way of network-
ing in professional events, access to such private social media data in those events is almost impossible. There
is very limited research on how to facilitate networking between event participants and especially on how to
automate this networking aspect in events using social media. Tie strength evaluated using social media will be
key in automating this process of networking. To create such tie strength based event participant recommen-
dation systems and tools in the future, first, we need to understand how to evaluate tie strength using publicly
available social media data. The purpose of this study is to evaluate tie strength from publicly available social
media data in the context of a professional event. Our case study environment is community managers’ online
discussions in social media (Twitter and Facebook) about the CMAD2016 event in Finland. In this work, we
analyzed social media data from that event to evaluate tie strength and compared the social media analysis-
based findings with the individuals’ perceptions of the actual tie strengths of the event participants using a
questionnaire. We present our findings and conclude with directions for future work.
1 INTRODUCTION
The concept of tie strength was originally proposed by
Mark Granovetter (1973) in his seminal study “The
Strength of Weak Ties”. According to Granovetter
there are two main kinds of social ties (strong ties and
a
https://orcid.org/0000-0003-4043-4818
b
https://orcid.org/0000-0003-4753-4416
c
https://orcid.org/0000-0001-9948-9659
d
https://orcid.org/0000-0003-2707-108X
e
https://orcid.org/0000-0001-9814-3883
f
https://orcid.org/0000-0002-8985-3020
g
https://orcid.org/0000-0002-9109-5281
h
https://orcid.org/0000-0002-7337-1211
i
https://orcid.org/0000-0002-5389-7363
j
https://orcid.org/0000-0002-1106-2544
weak ties) and tie strength evaluation can be used to
understand these different interpersonal relationships
or social ties. Over the decades the concept of tie
strength has been of significant interest in academic
research in various different domains and has over
50000 citations on Google scholar.
The rise of social media has enabled new ways
to establish, strengthen and manage social ties on-
line (Ahn and Park, 2015). This has resulted in a lot
of studies that have used social media data to evalu-
ate tie strength and identify the different kind of so-
cial ties (e.g. (Gilbert and Karahalios, 2009; Fogu
´
es
et al., 2013; Ahn and Park, 2015). Most of these stud-
ies have either used explicit social media relationship
data (e.g. Friends in Facebook, Followers/Followee in
Twitter) or private social media data of study partic-
176
Gupta, J., Kärkkäinen, H., Menon, K., Huhtamäki, J., Mukkamala, R., Hussain, A., Vatrapu, R., Jussila, J., Pirkkalainen, H. and Olsson, T.
Identifying Different Types of Social Ties in Events from Publicly Available Social Media Data.
DOI: 10.5220/0008065501760186
In Proceedings of the 11th International Joint Conference on Knowledge Discovery, Knowledge Engineering and Knowledge Management (IC3K 2019), pages 176-186
ISBN: 978-989-758-382-7
Copyright
c
2019 by SCITEPRESS – Science and Technology Publications, Lda. All rights reserved

ipants and in many cases both of them (Gupta et al.,
2016). Some of the studies also collected the social
media data by crawling the social media pages of the
study participants in a controlled environment (e.g.
Gilbert and Karahalios (2009)). However, in the past
few years the social media platforms have become
very restrictive and allow data access only through
their application programming interface (API). Also,
a lot of data which was earlier accessible is no longer
accessible (e.g. Friends in Facebook) and practices
like data crawling are illegal on these social media
platforms. Along with this introduction of new data
protection laws like General Data Protection Regula-
tions (GDPR) by the European Union has further re-
stricted the use of private social media data. Hence,
there is a need to carry out research related to tie
strength which relies on publicly available social me-
dia data.
The use of social media for maintaining and es-
tablishing ties has gone beyond the private life and is
increasingly being used in a professional context like
conferences. One of the main purposes of such pro-
fessional events is to facilitate networking and finding
potential collaborations between event participants
(Ross et al., 2011). One increasingly important means
for networking people in such professional events like
conferences is social media (Reinhardt et al., 2009).
Many such professional events also use conference
recommendation tools and systems (e.g. Zhang et al.
(2016)) to facilitate networking. To the best of our
knowledge, the current conference related recommen-
dation tools and systems don’t use or incorporate the
tie strength aspect while making a recommendation.
Even recommendation systems in general rarely use
the aspect of tie strength (Zhong et al., 2015). Tie
strength matters in case of professional events like
professional conferences. Tie strength enables iden-
tifying different kind of social ties (strong, weak) i.e.
different kind of people. Incorporating tie strength
element into such a conference recommendation sys-
tem will enable providing a more useful and relevant
recommendation for the event participants. In gen-
eral and more specifically in the context of events it
is impossible to get either explicit online relationship
data or private social media data of event participants.
Thus, the previous tie strength related studies cannot
be used. However, it is possible to collect publicly
available social media data of the event. In order to
enable incorporation of tie strength aspect into the fu-
ture conference recommendation tools and systems,
we need to first understand how to evaluate the tie
strength and identify different types of social ties from
publicly available social media data of an event.
The current literature does not provide any clear
methods for evaluating tie strength using publicly
available social media data in the context of an event.
Taking into consideration the above-described re-
search gaps in current literature, we have derived the
following research question to address the research
gaps:
RQ. How can tie strength be evaluated from pub-
licly available social media data in the context of
events ?
The structure of the paper is as follows. In sec-
tion 2, we first introduce the concept of tie strength,
then tie strength evaluation using social media and
how networking is done in events. Then in section 3,
we provide the case description, data collection and
data analysis methods used in paper and section 4 will
present our findings. Finally, in section 5, we will
discuss the conclusions, managerial implications and
future work.
2 TIE STRENGTH IN AN EVENT
SETTING
In this section, we will briefly present the concept of
tie strength, especially in the context of social media
data and networking events.
2.1 Concept of Tie Strength
Granovetter introduced the concept of tie strength
through the seminal paper titled ”Strength of weak
ties” (Granovetter, 1973). According to Grannovet-
ter, tie strength can be defined as ”a (probably linear)
combination of the amount of time, the emotional in-
tensity, the intimacy (mutual confiding), and the re-
ciprocal services which characterize the tie”. Based
on this definition he characterized two kinds of social
ties - strong ties and weak ties. Strong ties are peo-
ple whom you trust and who can provide you emo-
tional support for example family members or close
friends. On the other hand, weak ties are people with
whom you just have acquaintance.(Granovetter, 1973;
Gilbert and Karahalios, 2009) Weak ties can serve as
bridges to diverse part of a persons’ social network
and can provide access to novel information (Mars-
den and Campbell, 1984, 2012).
In his original study, Granovetter theorized that
weak ties provided a novel source of information
while looking for a new job. Since the original study,
many studies have operationalized tie strength using
communication frequency as a proxy for tie strength
(Marsden and Campbell, 1984; Onnela et al., 2007;
Wiese et al., 2015). Over the decades, the concept
of tie strength has been used to study various social
Identifying Different Types of Social Ties in Events from Publicly Available Social Media Data
177

phenomena beyond the original job-seeking context.
(e.g. knowledge transfer (Levin and Cross, 2004) ,
information diffusion (Gilbert and Karahalios, 2009),
and content sharing (Aral and Walker, 2014; Zhan
Shi et al., 2014). At the same time, the tie strength
measurement has been extended from its original use
at an interpersonal level to organizational and inter-
organizational levels as well (Zhang et al., 2017). In
this exploratory study, we evaluate tie strength at in-
terpersonal level (between the event participants) and
use interaction frequency of the event participants on
the social media as a proxy for tie strength evaluation
in the context of a professional event.
2.2 Tie Strength using Social Media
The rise of social media has given rise to new ways
to establish and manage ties online (Ahn and Park,
2015) resulting in studies which use social media data
to calculate tie strength of these online relationships.
Table 1 provides a list of some of the most prominent
studies which have used social media data for evaluat-
ing tie strength and identifying different kind of social
ties. Table 1 also provides information about the kind
of social media used, also whether the social media
data used in the study was publicly available or was
private/ closed. In this study, publicly available so-
cial media data refers to the social media data that can
be directly accessed using the API of the social me-
dia platform (e.g. text from an open Facebook page,
tweet from Twitter). On the other hand private/ closed
social media data refers to data which is collected in
controlled environment from the participants of the
experiment/study (e.g. Gilbert and Karahalios (2009);
Fogu
´
es et al. (2013); Backstrom and Kleinberg (2013)
) and requires separate explicit user permissions (e.g.
Friend list in Facebook, direct messages in Twitter)
and cannot be directly accessed from the social media
API.
Most of the previous studies have used explicit re-
lationship and/or private social media data to calculate
the tie strength. Also, some of these studies have used
methods like data crawling which are no longer al-
lowed by social media. For example, studies to calcu-
late tie strength using Facebook have used data related
to participant’s Facebook profile and friends. In the
case of Twitter, data about the participant’s followers
and followees has been used to calculate tie strength.
(Ahn and Park, 2015; Gilbert, 2012; Fogu
´
es et al.,
2013; Gilbert and Karahalios, 2009) Some studies
have used supervised computational methods that re-
quired human annotations like rating friends or nomi-
nating top friends (Kahanda and Neville, 2009; Xiang
et al., 2010). Some studies have used unsupervised
computational methods but have still used private so-
cial media data (Xiang et al., 2010).
It can be seen from Table 1 that there has been
one study which has utilized publicly available Twit-
ter data to evaluate tie strength in order to study the
phenomena of social broadcasting (see Zhan Shi et al.
(2014)). There has also been limited research on us-
ing the implicit relationships inferred from the pub-
licly available social media content (Tweets, Face-
book posts) (Huang et al., 2015; Gupta et al., 2016).
One such study focused on studying the phenomena
of triadic closure using implicit relationships (Huang
et al., 2015). However, these studies do not provide
measures which can be directly used for tie strength
evaluation in the context of events.
From Table 1 it can be seen that there is very lim-
ited research which utilizes only publicly available so-
cial media data for identifying a different kind of so-
cial ties using tie strength and is almost nonexistent
in the case of professional events. Also, the introduc-
tion of data protection laws like the GDPR has further
restricted the use of private social media data. Thus
there is a need to have studies which can use the pub-
licly available social media data for tie strength eval-
uation.
This study differs from and builds on earlier stud-
ies by making use of publicly available social media
data about an event. We draw data from two differ-
ent social media platforms and use only the implicit
relationships inferred from the content of the publicly
available social media of an event.
2.3 Networking in Events
In recent years, social media has provided a new
way of networking with other people even in co-
located professional events like professional confer-
ences (Zhang et al., 2016). In such conferences, one
of the aims of the participants is to meet new people
who may share similar interests or may provide rele-
vant information (Reinhardt et al., 2009). This need
has resulted in a desire to build conference recom-
mendation systems which may provide relevant rec-
ommendations for the participants about which par-
ticipants to meet (Hornick and Tamayo, 2012).
In general, these systems have relied on giving
a recommendation based on certain keywords which
are usually extracted from the event participant’s reg-
istration form or some other provided details (Zhong
et al., 2015; Hornick and Tamayo, 2012). Recently
some studies have tried to incorporate other sources of
data like bibliographic data, co-occurrence data, par-
ticipant’s mobile device data and also data from sites
like epinions.com, Flickr to provide more relevant
KMIS 2019 - 11th International Conference on Knowledge Management and Information Systems
178

Table 1: Tie strength calculation in social media using public and private/closed data.
Paper Social Media Used Type of Data Sets Used Context/ Area of Study
Facebook Twitter Other Public Private/Closed
Aral and Walker (2014) X X Social Influence on Consumer Demand
Backstrom and Kleinberg (2013) X X Finding romantic relationships
Fogu
´
es et al. (2013) X X Privacy Assistance
Gilbert and Karahalios (2009) X Tie strength evaluation
Gilbert (2012) X X Tie strength evaluation
Kahanda and Neville (2009) X X Link Prediction
Petroczi et al. (2007) X X Measure tie strength in virtual communities
Wegge et al. (2015) X X Cyberagression on Social Network Sites
Xiang et al. (2010) X X X X Modelling relationship strength
Zhan Shi et al. (2014) X X Social Broadcasting
Hossmann et al. (2012) X X X Opportunistic Networks
Arnaboldi et al. (2013) X X Tie strength prediction
Servia-Rodr
´
ıguez et al. (2014) X X Socially enhanced applications
Pappalardo et al. (2012) X X X X Tie strength in multidimensional social networks
Quijano-S
´
anchez et al. (2014) X X Group movie recommender application
L. Fogues et al. (2018) X X Tie strength for photo sharing
recommendations (Zhang et al., 2016; Zhong et al.,
2015; Gupte and Eliassi-Rad, 2012). Data from so-
cial media platforms like Twitter has been used by the
conference organizers to gain better insight into the
conference and help in better planning for future con-
ferences (Aramo-Immonen et al., 2015). However,
there is limited research on the use of tie strength-
based recommendation systems (Zhong et al., 2015)
in case of a professional event like a conference. The
unavailability of explicit online relationship data and
private social media data restricts the use of previous
social media data based tie strength studies in the con-
text of professional events. The present exploratory
study uses publicly available social media data of a
professional event to create an implicit relationship
and evaluate the tie strength.
3 RESEARCH METHOD AND
APPROACH
In this section, we present a case study where so-
cial media data was collected for professional event
CMAD 2016. Along with the social media data, a
questionnaire was given to event participants to cap-
ture the individual’s perception of their actual tie
strength. The following subsections provide details
about the case description; followed by details about
the data collection process, and the final subsection
describes the different data analysis methods used in
this study.
3.1 Case Description
Our case study environment was community man-
agers’ online discussions in social media in connec-
tion to yearly- organized Community Manager Ap-
preciation Day (CMAD2016) event that took place on
January 25, 2016, in Jyv
¨
askyl
¨
a, Finland and had 270
event participants. The selection of case CMAD2016
was done because it satisfied the conditions suggested
by Yin (1994) for selecting a single-case design-based
case study. Case CMAD2016 was an extreme or
a unique case that was relevant for the overall goal
of this study which was to evaluate tie strength us-
ing publicly available social media data in a profes-
sional event. Firstly, CMAD2016 was a professional
event which has a majority of the event participants
belonging to the community of community managers
who can be considered as advanced lead users of so-
cial media and online community management ap-
proaches, with most of them being highly active in
social media (Aramo-Immonen et al., 2015, 2016).
Secondly, these event participants are not only active
on the social media in general but also use the social
media in the event CMAD2016 for various purposes
like networking and maintaining relationships (see
(Aramo-Immonen et al., 2015, 2016)). Thirdly, the
social media data related to event CMAD2016 is pub-
licly available which is essential to the main research
problem that this study addresses. Finally, based on
previous studies of community managers in Finland
(see (Aramo-Immonen et al., 2015, 2016)), we argue
that community managers communicate with each
other also between events, and have also participated
actively in planning the event, and assume that by col-
lecting data based on these community member’s dis-
cussions from Twitter and Facebook we can capture
sufficient and representative amount of data to draw
conclusions.
To be usefully able to do tie strength related anal-
ysis using social media discussion data in the con-
text of professional events, we created a list of some
major preconditions to enable the overall analysis of
this study: 1) a reasonably large number of partici-
pants must be present and active in social media in
an event; 2) despite the geographic co-location in an
Identifying Different Types of Social Ties in Events from Publicly Available Social Media Data
179

event, participants should still use social media to es-
tablish new ties or strengthen existing ties; 3) because
tie strength must be deduced from discussions only,
the motives of discussions in social media should be
more than just information sharing, ranging to main-
taining existing ties and creating new ties; 4) the car-
ried out discussions in social media should reflect net-
works and ties to a useful and sufficient extent, and
5) data related to tie strength dimensions and predic-
tors must be extractable to a useful extent from pub-
licly available social media data within an event. The
current literature finds support at least for precondi-
tions 2) (Zhang et al., 2016), as well as 3) and 4)
(Ahn and Park, 2015). Preconditions 1) and 5) can
be impacted by careful selection of case event to suit
the purpose. Though the above preconditions cannot
be extensively tested or proved within the limitations
of one individual case study, we also collected some
precondition- related data and demonstrate from the
collected and analyzed data that the above precondi-
tions were met to a useful extent.
3.2 Data Collection
Two different sources of data were used in this study.
One source was social media data (Facebook and
Twitter) while the other source was a questionnaire.
3.2.1 Social Media Data
The social media data for the event CMAD2016 was
collected from Twitter and Facebook. The detailed
corpus statistics for both Facebook and Twitter data
are given in Table 2 and Table 3 respectively.
Table 2: Facebook data corpus.
Content Attribute Value Actor Attribute Value
Time Period
Start: 2013-02-04
End : 2016-05-23
Total Actors 8798
Total Page Likes – Total Unique Actors 374
Posts 555 Unique Posters 81
Comments 2925 Unique Commenters 199
Comment Replies 149 Unique Comment Reply Actors 53
Likes on Posts 2529 Unique Wall Post Likers 327
Likes on Comments 2536 Unique Comment Likers 204
Likes on Comment Replies 104 Unique Comment Reply Likers 38
Full historic fetch of the two Facebook pages
(CMADFI 2014 & CMADFI 2015) from 01-01-2014
to 26-05-2016 was conducted using the Social Data
Analytics Tool (SODATO) (Hussain and Vatrapu,
2014; Hussain et al., 2014). SODATO enables the
systematic collection, storage, and retrieval of the
entire corpus of social data for Facebook walls and
groups. Twitter data was collected in two phases.
First, to list all tweets sent before, during, and after
CMAD2016, we accessed Flockler, a social media-
driven content management system that was used to
run the CMAD2016 website. Flockler provided a
web API to collect all tweets related to CMAD2016.
The Tweet Ids from Flockler data were used to access
the full set of Tweet data and metadata from Twitter
REST API using a tailored batch script. The batch
script exports tweet data in JSON for further process-
ing. For this study, the social media data from 1st
September 2015 to 30th April 2016 was used for per-
forming all the analysis.
Table 3: Twitter data corpus.
Content Attribute Value Actor Attribute Value
Time Period
Start: 2013-01-21
End : 2016-04-18
Total Users 12454
Total Tweets 12454 Total UniqueUsers 1651
Original Tweets 7568 Unique Original Tweet Users 858
Retweets 4886 Unique Retweet Users 1262
3.2.2 CMAD2016 Participant Questionnaire
Data
The second source of data was collected from the
event participants directly as this data provided us a
way to interpret the social media data against our the-
oretical framing. The questionnaire was developed by
adapting tie strength-scale by Petroczi et al. (2007)
based on the theoretical descriptions of strong ties by
Granovetter (1973). We wanted to capture the per-
ceptions of event participants on their strong ties and
possible weak ties from the event participants. We
excluded directly asking about weak ties as those are
higher in numbers (Granovetter, 1973) and are, there-
fore hard to recall by self- reported means. We devel-
oped the questionnaire shown in Table 4.
Questions 1 to 4 were framed to identify the strong
ties of the questionnaire respondents. Due to the prac-
tical problem of recalling names of questionnaire par-
ticipants, we limited the number of participant names
to five. Question 5 asked the participants to rate
the novelty of the information from three separate
groups of participants on a scale of 1-7. These three
groups were participants who questionnaire respon-
dent; knew well; met face to face but did not know
well; and not had face to face interaction with. Ques-
tion 5 was used to identify the different sources and
quality of the information in general. Question 6 fo-
cused on identifying novel information sources for in-
dividual questionnaire respondent. An online ques-
tionnaire link was shared to all the CMAD 2016 par-
ticipants through the CMAD Facebook group wall
and also by the official twitter handle of CMAD. The
survey was available in English and Finnish and was
based on the CMAD 2016 event only.
3.3 Data Processing and Analysis
To understand the temporal use of the social media
channels we performed temporal analysis of the so-
KMIS 2019 - 11th International Conference on Knowledge Management and Information Systems
180

Table 4: Questions from questionnaire.
Q1 Which 3 - 5 CMAD 2016 participants do you interact most frequently with ?
Q2 Which 3 - 5 CMAD 2016 participants would you most likely ask a personal favor from or return personal favor ?
Q3 Which 3 - 5 CMAD 2016 participants have you known the longest in professional context?
Q4 Which 3 -5 CMAD 2016 participants do you consider as your closest friend?
Q5
How novel (on an average) was the information, you received from the CMAD 2016 participants amongst the
following groups?
Q6 Which 3 - 5 CMAD 2016 participants do you consider as source of most novel information or ideas?
cial media data. Social network analysis was used to
create an implicit relationship network of event partic-
ipants based on the textual data of the publicly avail-
able social media data.
3.3.1 Temporal Analysis
We used data warehousing and on-line analyti-
cal processing (OLAP) technology using Microsoft
SQL Server database to conduct a temporal analy-
sis of Twitter and Facebook data. We designed a
multi-dimensional data model for Twitter and Face-
book data using interactions as numeric measures.
The interactions measure data was further processed
across several dimensions: temporal (daily, weekly,
monthly, and yearly), actions (post, comment, and
like in Facebook and tweets, retweets in Twitter) and
artifacts (posts, comments, tweets, and retweets).
3.3.2 Data Processing in Social Networks
Twitter and Facebook data, in general, allows straight-
forward analysis. In the case of Twitter, the used
REST API arranges the tweet data in a format that
is easy to process programmatically. This means that
the users (e.g. @menonkaran) and hashtags (e.g.
#cmadfi) are represented with an explicit syntax and
structure. In case of Facebook, posts, comments,
comment reply and likes were the entities used in the
analysis. A tailored Python script was implemented
to identify the above-mentioned entities in both Twit-
ter and Facebook data. The script further transformed
the refined data into two networks:
• The first network represents interconnections be-
tween people communicating over Twitter. More
specifically, with interconnections, we refer to
users mentioning each other in tweets through
comments and discussions.
• The second network shows interconnections be-
tween people communicating on Facebook. More
specifically, with interconnections, we refer to
users initiating Facebook posts, comments, and
comment replies as well as “Likes” to aforemen-
tioned Facebook entities.
The Python script uses NetworkX library (version
1.11) to construct the network and serialize it in Graph
Exchange XML Format or GEXF (version 1.2).
3.3.3 Social Network Analysis
Gephi, an interactive visualization and exploration
platform available in open source (Bastian et al.,
2009), was used to analyze and visualize the net-
works. Gephi was used to layout the networks, calcu-
late metrics for network nodes, analyze networks for
possible sub-networks (e.g. egocentric networks of
individual nodes) or clusters (Modularity Class met-
ric) calculated with Gephi’s implementation of the
community detection algorithm (Blondel et al., 2008)
and adjust the visual properties of the visualized net-
work according to the analysis. In this case, the eval-
uation of tie strength was done at the interpersonal
level (between the event participants) using commu-
nication frequency as a proxy for tie strength. The
weighted degree (sum of weighted indegree and out-
degree) and modularity class (clustering) were the
metrics that were of interest in the analysis. The lay-
out of the networks in this study was the result of a
force driven layout algorithm in which nodes repel
each other and the edges connecting the nodes act
as springs pulling the nodes back together (Blondel
et al., 2008). Hence, the nodes that are interconnected
will be placed close to each other.
4 FINDINGS
The descriptive analysis provided details about the
questionnaire and other results that support the pre-
conditions required to carry out this study. The tem-
poral analysis revealed the differences in the temporal
use of the two social media channels. The correla-
tional analysis helped in correlating the social media
data with the data gathered using the questionnaire.
4.1 Descriptive Analysis
In literature, Twitter use has been attributed to build-
ing or establishing new ties. This was found to be
true in case of events as well based on the Twit-
ter data about CMAD2016.Twitter was used not only
Identifying Different Types of Social Ties in Events from Publicly Available Social Media Data
181
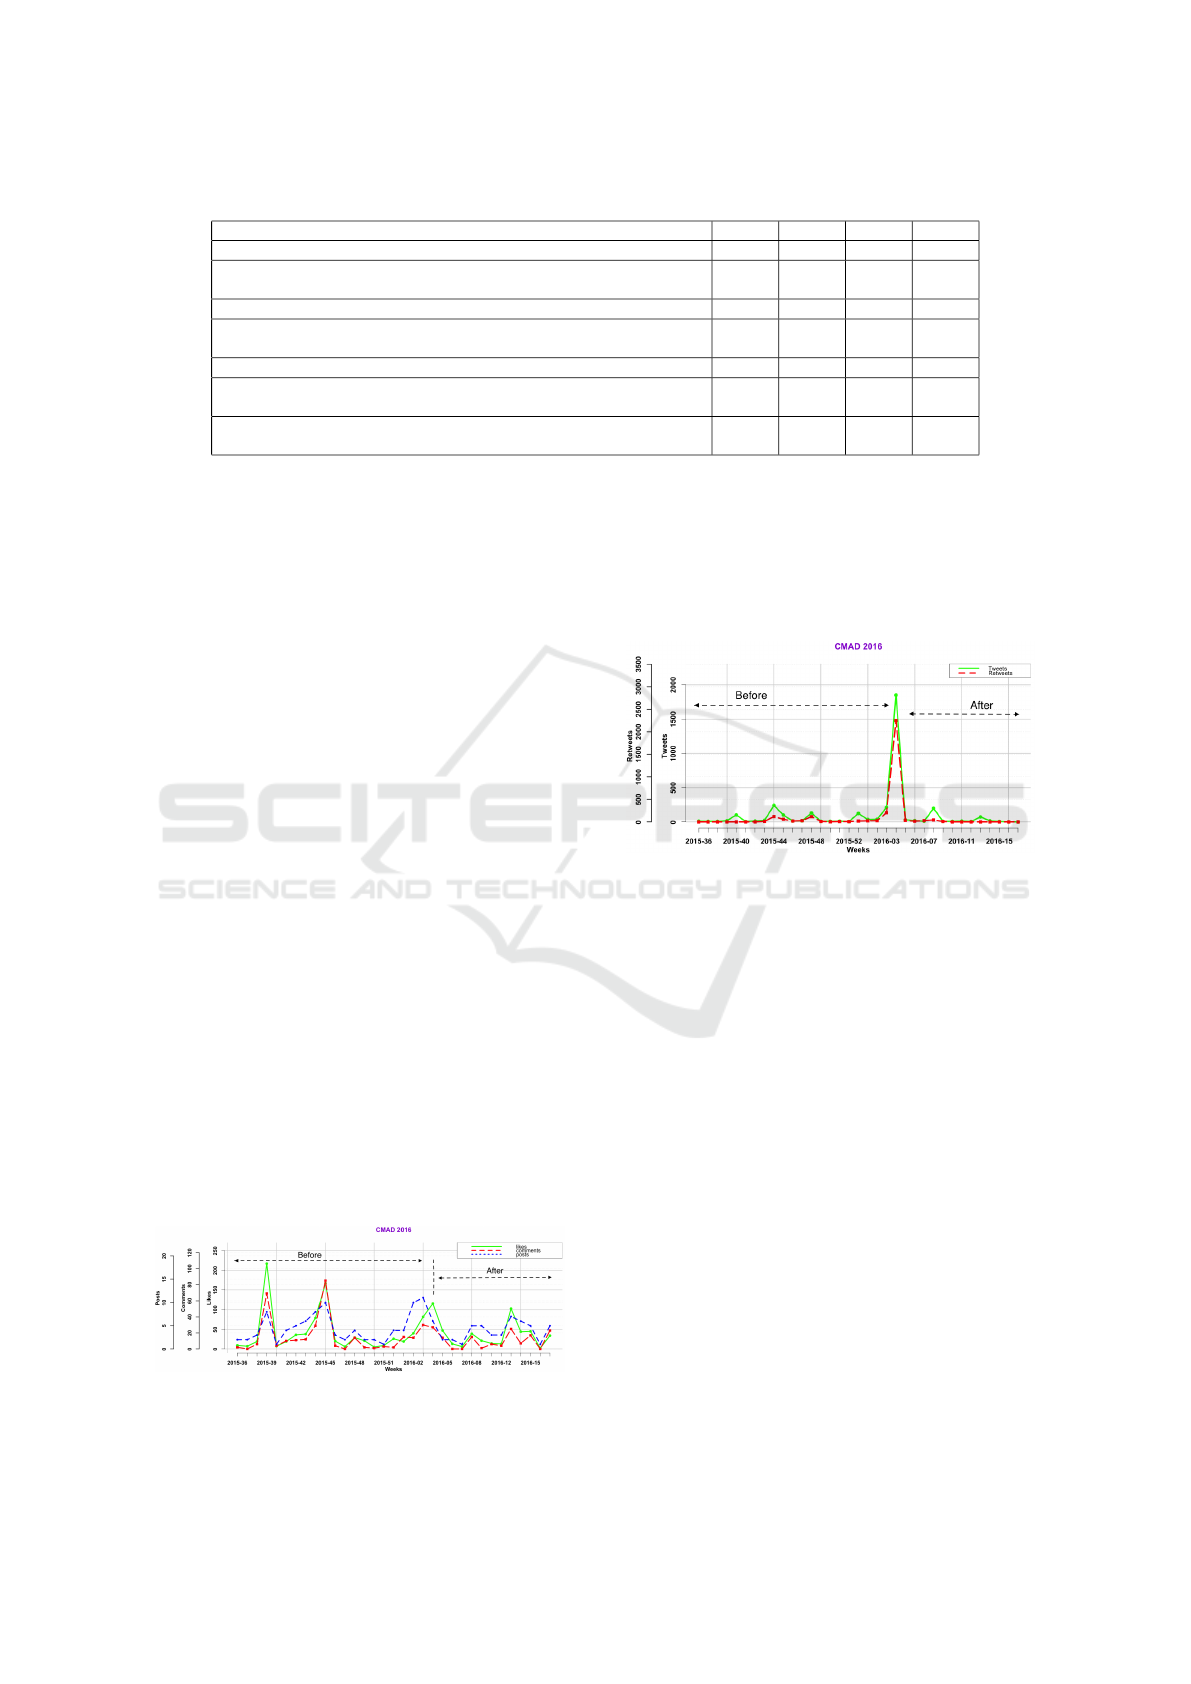
Table 5: Correlation between strong ties based on questionnaire and social media data.
Q1 Q2 Q3 Q4
Total number of names received from 24 questionnaire respondents 94 79 77 52
Total number of names identified using the Twitter top 10 list based
on weighted degree of each of the 24 questionnaire respondent
29 26 28 15
Accuracy in terms of percentage of names identified from Twitter
30.9% 32.9% 36.4% 28.8%
Total number of names identified using the Facebook top 10 list based
on weighted degree of each of the 24 questionnaire respondent
20 20 16 12
Accuracy in terms of percentage of names identified from Facebook
21.3% 25.3% 20.8% 23.1%
Total number of names received from 24 questionnaire respondents
not found in Twitter data
8 6 6 6
Total number of names received from 24 questionnaire respondents
not found in Facebook data
30 27 29 17
for information sharing but also to develop new ties
and strengthen existing ties. Some examples of these
kinds of tweets found in the CMAD2016 Twitter data
are given below. These tweets were originally writ-
ten in Finnish and have been translated. “Today
Jyv
¨
askyl
¨
a, some and #cmadfi. If you have networked
communication and WordPress in mind, please con-
tact melink ” is an example of a tweet to establish new
tie. “Have a great #cmadfi-day in Jyv
¨
askyl
¨
a These
ladies won’t be able to make it today in person, but
we will be there in spirit and will follow live tweets!
#yhteis
¨
omanagerit” is an example of a tweet related
to strengthening the existing ties.
From 270 CMAD2016 participants, 24 partici-
pants which included 16 female and 8 male belonging
to different Finnish cities and included both organiz-
ers (who were also participants) and event participants
answered the questionnaire. On Twitter 119 partic-
ipants had 10 or more conversations;134 participants
had 5 or more conversations, and 214 participants had
at least 1 conversation. On Facebook 30 participants
had 10 or more conversations; 49 participants had 5 or
more conversations, and 91 participants had at least
1 conversation. For question 5 in Table 4 related to
most novel information received by the questionnaire
respondents, the average rating (on a scale of 1 to 7)
for the the 3 different options were: 5.13 for had not
met face to face; 4.65 for had met face to face but did
not know well; and 4.00 for knew well.
4.2 Temporal Analysis of Social Media
Figure 1: Temporal distribution of CMAD’s Facebook
Data.
The social media activity of the event CMAD2016
was observed on both Facebook and Twitter from 1st
September 2015 to 30th April 2016. Fig. 1 shows
that there were more spikes in the number of com-
ments, posts and likes on CMAD2016 Facebook page
in weeks leading to the CMAD2016 event.
Figure 2: Temporal distribution of CMAD’s Twitter data.
Fig. 2 shows that there is only one large spike
in the number of tweets and retweets. This spike
in activity occurs during the week of the actual
CMAD2016 event.
4.3 Findings based on Questionnaire
Fig. 3 & 4 provides the visualization of the
CMAD2016 participant’s conversation on Facebook
and Twitter during the period of this study. The la-
beled nodes in the network graphs represent the ques-
tionnaire respondents (alphabetical letters A to X) and
their novel source of information as provided in the
response for question 6 in Table 4 (for example, re-
spondent is labeled as S while his/her novel informa-
tion sources are labeled as S1, S2, S3, and S4). The
interaction of the participants is made visible by con-
nections to other participants, more the interaction the
larger the size of the connection (line width in Fig. 3
& 4). The node color represents the cluster of nodes
in the network, according to a community-detection
algorithm that analyses the network to find a group of
nodes that are particularly tightly interconnected.
KMIS 2019 - 11th International Conference on Knowledge Management and Information Systems
182
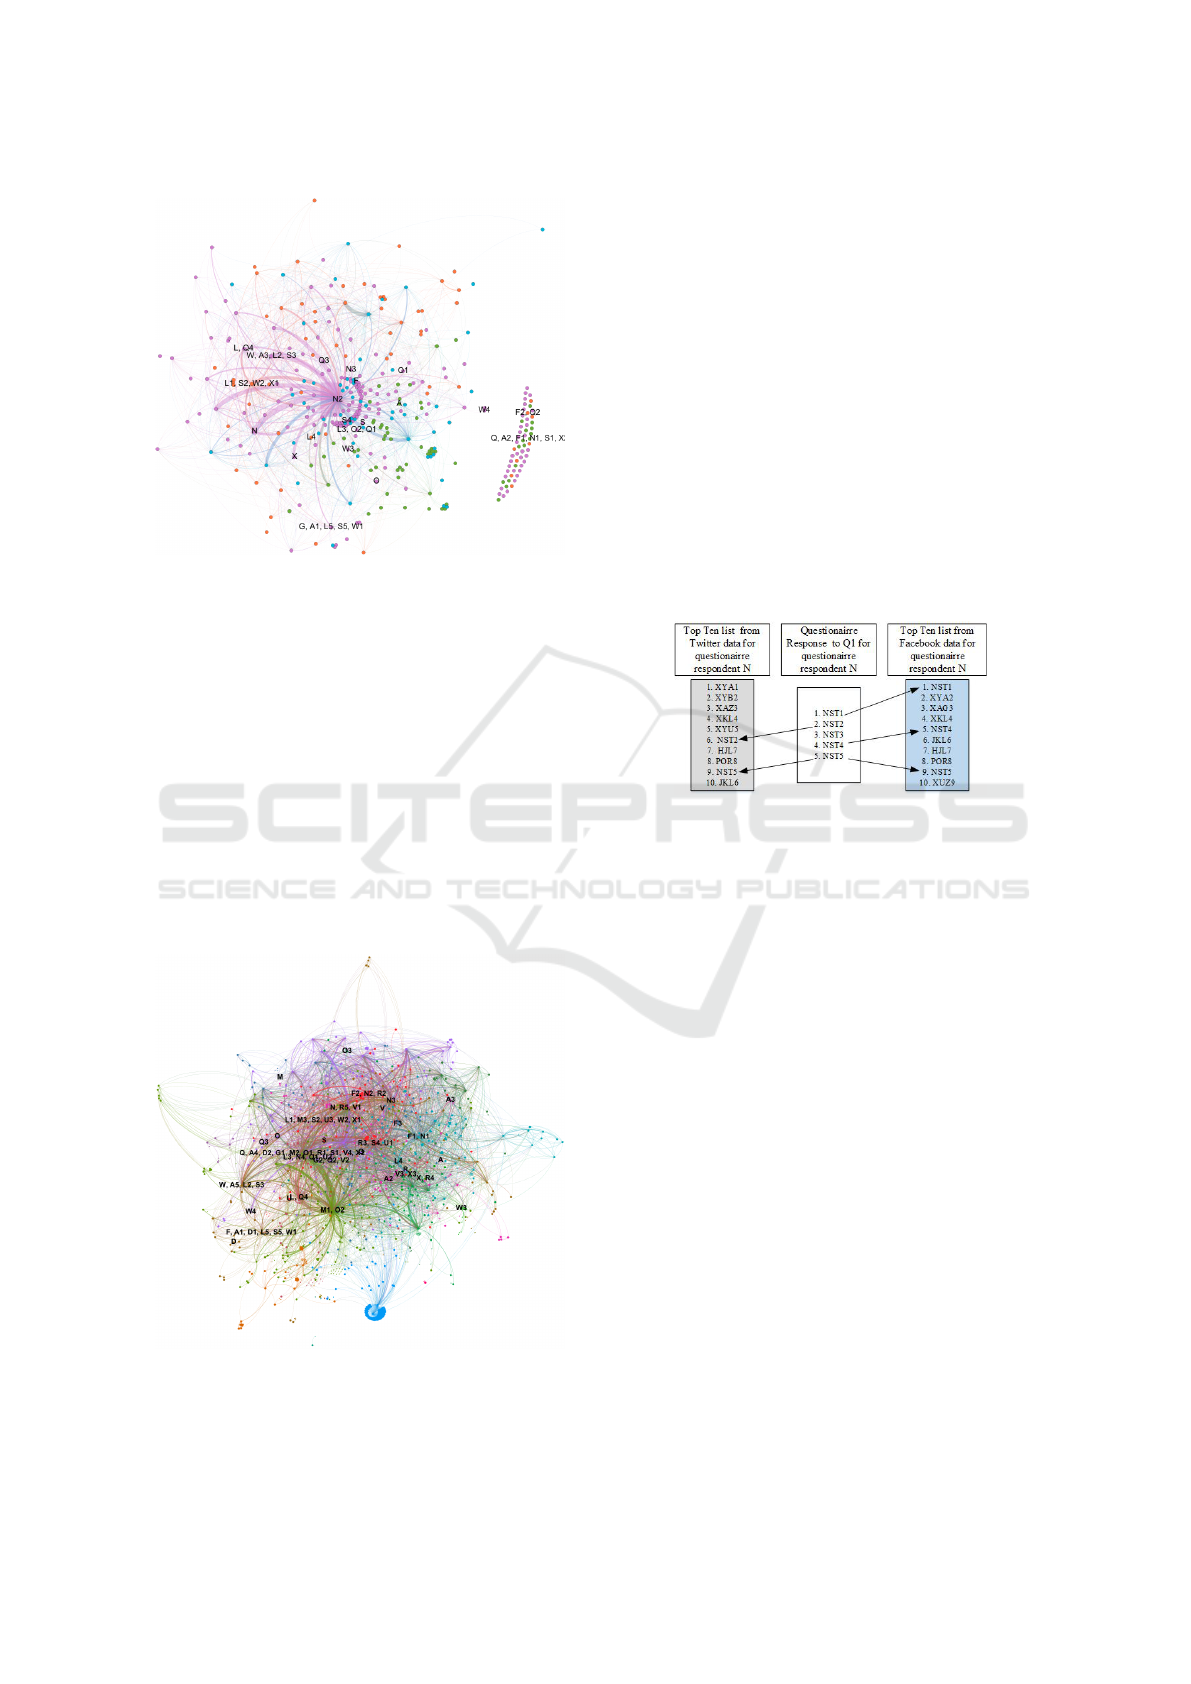
Figure 3: Force driven network of people(Facebook).
In the case of Twitter based network ( Fig. 4), 25
different clusters were identified. While in the case
of Facebook (Fig. 3) 4 different clusters were identi-
fied. On comparing the response of question 6 with
the Twitter and Facebook networks (Fig. 3 & 4), it
was observed that in the case of Twitter in 80% of
cases, the novel information source of the respondent
were participants who were in a different cluster than
the respondent. In the case of Facebook in 80% of the
cases, the novel information sources of the respon-
dent were participants who were in the same cluster.
It was also observed that a large proportion of the re-
spondent’s novel information source was not present
in the Facebook data but was present in the Twitter
data.
Figure 4: Force driven network of people (Twitter).
From Fig. 3, it was observed that in the case of
Facebook there was one central node through which
most of the other nodes were connected. Also, there
were few nodes in Facebook data which were not at
all connected. These nodes are people who had initi-
ated a post on the CMAD2016 Facebook page but did
not receive any reply for the post. In the case of Twit-
ter (Fig. 4) there was no single central node through
which all the other nodes were connected.
A list of top ten participants based on highest
weighted degree using the egocentric network of each
questionnaire respondent was created for every re-
spondent. The reason for selecting the top ten par-
ticipants was to accommodate for the noise in the
data while creating the conversation based weighted
degree-based list. This noise in our case was related
to the conversations about general event announce-
ments, logistics queries, and queries to the organizers,
which may not be related to strengthening or building
of ties.
Figure 5: Calculation logic for individual percentage match.
Two separate egocentric networks were created
using Facebook data and Twitter data. These two top
ten name lists based on Facebook and Twitter data
were then compared with the responses.
The logic about how this comparison was done is
shown in Fig. 5. For example, if respondent N an-
swered question 1 with five participants name, then
these names were compared with the names from the
top ten list from Twitter and from Facebook. The
number of names identified from the top ten list of
individual respondent for both Twitter and Facebook
data was then recorded. This process was carried out
for all the responses of every respondent. This aggre-
gated result is presented in Table 5. In Table 5, Q1,
Q2, Q3 and Q4 refers to question 1 to 4 of the ques-
tionnaire (Table 4). In Table 5, the first row of the
table provides the total number of names which were
received from the 24 respondents for each of the ques-
tions asked in the questionnaire. These names provide
the respondent’s perception of whom they consider as
their strong ties with respect to different dimensions
of tie strength. The second and third row provide the
total number of names that were identified from the
Twitter and Facebook data for each of the question.
The fourth and fifth row provides the total number of
names from the respondents that were not found in
Identifying Different Types of Social Ties in Events from Publicly Available Social Media Data
183

the Twitter and Facebook data for each of the ques-
tionnaire question.
5 DISCUSSION AND
CONCLUSIONS
This exploratory study, unlike the previous studies
which used explicit online relationship data and /or
private social media data of study participants, uses
the publicly available social media data about an event
to derive implicit online relationships and evaluate tie
strength. Since the analysis of this study was built
on a relatively small number of questionnaire respon-
dents and one individual case study community, we
provide the following propositions that strive to en-
hance the current understanding of the research ques-
tion of this study.
Proposition 1: The Purpose and Pattern of use of
a Particular Social Media Channel in an Event Im-
pact how Accurately the Ties can be Identified.
In our study, the temporal distribution of the so-
cial media data (Fig. 1 & 2) showed that Twitter was
used mainly during the day of the event CMAD2016,
while Facebook was used more before the start of the
event. Also, from the force driven network of people
(Fig. 3 & 4) it can be observed there was one ap-
parent central node in case of Facebook while there
was no central node in case of Twitter. A possible
data-driven explanation for these observations would
be that Facebook Page might have been used for plan-
ning the event while Twitter was used only during the
event for maintaining ties or building new ones. This
preliminary explanation is also supported by the sam-
ple tweets that were provided in the descriptive analy-
sis of the tweets. Academically, this is novel because
when you rely on publicly available social media data,
then it is essential to understand the purpose and pat-
tern of the use of social media channels. Since in
this case, the content of the textual data is the only
source for deriving the implicit relationships. This
is because, in an event, different social media chan-
nels may be used for very different purposes. If this
aspect is not taken into consideration while deciding
on which social media channel should be selected for
evaluating tie strength, then selection of wrong so-
cial media channel would result in totally irrelevant
tie strength estimation.
Proposition 2: Structure of the Implicit Social
Network can Reveal the Possible Weak Ties, Provided
that the Selected Social Media Channel is used for
Maintaining and Building Ties.
Based on the response to questionnaire question
6 (Table 4) and the force driven network of people
based on tweets (Fig. 4), 80% of questionnaire re-
spondents belong to a different cluster than the peo-
ple who are their novel sources of information. Also,
these novel sources of information were connected
to a large number of event participants from differ-
ent clusters (Fig. 4). From the literature, we know
that weak ties are a source of novel information and
act as a bridge between diverse people (Granovetter,
1973). Hence, the above empirical findings together
with existing literature, provide support to the propo-
sition 2 statement. This proposition is academically
novel because previous studies have only used explicit
online relationship data from social media to create a
relationship network which was then used to identify
different ties (e.g. Backstrom and Kleinberg (2013)).
However, in this study only implicit relationships de-
rived from the communication of the event partici-
pants over social media was used. Such kind of data is
easily accessible in case of an event while explicit re-
lationship data is almost impossible to access in case
of an event. In practice validation of this proposition
in the future will lead to a new method for identify-
ing weak ties and would be highly relevant in building
collaboration tools like tie strength-based conference-
related social recommendation systems.
Proposition 3: Weighted Degree from Implicit Re-
lations from Social Media Data can Correlate with
Tie Strength, Especially the Strong Ties, Provided that
the Selected Social Media Channel is used for Main-
taining and Building Relationships.
In our study, we found preliminary evidence to
support this proposition. From Table 5 we were able
to identify questionnaire participants perceived strong
ties with an accuracy of about 30% in case of Twitter
data and about 20% in case of Facebook data. This ac-
curacy in predicting the perceived strong ties is good
because the identification of the strong ties was done
only using the content of the social media. No other
explicit relationship data from the social media was
used in order to either identify the existence of the tie
nor for the specific identification of strong ties. Only
the network parameter of weighted degree calculated
from the implicit network derived from the content of
the social media was used. The result of this analysis
is given in Table 5. This provides preliminary empir-
ical evidence for this proposition. Academically this
proposition is novel because the existing related stud-
ies (e.g. Ahn and Park (2015); Gilbert and Karahalios
(2009); Aral and Walker (2014)) have used measures
which are either based on the explicit online relation-
ships and/or private social media data. However, in
this study, the measure used for tie strength evalu-
ation was based on publicly available social media
data. This aspect is of practical relevance because, in
KMIS 2019 - 11th International Conference on Knowledge Management and Information Systems
184

most events, it is very difficult to access the explicit
online relationship data or private data of participants
from social media. However, it is relatively easy to
collect data like actual textual content (e.g. Tweets
in case of Twitter, Text from open Facebook pages in
case of Facebook) related to the event. Hence, mea-
sures, which can evaluate tie strength from this kind
of social media data, will be useful while developing
tie strength-based conference recommender systems.
5.1 Managerial Implications
Based on the above propositions, the following man-
agerial implications should be considered. First, it is
essential to identify the purpose and pattern of use
of the social media channel in an event before using
it for tie strength calculation. Second, the structure
identified from the social media content (i.e. implicit
network) can be used to identify the event partici-
pants who connect the different discussion topic clus-
ters, can thus be considered as potential weak ties.
This implication would be relevant to consider for the
event organizers and also the conference recommen-
dation system designers as it will help the organizers
to identify the most diverse and networked event par-
ticipants. Finally, event organizers should consider
using some kind of standardization of social media
keywords for different discussion topics (e.g. Use of
certain # for specific topics) across different social
media channels. This will be useful for the event orga-
nizers to find the most relevant topics for the event in
general. For the event participants, this will be help-
ful to find the other potential event participants to net-
work or collaborate with.
5.2 Limitations
The study presented in this paper has certain limita-
tions. First, in this study, we studied only some poten-
tial approaches related to the calculating tie strength.
Second, due to the limited number of respondents
in our questionnaire used to confirming the evalu-
ated ties and tie strength from social media data; we
were unable to draw any statistically significant re-
sults. The current study is based on a single case-
based case study; thus, the results, in general cannot
be directly generalized to apply to all other confer-
ences and were presented as propositions.
5.3 Future Work
This study leaves room for future studies in many ar-
eas. First, all propositions of this study should be
tested and validated in future studies and in differ-
ent types of events, to allow further generalization.
Second, there are many dimensions and measures for
tie strength, in future studies, we will use more mea-
sures to evaluate tie strength in an event context. Fi-
nally, incorporating big social data (e.g. large col-
lection of Twitter data and public Facebook walls
of events) with other data sources like bibliographic
data, location data may enable developing automated
tie strength evaluation methods in case of events.
REFERENCES
Ahn, H. and Park, J. H. (2015). The structural effects of
sharing function on Twitter networks: Focusing on
the retweet function. Journal of Information Science,
41(3):354–365.
Aral, S. and Walker, D. (2014). Tie Strength, Embedded-
ness, and Social Influence: A Large-Scale Networked
Experiment. Management Science, 60(6):1352–1370.
Aramo-Immonen, H., Jussila, J., and Huhtam
¨
aki, J. (2015).
Exploring co-learning behavior of conference partic-
ipants with visual network analysis of Twitter data.
Computers in Human Behavior, 51:1154–1162.
Aramo-Immonen, H., K
¨
arkk
¨
ainen, H., Jussila, J. J., Joel-
Edgar, S., and Huhtam
¨
aki, J. (2016). Visualizing
informal learning behavior from conference partici-
pants’ Twitter data with the Ostinato Model. Com-
puters in Human Behavior, 55:584–595.
Arnaboldi, V., Guazzini, A., and Passarella, A. (2013). Ego-
centric online social networks: Analysis of key fea-
tures and prediction of tie strength in Facebook. Com-
puter Communications, 36(10-11):1130–1144.
Backstrom, L. and Kleinberg, J. (2013). Romantic Part-
nerships and the Dispersion of Social Ties: A Net-
work Analysis of Relationship Status on Facebook.
CSCW’14, pages 831–841.
Bastian, M., Heymann, S., and Jacomy, M. (2009). Gephi:
An Open Source Software for Exploring and Manipu-
lating Networks. ICWSM 2009, pages 361–362.
Blondel, V. D., Guillaume, J. L., Lambiotte, R., and Lefeb-
vre, E. (2008). Fast unfolding of communities in large
networks. Journal of Statistical Mechanics: Theory
and Experiment, 2008(10):P10008.
Fogu
´
es, R. L., Such, J. M., Espinosa, A., and Garcia-Fornes,
A. (2013). BFF: A tool for eliciting tie strength and
user communities in social networking services. In-
formation Systems Frontiers, 16(2):225–237.
Gilbert, E. (2012). Predicting tie strength in a new medium.
In Proceedings of the ACM 2012 Conference on Com-
puter Supported Cooperative Work, CSCW ’12, pages
1047–1056, New York, NY, USA. ACM.
Gilbert, E. and Karahalios, K. (2009). Predicting tie
strength with social media. In CHI 09, page 211.
ACM.
Granovetter (1973). The strength of weak ties. Americal
Journal of Sociology, 78(6):1360.
Identifying Different Types of Social Ties in Events from Publicly Available Social Media Data
185

Gupta, J. P., Menon, K., K
¨
arkk
¨
ainen, H., Huhtam
¨
aki, J.,
Mukkamala, R. R., Hussain, A., Vatrapu, R., Jussila,
J., and Pirkkalainen, H. (2016). Identifying Weak
Ties from Publicly Available Social Media Data in an
Event. In AcademicMindtrek ’16, pages 11–19. ACM.
Gupte, M. and Eliassi-Rad, T. (2012). Measuring tie
strength in implicit social networks. In WebSci’12,
pages 109–118. ACM.
Hornick, M. F. and Tamayo, P. (2012). Extending rec-
ommender systems for disjoint user/item sets: The
conference recommendation problem. IEEE TKDE,
24(8):1478–1490.
Hossmann, T., Nomikos, G., Spyropoulos, T., and Leg-
endre, F. (2012). Collection and analysis of
multi-dimensional network data for opportunistic
networking research. Computer Communications,
35(13):1613–1625.
Huang, H., Tang, J., Liu, L., Luo, J., and Fu, X. (2015). Tri-
adic Closure Pattern Analysis and Prediction in Social
Networks. IEEE TKDE, 27(12):3374–3389.
Hussain, A. and Vatrapu, R. (2014). Social Data Analytics
Tool (SODATO). In Lecture Notes in Computer Sci-
ence, volume 8463 LNCS, pages 368–372. Springer.
Hussain, A., Vatrapu, R., Hardt, D., and Jaffari, Z. A.
(2014). Social Data Analytics Tool: A Demonstrative
Case Study of Methodology and Software. In Ana-
lyzing Social Media Data and Web Networks, pages
99–118. Palgrave Macmillan UK, London.
Kahanda, I. and Neville, J. (2009). Using transactional in-
formation to predict link strength in online social net-
works. ICWSM09, pages 74–81.
L. Fogues, R., Such, J. M., Espinosa, A., and Garcia-Fornes,
A. (2018). Tie and tag: A study of tie strength and tags
for photo sharing. PLOS ONE, 13(8):e0202540.
Levin, D. Z. and Cross, R. (2004). The Strength of Weak
Ties You Can Trust: The Mediating Role of Trust in
Effective Knowledge Transfer. Management Science,
50(11):1477–1490.
Marsden, P. V. and Campbell, K. E. (1984). Measuring tie
strength. Social Forces, 63(2):482–501.
Marsden, P. V. and Campbell, K. E. (2012). Reflections on
Conceptualizing and Measuring Tie Strength. Social
Forces, 91(1):17–23.
Onnela, J.-P., Saram
¨
aki, J., Hyv
¨
onen, J., Szab
´
o, G., Lazer,
D., Kaski, K., Kert
´
esz, J., and Barab
´
asi, A.-L. (2007).
Structure and tie strengths in mobile communication
networks. PNAS, 104(18):7332–6.
Pappalardo, L., Rossetti, G., and Pedreschi, D. (2012). How
well do we know each other? : Detecting tie strength
in multidimensional social networks. In ASONAM
2012, pages 1040–1045. IEEE.
Petroczi, A., Bazs
´
o, F., and Nepusz, T. (2007). Measuring
tie-strength in virtual social networks. Connections,
27(2):39–52.
Quijano-S
´
anchez, L., D
´
ıaz-Agudo, B., and Recio-Garc
´
ıa,
J. A. (2014). Development of a group recommender
application in a Social Network. Knowledge-Based
Systems, 71:72–85.
Reinhardt, W., Ebner, M., and Beham, G. (2009). How peo-
ple are using Twitter during conferences. In EduMedia
conference, p. 145-156, Salzburg, pages 145–156.
Ross, C., Terras, C., Warwick, M., and Welsh, A.
(2011). Enabled Backchannel: Conference Twitter
use by Digital Humanists. Journal of Documentation,
67(2):214–237.
Servia-Rodr
´
ıguez, S., D
´
ıaz-Redondo, R. P., Fern
´
andez-
Vilas, A., Blanco-Fern
´
andez, Y., and Pazos-Arias,
J. J. (2014). A tie strength based model to socially-
enhance applications and its enabling implementation:
mySocialSphere. Expert Systems with Applications,
41(5):2582–2594.
Wegge, D., Vandebosch, H., Eggermont, S., and Walrave,
M. (2015). The Strong, the Weak, and the Unbalanced
The Link Between Tie Strength and Cyberaggression
on a Social Network Site. Social Science Computer
Review, 33(3):315–342.
Wiese, J., Min, J.-K., Hong, J. I., and Zimmerman, J.
(2015). You Never Call, You Never Write. In
CSCW’15, pages 765–774. ACM.
Xiang, R., Neville, J., and Rogati, M. (2010). Modeling re-
lationship strength in online social networks. In WWW
’10, page 981.
Yin, R. K. (1994). Case study research. Design and Meth-
ods. Evaluation & Research in Education, 24(3):221–
222.
Zhan Shi, Huaxia Rui, and Whinston, A. B. (2014). Content
Sharing in a Social Broadcasting Environment: Evi-
dence from Twitter. MIS Quarterly, 38(1):123–A6.
Zhang, A., Bhardwaj, A., and Karger, D. (2016). Confer:
A Conference Recommendation and Meetup Tool. In
CSCW’16, pages 118–121. ACM.
Zhang, B., K
¨
arkk
¨
ainen, H., Gupta, J. P., and Menon, K.
(2017). The role of weak ties in enhancing knowledge
work. In AcademicMindtrek ’17, pages 210–215, New
York, New York, USA. ACM Press.
Zhong, Y., Yang, J., and Nugroho, R. (2015). Incorporating
Tie Strength in Robust Social Recommendation. In
BigData Congress 2015, pages 63–70. IEEE.
KMIS 2019 - 11th International Conference on Knowledge Management and Information Systems
186
