
A Real-time Vital Data Collection System for a Group of Persons during
a Variety of Sporting Activities in a Large Outdoor Ground
Shinsuke Hara
1
, Takunori Shimazaki
1
, Takuma Hamagami
2
, Yasutaka Kawamoto
2
, Hiroyuki Yomo
3
,
Ryusuke Miyamoto
4
, Hiroyuki Okuhata
5
and Fumie Ono
6
1
Graduate School of Engineering, Osaka City University, Sugimoto-Cho, Osaka-Shi, Osaka, Japan
2
Oki Electric Industry Co., Ltd., Bingo-Machi, Osaka-Shi, Japan
3
Graduate School of Science Engineering, Kansai University, Yamate-Cho, Suita-Shi, Osaka, Japan
4
School of Science and Technology, Meiji University, Higashi-Mita, Kawasaki-Shi, Kanagawa, Japan
5
Soliton Systems K.K., Kakuda-Cho, Osaka-Shi, Osaka, Japan
6
Wireless Networks Research Center, National Institute of Information and Communications Technology, Hikarino-Oka,
Yokosuka-Shi, Kanagawa, Japan
yomo@kansai-u.ac.jp, miya@cs.meiji.ac.jp, hiroyuki.okuhata@soliton.co.jp, fumie@nict.go.jp
Keywords:
Real-time Vital Data Collection, Heart Rate, VO2, Location, Wireless Multi-hop Networking, A Variety of
Sports Activities, A Group of Persons, A Large Outdoor Ground.
Abstract:
We have been developing a wireless vital data collection system named “AccuWiSe,” which is workable for
a group of persons during a variety of sporting activities in a large outdoor ground in real-time and reliably.
Using the second-prototype system, we have conducted an experiment on the 6th of March 2019, where
involving 50 subjects, we have successfully collected vital data from 18 subjects making a variety of sporting
activities in a sports ground with size of 60m×90m, in data collection rate of 94.9%, once in 2sec regularly,
and for 45min continuously. This paper introduces AccuWiSe and demonstrates the experimental results.
1 INTRODUCTION
Reliable and real-time vital signs monitoring is re-
quired to promote health and prevent disease/injury
for persons during sporting activity. For professional
and amateur athletes, it can be also used for evidence-
based physical training to improvetheir performances
and identify their talents. We have been develop-
ing a real-time vital signs monitoring system for a
group of persons during a variety of sporting activi-
ties in a large outdoor ground and have named it “Ac-
curate Wireless vital Sensing system (AccuWiSe).”
In the development of AccuWiSe, using the first-
prototype wireless vital sensor nodes (VSNs) and de-
signed wireless networking protocol, we conducted
an experiment on the 26th of February 2018 (Ham-
agami et al., 2018), where at a data collection node
(DCN), we collected the data
• of heart rate (HR), VO2, bodysurface temperature
and humidity, and air temperature and humidity,
• from wireless vital sensor nodes (VSNs) put to the
forearms of 22 footballers,
• once in 1 sec during 4×15min football matches,
• in an outdoor football field of 55m×90m,
• using the wireless communication tool with data
rate of 100kbps and transmission power of 20mW
in the 920MHz band,
• in data collection rate of 97.9%.
The experiment was very successful, but it had
three major drawbacks; the first-prototypeVSNs were
large, the networking protocol was able to accommo-
date only up to 25 VSNs, and the performance was
evaluated only in a single exercise of football match
where footballers are likely to randomly spread in the
entire ground. According to the feedback and re-
flection on the system development and the method
of performance evaluation, we have developed the
second-prototype system and have conducted an ex-
periment on the 6th of March 2019.
In this paper, we introduce AccuWise focusing on
its wireless networking technique and show the latest
experimental results using its second-prototype sys-
tem.
138
Hara, S., Shimazaki, T., Hamagami, T., Kawamoto, Y., Yomo, H., Miyamoto, R., Okuhata, H. and Ono, F.
A Real-time Vital Data Collection System for a Group of Persons during a Variety of Sporting Activities in a Large Outdoor Ground.
DOI: 10.5220/0008066401380145
In Proceedings of the 7th International Conference on Sport Sciences Research and Technology Support (icSPORTS 2019), pages 138-145
ISBN: 978-989-758-383-4
Copyright
c
2019 by SCITEPRESS – Science and Technology Publications, Lda. All rights reserved
This paper is organized as follows. Section 2
explains the reason to select the 920MHz band and
outlines our multi-hop networking protocol in Ac-
cuWiSe. Section 3 shows the specifications of the
second-prototype system, focusing on its difference
from the first-prototype system. Section 4 demon-
strates and discusses the experimental results. Finally,
Section 5 concludes the paper.
2 WIRELESS NETWORKING
TECHNIQUE
2.1 Selection of Frequency Band
We conducted an experiment on real-time vital data
collection for 22 footballers during a match in an out-
door football ground (Hara et al., 2013). The main
purpose of the experiment was to compare the per-
formance between wireless communication tools in
the 920MHz and 2.4GHz bands, so we implemented
VSNs which can transmit vital data with the same
packet length in the same timings in both frequency
bands, where the wireless communication tools were
compliant with the ARIB STD-T108 (ARIB, 2011)
and the IEEE 802.15.4 standard (IEEE, 2015) with
transmission powers of 20mW and 10mW in the
920MHz and 2.4GHz bands, respectively.
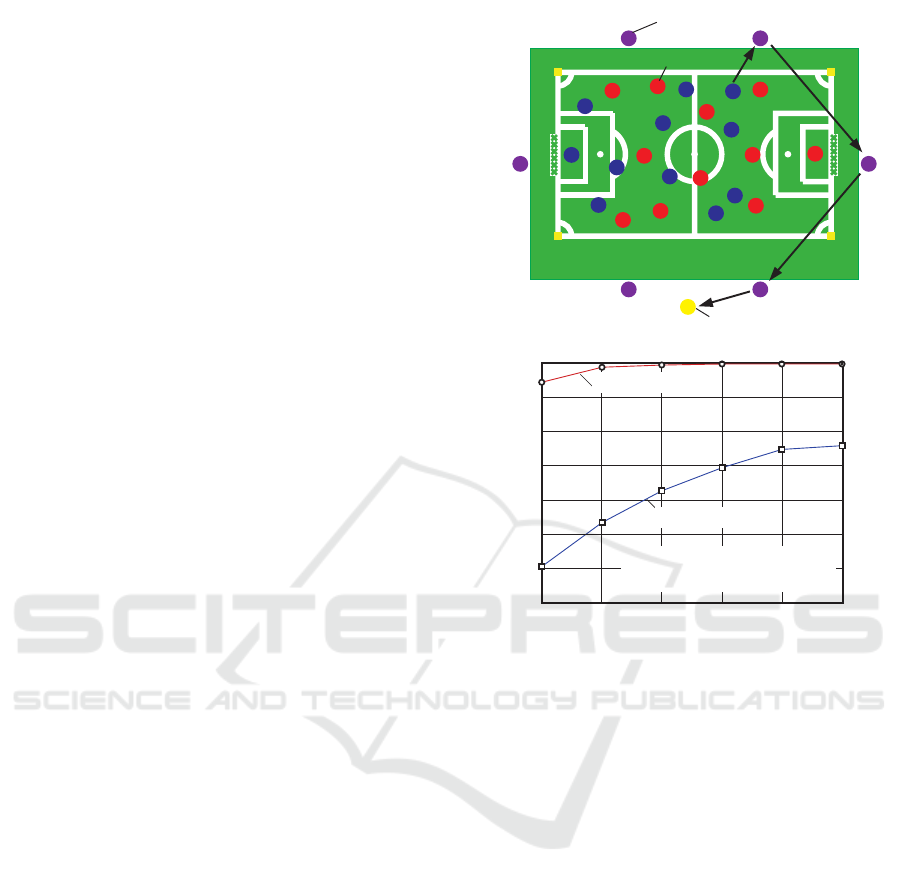
As shown in Figure 1 (a), we put the VSNs to the
back waist positions of all footballers and also placed
6 data forwarding nodes (DFNs) around the ground.
The VSNs broadcast their own sensed data to the
DFNs once in 10 sec and the DFNs forwarded their
received data to a single data collection node (DCN)
directly or through other DFNs. Figure 1 (b) shows
the performanceon the packet success rate obtainedin
the experiment. For the wireless communication tool
in the 2.4GHz band, even when using 6 DFNs around
the ground, the packet loss rate cannot be more than
than 75%, on the other hand, for the wireless commu-
nication tool in the 920MHz band, when using 1 or
2 DFNs around the ground, the packet loss rate can
be more than 95%. This is because the signal in the
920MHz band has a longer transmittable range and
is less vulnerable to fading and blocking by human
body.
Based on the experimental result, we decided
to select the wireless communication tool in the
920MHz band as the one suitable for the real-time
vital data collection from a group of persons spread
in a large outdoor ground. Note that some real-
time vital data collection systems have been com-
mercially available in the market, but they operate in
2 3
1
11
10
9
8
7
6
5
4
3
1
11
10
9
8
7
6
5
4
3
2
1
Vital sensor node
Data collection node
2
4
56
D
Data forwarding node
(a) Layout
(b) Performance
1 2 3 4 5 6
Number of data forwarding nodes
100
90
80
70
60
50
40
30
Packet success rate [%]
920 MHz band
2.4 GHz band
Antenna height of
data forwarding node
=1m
Figure 1: Layout and performance for the broadcast/
forward-based vital data collection.
the 2.4GHz industrial, scientific and medical (ISM)
band such as WiFi (https://www.wi-fi.org/), Bluetooth
(https://www.bluetooth.com/) or Bluetooth Low En-
ergy (https://www.bluetooth.com/). We imagine that
a lot of packet losses would occur in them so the lost
data might be replaced by the ones previously suc-
cessfully received, but physical or technical trainers
could not notice the fact.
2.2 Multihop Networking Protocol
We decided to use the wireless communication tool
in the 920MHz, but when exercisers, namely, VSNs,
spread in a large ground, it cannot directly connect
them to a DCN, even though it has a longer transmit-
table range and less vulnerability against fading and
blocking. One approach could be to place DFNs or
relay nodes in the ground, but through the experiment,
we noticed it is troublesome; there is often something
wrong with DFN and we need to replace the battery
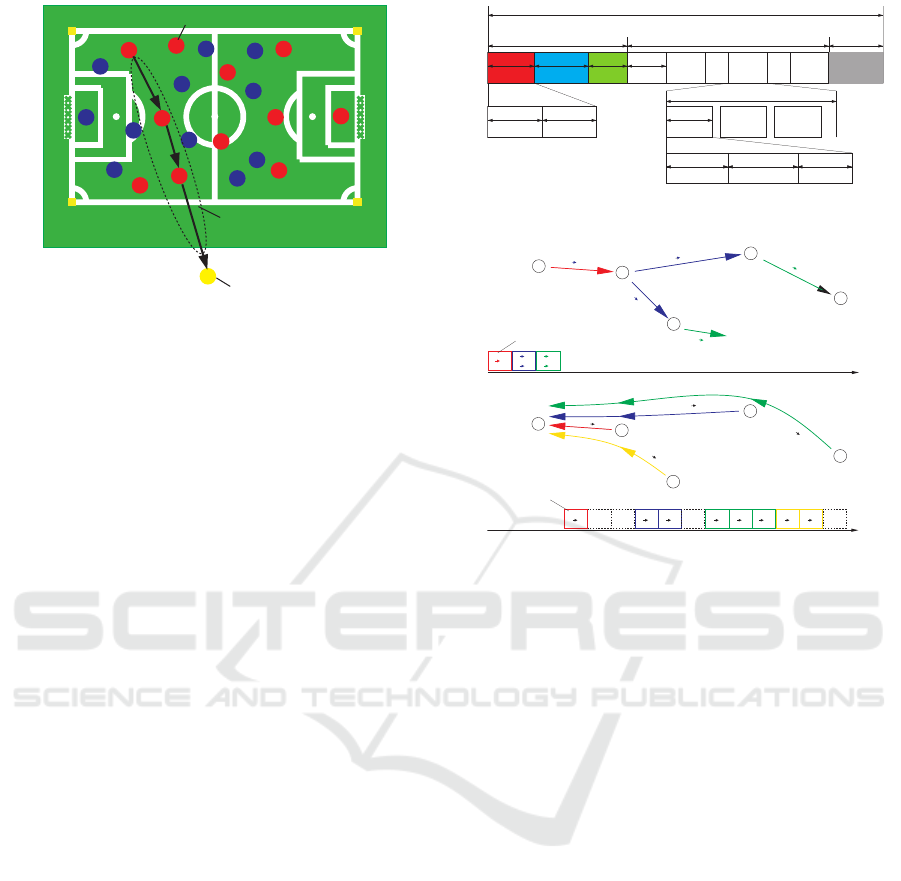
of DFN. Therefore, as shown in Figure 2, we took an
approach of multihop data collection through VSNs.
A Real-time Vital Data Collection System for a Group of Persons during a Variety of Sporting Activities in a Large Outdoor Ground
139
11
10
9
8
7
6
5
4
3
1
11
10
9
8
7
6
5
4
3
2
1
Vital sensor node
Data collection node
2
D
Data collection route
Figure 2: Multihop data collection through VSNs.
We evaluated some ready-made multihop net-
working protocols such as Ad hoc On-Demand Dis-
tance Vector (AODV) (Perkins, Belding-Royer, &
Das, 2003), but the experimental packet success rate
was terribly low. According to the AODV, VSNs
always exchange control packets to discover their
neighbors and update their routing tables. When a
VSN generates or receives a packet to transmit for a
DCN, the VSN forwards the packet to its parent VSN
according to its own routing table. When VSNs are
stationary, the AODV works well, but when they are
in motion, in other words, the network topology is dy-
namically changing, the AODV does not work well,
since when a VSN generates or receives a packet to
transmit, its routing table has been already old and
invalid. Therefore, we decided to design a multihop
network protocol valid for our application.
We designed a flooding/time division multiple ac-
cess (TDMA) protocol (Hamagami et al., 2018), the
principle of which is a superframe-by-superframeDy-
namic Source Routing (DSR) (Johnson, Hu, & Malts,
2007). According to the flooding/TDMA protocol,
the system operates on two stages such as “pairing
stage” and “collection stage.”
The pairing stage starts when the switches of the
VSNs are on. Each VSN tries to transmit a pairing
request packet to a DCN, and when the DCN success-
fully receives the packet, the DCN transmits a pairing
reply packet to the VSN, assigning an identifier num-
ber (ID) to it. In the first-prototype system, an distinct
ID, which corresponds to the TDMA time slot ID, is
assigned to each VSN. Therefore, as explained later,
any VSN can freely and solely begin to transmit its
data frame in its assigned TDMA time slot as its “slot
owner.” When all the VSNs have received their pair-
ing reply packets, network association completes.
Figure 3 shows the superframe structure of the
flooding/TDMA protocol used in the collection stage,
which is composed of a flooding period and a data
Flooding period Data collection period
150msec
2.96msec 77.04msec 70msec
Slot 1 Slot 2 Slot 3 Slot 1
33msec
Slot 2
...
Slot m
...
Slot 22
726msec
1,000msec
Inactive period
Superframe
124msec
7.36msec
Frame 1 Frame 2 Frame 3
33msec
2.80msec 0.16msec
Header CRC bits
3.04msec 4.16msec 0.16msec
Header Payload CRC bits
Beacon
Figure 3: Structure of the superframe.
1 (2)
1 (4)
D (1)
2 (3)
4
Time
2 1 1 D 3 2 2 1 1 D 4 1 1 D1 D
Uplink timeslot 1 Uplink timeslot 2 Uplink timeslot 3 Uplink timeslot 4
DCN
VSN 1
VSN 2
VSN 4
VSN 3
1 (2)
1 (4)
D (1)
2 (3)
4
(a) Flooding period
Time
DCN
VSN 1
VSN 2
VSN 4
VSN 3
2 1
4 1
1 D
3 2
(b) Data collection period
TX node attributes
Hop count
CSMA period
TX node attributes
Data and data size
Figure 4: Operation of flooding and data collection.
collection period. The role of the former is to select a
suitable parent VSN for each VSN whereas that of the
latter is to forward a data frame from each VSN to the
DCN through other VSNs without frame collisions.
Here, taking into consideration of the ground size and
transmittable range of VSN, we limit the number of
hops to 3 in the time slot for each VSN.
The communication among the DCN and VSNs is
divided into a series of superframes, and the collec-
tion stage starts when the DCN broadcasts a beacon.
In the flooding period, only the DCN can initiate the
transmission of a beacon. When any VSN receives
a beacon broadcast by the DCN or another VSN, it
re-broadcasts a beacon showing its own node ID and
its own hop count in the beacon. In addition, when
any VSN receives multiple beacons from other VSNs
within a certain period, it measures the receivedsignal
strength (RSS) for each received beacon, and it mem-
orizes the node ID which gives the largest RSS as its
parent VSN. This is the reason why the second and
third slots are longer than the first slot. The maximum
number of hops is set to three in the the first-prototype
system, so the flooding period is divided into three
time slots.
In the data collection period, each TDMA time
slot has been assigned to a distinct VSN as its slot
owner in the pairing stage, so any VSN can initiate its
data frame transmission in its assigned slot. In addi-
icSPORTS 2019 - 7th International Conference on Sport Sciences Research and Technology Support
140
tion, when a VSN receives a data frame, it unicasts
the frame to its parent node.
Finally, Figure 4 shows one operational example
of the flooding and data collection periods.
3 SECOND-PROTOTYPE
SYSTEM
3.1 Implementation and Experiment of
the First-prototype System
One of problems in the development of networking
protocol is that there is no repeatability in experiments
using real subjects in the sense that we cannot exper-
imentally compare the performances among different
protocols at the same time. Therefore, we developed
a network simulator which is composed of a channel
model set and a mobility model set, and evaluating
the performances of different networking protocols
changing their adjustable parameters repeatedly in the
same environmental situation, we determined the pa-
rameters of the flooding/TDMA protocol (Hara et al.,
2018), which are shown in Figure 3. And finally,
we evaluated the performance of the first-prototype
system in experiments involving 22 footballers dur-
ing 4×15min matches once indoors (first) and twice
outdoors (second and third) in 2017 and 2018 (Ham-
agami et al., 2018). The specifications and experi-
mental results on the first-prototype system are sum-
marized as follows:
• VSN: Size=45mm×44mm×15mm, weight=31g,
power consumption=90mA,
• Packet success rate: 98.3% (first indoor, back
waist), 92.6% (second outdoor, back waist),
97.8% (second outdoor, forearm), 92.1% (second
outdoor, calf), and 97.9% (third outdoor, fore-
arm).
3.2 Implementation of the Second
Prototype System
We evaluated the performance of the first-prototype
system by the experiments and obtained the success-
ful results, but the system and the method of perfor-
mance evaluation had three major drawbacks. The
first one is that the VSN was composed of two pieces
of circuit boards, one of which was equipped with
a micro controller unit (MPU) handling several vital
sensor devices and the other of which was a ready-
made transceiver module also containing an MPU. As
a result, the size of the VSN was larger. In addition,
CPU
EFM32GG295F1024
HTU21D(F)
Body surface
thermohydrometer
CBT Sensor
HTU21D(F)
Air
thermohydrometer
2x4Bytes, 1Hz
CAM-M8Q
GPS
NMEA (GLL)
Location sensor
45Bytes, 1HzI2C UART
Wireless transceiver
Si4461
Tri-axial
Accelerometer
MPU-9250
x y z
VO2 Sensor
Normal PPG Sensor
Color sensor
BH1792
(Green LED)
HR Sensor
MA Sensor
Color sensor
BH1792
(Green LED)
3x4Bytes, 8Hz 2x2Bytes, 32Hz
I2C
I2C
920MHz band
20mW
100kbps
48MHz
SPI
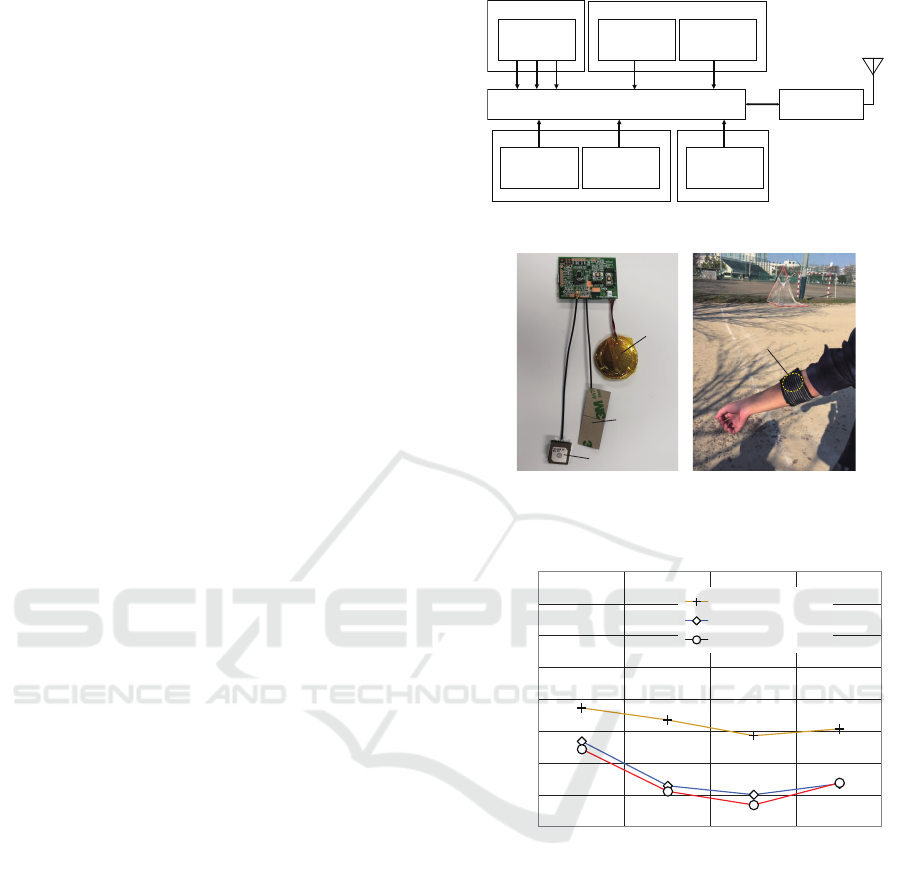
Figure 5: Block diagram of the second-prototype VSN.
(a) Vital sensor node (b) Wearing position
Battery
Dipole
Antenna
GPS antenna
Vital sensor node
Figure 6: Photos of vital sensor node and its wearing posi-
tion (forearm).
0
10
20
30
40
50
60
70
80
20hPa 30hPa 50hPa 70hPa
RMSPE [%]
PPG
PPG/MAC/OR
PPG/MAC/PFT
(Loose) (Moderate) (Tight) (Very tight)
Wearing pressure
Forearm
Figure 7: Performance comparison between OR and PFT.
a passive antenna was used for the GPS receiver, so
it did not work at all. The second one is that the de-
signed superframe was able to accommodate up to 25
TDMA time slots, in other words, the system was able
to accommodate up to 25 persons for vital sensing.
Finally, the third one is that we evaluated the perfor-
mance in a single sporting activity of football, where
footballers are likely to randomly spread in the entire
ground.
According to the feedback and reflection on
the system development and the method of perfor-
mance evaluation, we have implemented the second-
prototype system.
A Real-time Vital Data Collection System for a Group of Persons during a Variety of Sporting Activities in a Large Outdoor Ground
141

Table 1: Payload format.
Sequence Number 2Bytes
HR 1Byte
Body surface temperature/humidity 4Bytes
Air temperature/humidity 4Bytes
VO2 1Byte
GPS longitude/latitude 4Bytes
Acceleration 12Bytes
Reserved 2Bytes
3.2.1 VSN
Figure 5 shows the block diagram of the second-
prototype VSN. A single MPU based on ARM
Cortex-M3 handles all the devices, so the VSN is
composed of a single circuit board. In addition, some
sensor components are changed, so the power con-
sumption is reduced to 70mA (22.2% reduction). On
the other hand, we adopt a larger battery (CLB3032)
and a larger active antenna (15dB gain) for GPS re-
ceiver, so the size of the VSN is not so reduced as
48mm×38×15mm (7.9% reduction) and its weight is
32g including the battery and antenna.
Regarding the wearing position of VSN, we de-
cide to put the VSN to the forearm of person, since
the forearm gives the highest packet success rate in
the experimental results by the first-prototype system.
Figures 6 (a) and (b) show the photos of the second-
prototype VSN and its wearing position at a person,
respectively.
Furthermore, regarding the signal process for HR
calculation, we replace the OR technique by the peak
frequency tracking (PFT) technique (Zhang, Pi, &
Liu, 2015). Figure 7 compares the HR during sport-
ing activities with different intensities between the
OR and PFT techniques, which are obtained by ex-
periments involving 13 subjects. We can confirm the
improvement by the PFT in all the range of wearing
pressure.
Finally, Table 1 shows the payload format in the
data frame.
3.2.2 Multihop Networking Protocol
The second-prototype system is based on the same
flooding/TDMA networking protocol as in the first-
prototype system, but the superframe structure is
changed as an extended superframe structure. Fig-
ure 8 shows the structure of the extended superframe,
where each extended superframe is composed of n su-
perframes. To be able to accommodate up to 30 VSN
in a superframe, the preamble and payload are con-
densed while keeping the amount of information the
same as for the first-prototype system. According to
Flooding period Data collection period
380msec
4.16msec 77.04msec 70msec
Slot 1 Slot 2 Slot 3 Slot 1
33msec
Slot 2
...
Slot m
...
Slot 30
600msec
1,000msec
Inactive period
Superframe
20msec
5.68msec
Frame 1 Frame 2 Frame 3
20msec
3.12msec 2.40msec 0.16msec
Header Payload CRC bits
nx1,000msec
Extended superframe
1,000msec
Superframe 1
...
Superframe 2 Superframe n
Beacon
2.40msec 1.60msec 0.16msec
Header Payload CRC bits
Figure 8: Structure of the extended superframe.
the pairing stage for the extended superframe struc-
ture, a DCN first randomly divides a whole VSNs into
n groups, and then assigns a distinct TDMA time slot
in the nth superframe to each VSN beloging to the nth
group.
Table 2: Detail on the experiment.
Date 6th of March, 2019
Place Kita-Yamoto baseball
ground
Area 60m×90m
Number of subjects 50
Number of VSNs 18
Number of DCN 1
Sampling rate 8samples/sec
Transmission
frequency band
920MHz band
Wireless transmis-
sion standard
ARIB-T108
Transmission
power
20mW
Transmission rate 100kbps
Duration 45min
4 EXPERIMENTAL RESULTS
AND DISCUSSIONS
Using the second-prototype system, we have con-
ducted an experiment. To involve 50 subjects in the
experiment, we set the parameter of extended super-
frame n=2, so the system was able to accommodata
up to 60 VSNs. We had a plan to implement 50 VSNs
and 1 DCN before the date of the experiment, but
there was something wrong with the batteries and cir-
cuits of VSNs, so we were able to finish implement-
ing18 VSNs. Therefore, in the experiment, we put
the operable VSNs to the forearms of 18 subjects ran-
domly selected out of 50 subjects. The DCN could as-
icSPORTS 2019 - 7th International Conference on Sport Sciences Research and Technology Support
142
Antenna
Data collection node
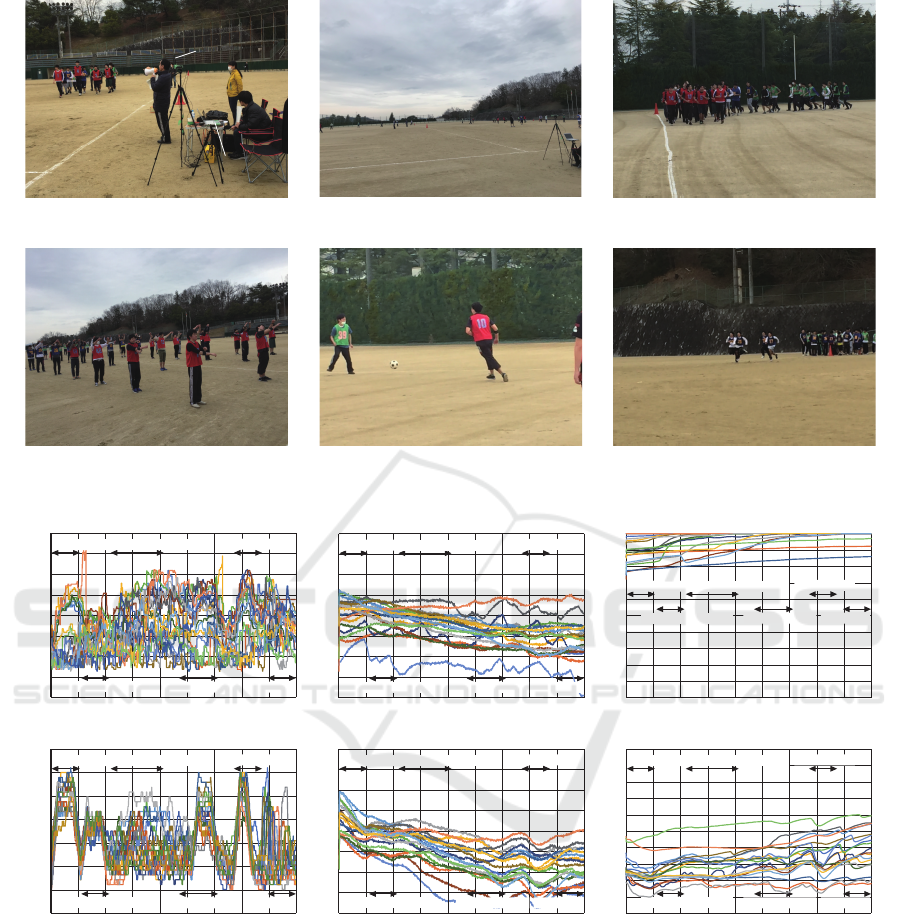
(c) Entry jogging
(d) Warming-up exercises (e) Mini-football exercise (f) 50m footrace
(a) Data collection node (b) Panoramic view
Figure 9: Photos of the experiment.
0 5 10 15 20 30 40 45
60 80 100 120 140 160 180 200
25 35
Time [min]
Heart rate [beats per minute]
220
Warmig-up exercises
Mini-football exerciseEntry jogging
Random jogging
50m footrace
Gathering
0 5 10 15 20 30 40 45
0 5 10 15
20 25 30
25 35
Time [min]
VO2 [ml/kg/min]
35
Warmig-up exercises
Mini-football exerciseEntry jogging
Random jogging
50m footrace
Gathering
(a) HR
(d) VO2
0 5 10 15 20 30 40 45
32 33 34 35 36 37 38 39
25 35
Time [min]
Temperature [degrees C]
40
Mini-football exerciseEntry jogging 50m footrace
Warmig-up exercises Random jogging Gathering
(b) Body surface temperature
(e) Air temperature
0 5 10 15 20 30 40 45
32 33 34 35 36 37 38 39
25 35
Time [min]
Temperature [degrees C]
40
Mini-football exerciseEntry jogging 50m footrace
Warmig-up exercises Random jogging Gathering
(c) Body surface humidity
(e) Air humidity
0 5 10 15 20 30 40 45
0 10 20 30 40 50 60 70
25 35
Time [min]
Humidity [%]
80
Mini-football exerciseEntry jogging 50m footrace
Warmig-up exercises Random jogging Gathering
90 100
0 5 10 15 20 30 40 45
0 10 20 30 40 50 60 70
25 35
Time [min]
Humidity [%]
80
Mini-football exerciseEntry jogging 50m footrace
Warmig-up exercises Random jogging Gathering
90 100
Figure 10: Sensed vital data for all the 18 subjects.
sign the TDMA time slots in one of the 2 superframes
to all the VSNs, but it randomly assigned the TDMA
time slots of the 2 superframes, that is, 9 VSNs in one
superframe and another 9 VSNs in the other super-
frame. Table 2 shows the details on the experiment.
In addition, we have designed the protocol of the
experiment so as to include a variety of sporting ac-
tivities, such as uniformly spreading in the entire area,
gathering in a localized area, with low and high mo-
bility, with random and coordinated mobility and so
on. Table 3 shows the protocol of the experiment for
45min in total period, and Figure 9 shows the photos
of experiment.
Figures 10 (a)-(f) show the temporal variations on
the HR, VO2, body surface temperature/humidity and
air temperature/humidity for all the 18 subjects, re-
spectively. We can see from these figures that the
second-prototype system can collect the vital data
from all the 18 subjects regularly for 45min. For the
HR sensing, we put the Holter monitors to 2 subjects,
A Real-time Vital Data Collection System for a Group of Persons during a Variety of Sporting Activities in a Large Outdoor Ground
143
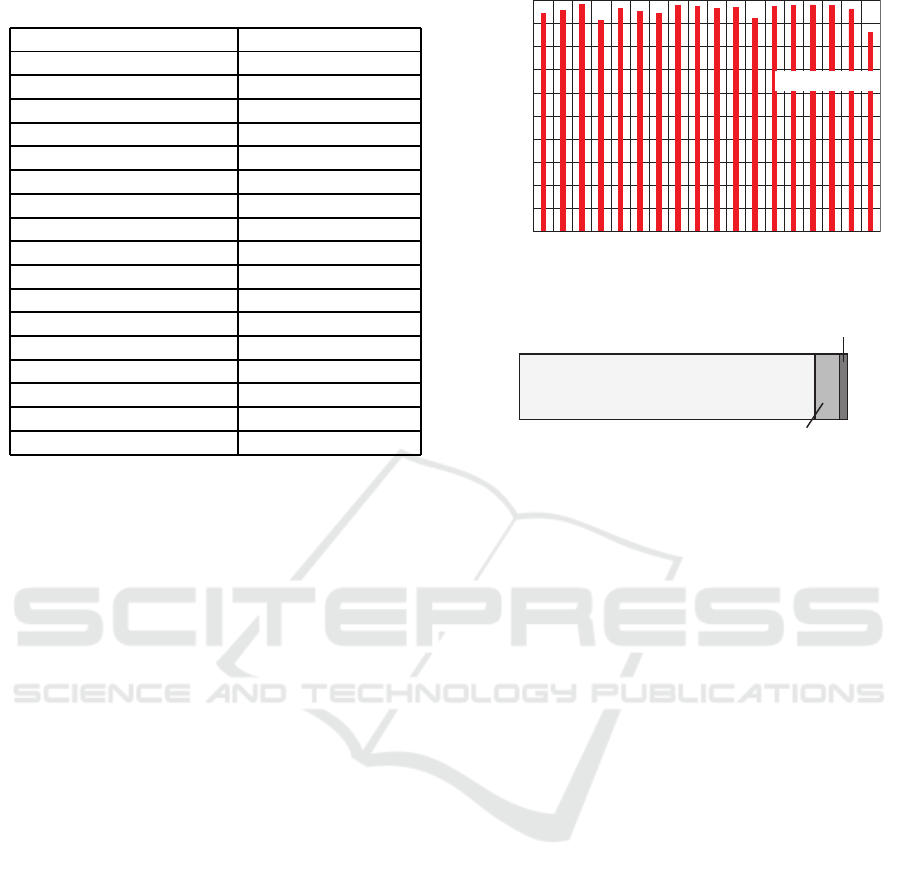
Table 3: Protocol of the experiment.
Entry jogging 4min
Gathering into 1 group 1min
Spreading 1min
Warming-up exercises 4min
Gathering 1min
Spreading into 4 groups 2min
Mini-football exercise 10min
Gathering into 4 groups 1min
Resting 2min
Random jogging 3min
Gathering into 4 groups 1min
Dividing into 12 groups 1min
Random jogging 3min
Gathering into 1 group 1min
Resting 2min
50m footrace 6min
Gathering into 1 group 1min
Resting 1min
and we confirmed that the HR sensors worked accu-
rately for them. For the temperature and humidity
sensing, the VSN senses the temperature and humid-
ity of the air in the case of VSN through a hole, so
they may be affected by those of body surface. How-
ever, the air temperature tends to gradually decrease,
whereas the body surface temperature tends to keep
flat. On the other hand, the body surface humidity
tends to earlier saturate (reach 100%) due to sweat by
sporting activities, whereas the air humidity tends to
gradually increase. Indeed, it began raining around
the end of the experiment.
Figure 11 shows the packet success rates for the
active 18 VSNs. All the packet success rates are satis-
factorily high, the average=94.9%, so we can see that
the flooding/TDMA protocol using the extended su-
perframe structure works effectively. In addition, Fig-
ure 12 shows the distribution on the number of hops.
It is interesting to see that even for the large ground,
around 90% of packets reach the DCN directly, but
the multihop data collection is essential to make the
packet success rate higher.
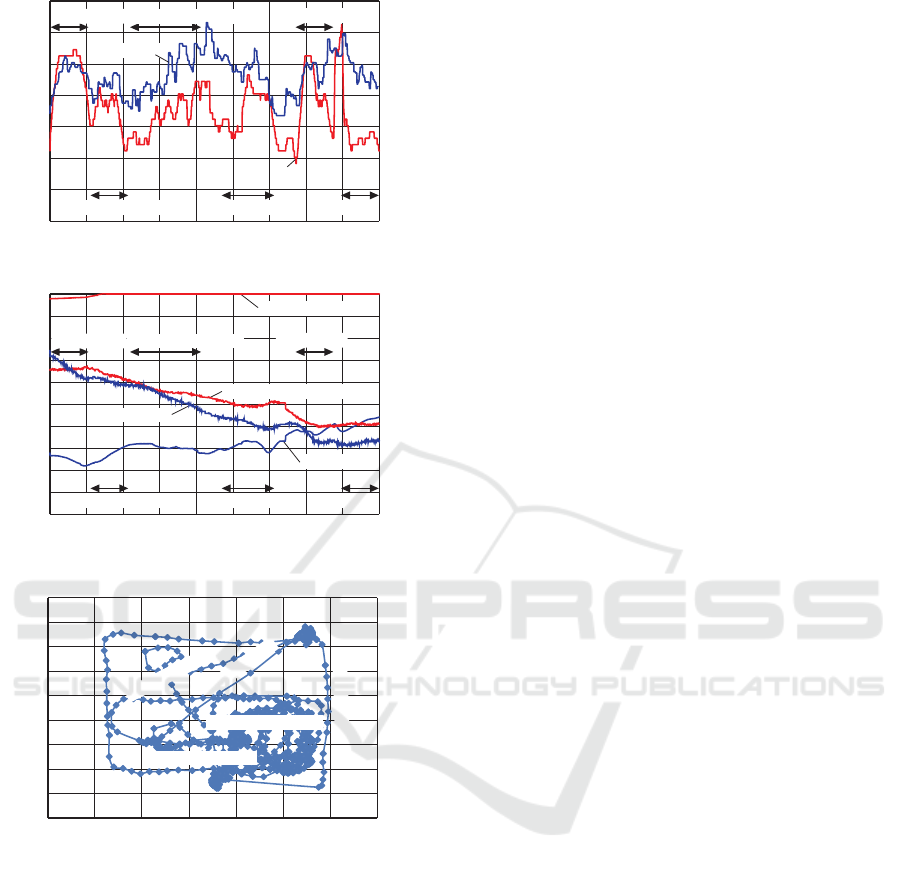
Finally, Figure 13 focuses the sensed vital data
and location for a subject. It is quite natural to see
that the HR temporal variation is likely to be synchro-
nized with that of VO2, but there is some disagree-
ment between them around at the beginning of the
experiment. We could imagine that it is because the
subject was not tired when the experiment started.
1 2 3 4 5 18
0
10
20
30
40
50
60
70
6
VSN number
Packet success rate [%]
80
90
100
7 8 9 10 11 12 13 14 15 16 17
Average=94.9%
Figure 11: Packet success rate for all the 18 subjects.
3 hops (0.2%)
1 hop (90.2%)
2 hop2 (9.6%)
Figure 12: Distribution on the number of hops.
5 CONCLUSIONS
In this paper, after outlining the vital sensing and
wireless networking techniques which we have been
improving, we showed the latest experimental result
on the real-time vital data collection systems for a
group of persons during sporting activities in a large
outdoor ground. Because of some troubles in imple-
mented vital sensor nodes and batteries, the number
of operable vital sensor nodes used in the experiment
was not satisfactorily high but we confirmed that the
second-prototypesystem works effectively for 18 per-
sons in a group of 50 persons during a variety of sport-
ing activities for 45min.
We have not developed a technique to estimate
core body temperature using information by wearable
vital sensors, so one of our future works includes its
development. In addition, we need to accommodate
up to 150 persons while improving the packet success
rate up to 99.0%, so another of our future works in-
cludes the design of a more efficient flooding/TDMA
networking protocol based on the extended super-
frame structure.
ACKNOWLEDGMENTS
The authors have disclosed no other potential con-
flicts of interest (COI). In addition, this research was
approved by the institutional review board of one of
the author’s organizations.
icSPORTS 2019 - 7th International Conference on Sport Sciences Research and Technology Support
144
0 5 10 15 20 30 40 45
60 80 100 120 140 160 180
25 35
Time [min]
Heart rate [beats per minute]
200
Warmig-up exercises
Mini-football exercise
Entry jogging
Random jogging
50m footrace
Gathering
25 20
15 10 5
VO2 [ml/kg/min]
035 30
Heart rate
VO2
(a) HR and VO2
0 5 10 15 20 30 40 45
30 31 32 33 35 37 39
25 35
Time [min]
Heart rate [beats per minute]
40
Warmig-up exercises
Mini-football exercise
Entry jogging
Random jogging
50m footrace
Gathering
80 70 60 40 20
Humidity [%]
0100 50 30 1090
34 36 38
Body surface temperature
Body surface humidity
Air temperature
Air humidity
(b) Temperature and humidity
Entr
y jo
gging
Warmig-up exercises
Mini-football exercise
50m footrace
Ran
d
o
m jogging
0 20 40 60 80 100 120 140 [m]
10 20 30 40 50 60 70 90 [m]800
(c) Location
Figure 13: Sensed vital data and location for a subject.
REFERENCES
Hamagami, T. et al., 2018. Wireless Multi-Hop Networking
for a Group of Exercisers Spread in a Sports Ground,
Proc. IEEE Healthcom 2018, pp. 1-6.
Hara, S. et al., 2013. Development of a Real-Time Vital
Data Collection System from Players during a Foot-
ball Game, Proc. IEEE Healthcom 2013, pp. 1-5.
Association of Radio Industries and Businesses, 2011.
ARIB STD -T108, version 1.0.
IEEE, 2015. IEEE Standard for Low-Rate Wireless Net-
works 802.15.4-2015.
Perkins, C., Belding-Royer, E., & Das., S., 2003. Ad hoc
On-Demand Distance Vector (AODV) Routing, IETF,
RFC 3561.
Johnson, D., Hu, Y., & Malts, D., 2007. The Dynamic
Source Routing Protocol (DSR) for Mobile Ad Hoc
Networks for IPv4, IETF, RFC 4728.
Hara, S. et al., 2018. Performance prediction of wireless
multi-hop networks using stored data sets for persons
during exercises, Proc. ICT 2018, pp. 1-6.
Zhang, Z., Pi, Z., & Liu, B., 2015. TROIKA: A General
Framework for Heart Rate Monitoring Using Wrist-
Type Photoplethysmographic Signals During Inten-
sive Physical Exercise, EEE Trans. on Biomed. Eng.,
vol. 62, no. 2, pp. 522-531.
A Real-time Vital Data Collection System for a Group of Persons during a Variety of Sporting Activities in a Large Outdoor Ground
145
