
A Smart Socks System for Running Gait Analysis
Peteris Eizentals
1
, Alexei Katashev
1
and Alexander Oks
2
1
Institute of Biomedical Engineering and Nanotechnologies, Riga Technical University, Kalku 1, Riga, Latvia
2
Institute of Design and Technology, Riga Technical University, Kalku 1, Riga, Latvia
Keywords: Gait Analysis, Smart Socks, Smart Textile, Textile Pressure Sensors.
Abstract: Running gait analysis is an often used tool for running performance improvement and injury prevention due
to an incorrect running style. The typical gait analysis methods are unavailable to amateur runners outside of
special clinics due to their relatively high cost. Smart socks are a relatively cheap gait analysis method that
can be used by amateur runners and professional athletes for running performance improvement. This paper
presents a smart socks system for feet plantar pressure measurement during running, as well as methods for
characterisation of the acquired plantar pressure measurement for running gait analysis. The validation of the
smart socks with a Pedar insole system is described, and the measurement analysis methods are demonstrated
by practical running tests. The validation tests demonstrated good temporal and pressure sensing
characteristics of the system, while the simplicity of the developed gait analysis methods was demonstrated
in the practical tests.
1 INTRODUCTION
Running is one of the most popular sport and
recreational activities worldwide. Besides its
beneficial effects on the health, it is also the cause of
numerous injuries, and up to half of the runners report
an injury annually (Fields et al., 2010). The most
frequent running related injuries are medial tibial
stress syndrome (incidence 13.6% – 20.0%,
prevalence 9.5%), Achilles tendinopathy (incidence
9.1% – 10.9%, prevalence 6.2% – 9.5%), plantar
fasciitis (incidence 4.5% – 10.0%, prevalence 5.2% –
17.5%), Patellar tendinopathy (incidence 5.5% –
22.7%, prevalence 12.5%), and ankle sprain
(incidence 10.9% – 15.0%, prevalence 9.5%) (Lopes
et al., 2012). Many of these injuries have high
recurrence rates (Bramah et al., 2018) and therefore
affect both daily life and training of the injured
person. Running related injuries are especially
frequent among amateur runners (De Araujo et al.,
2015), who often lack the understanding of a correct
running style. Although the connection between the
running style and the rate of injuries is still debatable
(Barton et al., 2016; Hamill & Gruber, 2017), running
gait analysis for amateur runners could be beneficial
for early detection of potentially harmful running
style or gait pathologies (Vincent et al., 2014), as it is
generally accepted that one of the main contributors
to running related injuries is abnormal running
kinematics (Barton et al., 2016). On top of that,
running gait analysis is a valuable tool for
performance improvement for professional runners
and amateurs alike. Unfortunately, there are no
simple and cheap tools for gait analysis that would be
affordable for non-professionals. The typical gait
analysis methods for feet plantar pressure analysis are
pressure sensing mats and insoles and gait analysis by
MEMS or 3D mapping (Taborri et al., 2016). All of
these methods are rather expensive and unavailable
for amateur runners outside of special clinics.
This paper describes running gait analysis by
custom-designed smart socks system, DAid®
Pressure Sock System (DPSS), and specially for this
system designed gait analysis methods. The smart
socks system was developed for solving some of the
inherent limitations of the conventional gait analysis
methods, as the socks are relatively cheap to produce,
if compared to insoles or pressure mats, they don’t
interfere with the performed activity, and can be used
with any type of shoes indoors and outdoors (Taborri
et al., 2016). The feasibility of walking gait analysis
by the DPSS has been demonstrated previously
(Eizentals, Katashev & Oks, 2018a), but the
performance of the system has not yet been verified
with a certified commercial gait analysis system, and
no tests had been done with running gait.
The system validation with the Pedar insole
system as a reference demonstrated that the smart
Eizentals, P., Katashev, A. and Oks, A.
A Smart Socks System for Running Gait Analysis.
DOI: 10.5220/0008070000470054
In Proceedings of the 7th International Conference on Sport Sciences Research and Technology Support (icSPORTS 2019), pages 47-54
ISBN: 978-989-758-383-4
Copyright
c
2019 by SCITEPRESS – Science and Technology Publications, Lda. All rights reserved
47
socks system has very good temporal characteristics,
as the average differences for the calculated step and
stride times between measurement by pedar and by
DPSS were 1.75% and 1.34% respectively. Practical
application of two dedicated running gait analysis
methods for smart socks is demonstrated in this paper.
2 SYSTEM DESCRIPTION
The developed smart socks system described in this
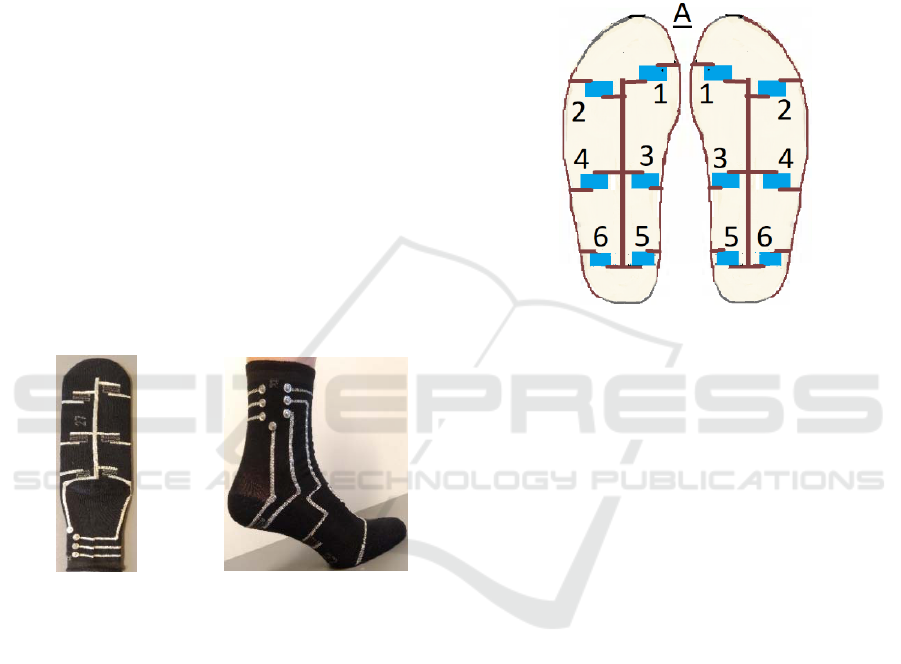
paper contains 6 pressure sensors on each sole, two
on the heel, two under the arch and two under the
metatarsals (see Fig. 1 and Fig. 2). Such sensor
distribution enables monitoring of temporal walking
and running gait characteristics, and comparing the
features of plantar loading for normal
(asymptomatic), flat (pes planus) foot as well as
diagnosing supination and pronation conditions.
Conductive pathways are designed to provide the
connection between sensors and the data acquisition
units. The data acquisition units are attached to the
cuff of the sock by Velcro type tape and connected to
the sock by snap fasteners.
Figure 1: DAid Pressure Sock System, (a) sensors on the
insole, and (b) connectors for the data acquisition unit.
The main advantage of this technology is the
possibility to produce the DPSS socks using ordinary
sock knitting machines, thus greatly decreasing the
production cost. Moreover, the number and
placement of the sensors can be easily modified
according to the demands of a customer or
applications.
The present version of the data acquisition unit
collects the measurement simultaneously from all 6
pressure sensors and transmits them via Bluetooth to
a remote data processing device, where the
measurement is synchronized and saved to a file. The
sampling frequency of data acquisition is up to 200Hz
per channel, which is greater than 100Hz sampling
speed which is the recommended in the literature for
monitoring the change of feet plantar pressure during
running (Mann et al., 2016). The sampling frequency
can be adjusted to lower energy consumption, if
prolonged monitoring is required, providing with
more than 8h of continuous measurement.
Additionally, the device allows changing the
sensitivity range of the sensors and resetting the
timer. The sensors are numbered according to Fig. 2:
(1) front medial, (2) front lateral, (3) middle medial,
(4) middle lateral, (5) heel medial, and (6) heel lateral.
Figure 2: Sensor distribution and numbering on the Smart
Socks system.
3 SYSTEM VALIDATION
To assess the performance of the DPSS, verification
of the measurement was performed by the Pedar®
system insoles (Novel GmbH, Munich), which is
considered the golden standard for feet plantar
pressure measurement for gait analysis (Tamura &
Chen, 2018). Each Pedar insole contains 99 pressure
sensors, and the measurement is sampled at 50Hz or
100Hz, and transmitted to the computer via Bluetooth
connection. To analyze the performance of the Smart
Socks system, 6 participants were requested to walk
several times approx. 10m long distance in a normal
gait, while the feet plantar pressure measurement was
obtained simultaneously with both systems. A heel
strike was performed before each walk for providing
a sharp peak for signal synchronization. The Pedar
measurement was obtained at the rate of 100Hz,
which is the maximal sampling rate of the system,
while the smart socks system sampling rate was
approx. 200Hz.
For validation of the temporal accuracy of the
DPSS, step and stride times were calculated and
compared to those obtained by the Pedar system. The
stride time is the time between two successive foot to
ground contacts of the same foot, while the step time
is the time from the first foot-to-ground contact of one
ba
icSPORTS 2019 - 7th International Conference on Sport Sciences Research and Technology Support
48
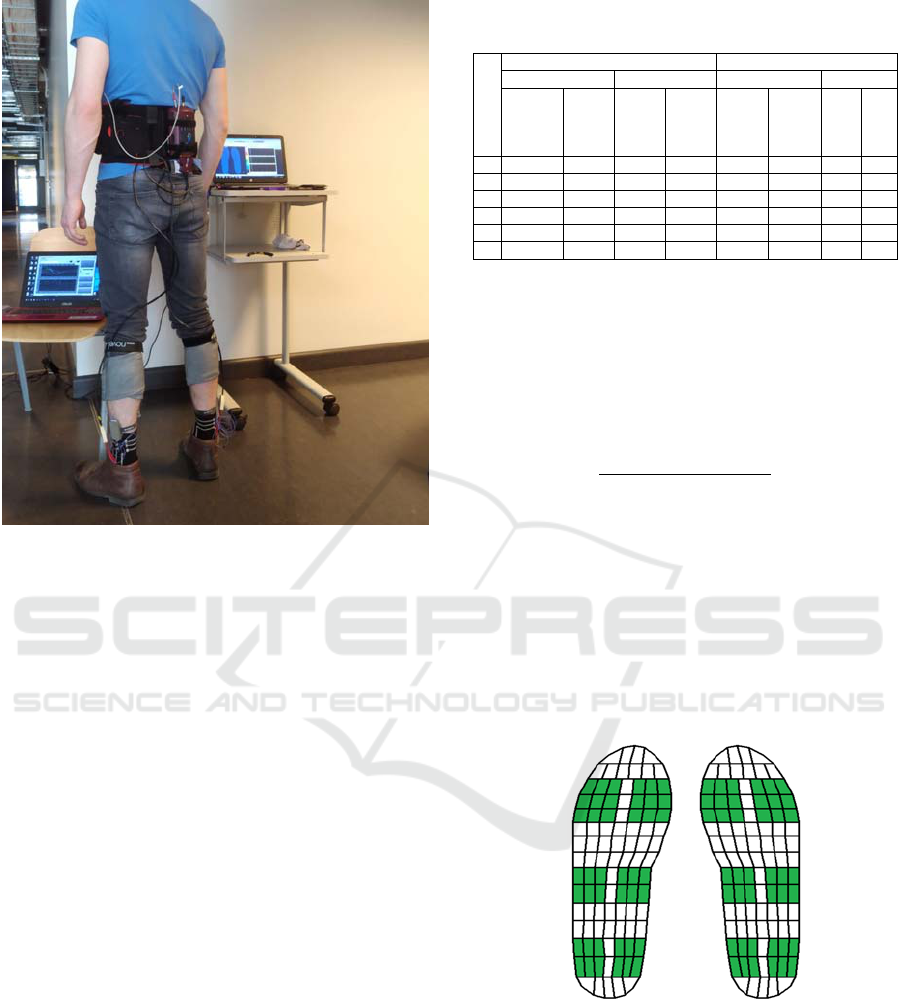
Figure 3: Test participant with the Pedar and the DPSS
attached.
foot to that of the other foot. The foot contact
detection threshold for Pedar was set to 50kPa of the
total pressure, where the total pressure was obtained
by summing all sensor measurement. For the DPSS,
the contact threshold was selected as 20% of the total
pressure, and it was adjusted adaptively with a
moving window algorithm. The adaptive adjustment
was performed to account for possible sensor
sensitivity change caused by feet sweating.
All calculated mean step and stride times are
given in Table 1. As it can be seen, the temporal
values obtained by the smart socks system are
remarkably close to the ones obtained from the Pedar
system, with the average difference of the mean
values being 9.8ms (1.75% of the mean step time) and
14.9ms (1.34% of the mean stride time) for step and
stride time respectively.
Direct comparison of pressure values between
both systems is not possible, as calibration of textile
pressure sensors is rather complicated due to the
hysteresis and nonlinearity of the textile sensors, and
is not performed for this application. As a result, the
measured electrical resistance of the sensors was not
converted to pressure units. Additionally, the size of
the textile sensors is considerably larger than that of
the Pedar insole sensors. To allow comparison of
pressure change over time for both systems, the
measurement was processed as follows. First, the
Table 1: Comparison of step and stride times obtained by
the Pedar and DPSS.
Nr.
DPSS Peda
r
Ste
p
Stride Ste
p
Stride
Mean
STD
Mean
STD
Mean
STD
Mean
STD
1 0.599 0.052 1.197 0.059 0.604 0.028 1.2 0.04
2 0.668 0.033 1.33 0.044 0.665 0.0275 1.327 0.043
3 0.541 0.075 1.07 0.109 0.569 0.075 1.105 0.021
4 0.525 0.048 1.042 0.033 0.523 0.2023 1.057 0.049
5 0.527 0.035 1.044 0.042 0.522 0.0211 1.038 0.026
6 0.527 0.111 1.054 0.106 0.538 0.0303 1.073 0.035
average pressure was calculated for Pedar system for
six zones in the approximate position of each textile
sensor (see Fig. 4, the chosen sensors on the Pedar
insole are marked). These calculated values, as well
as the values from the smart socks system, were
normalized by using a sliding window normalization
according to the equation:
min
max
min
(1)
0.5
(2)
0.5
(3)
where u
i
is the corresponding measurement and w is
the normalization window size, which was selected to
be 250 for Pedar ad 500 for DPSS. The width of the
window was selected to include 3-5 steps at a normal
walking speed.
Figure 4: The sensors in the marked area were selected for
plantar pressure measurement comparison with that of the
Smart Socks System
.
An example of the measurement from both
systems after the normalization is provided in Fig 5.
As can be seen, both measurements show a good
similarity of the activation time and relative pressure
change over the time. The middle sensors are not
shown in the figure as they typically have low
A Smart Socks System for Running Gait Analysis
49
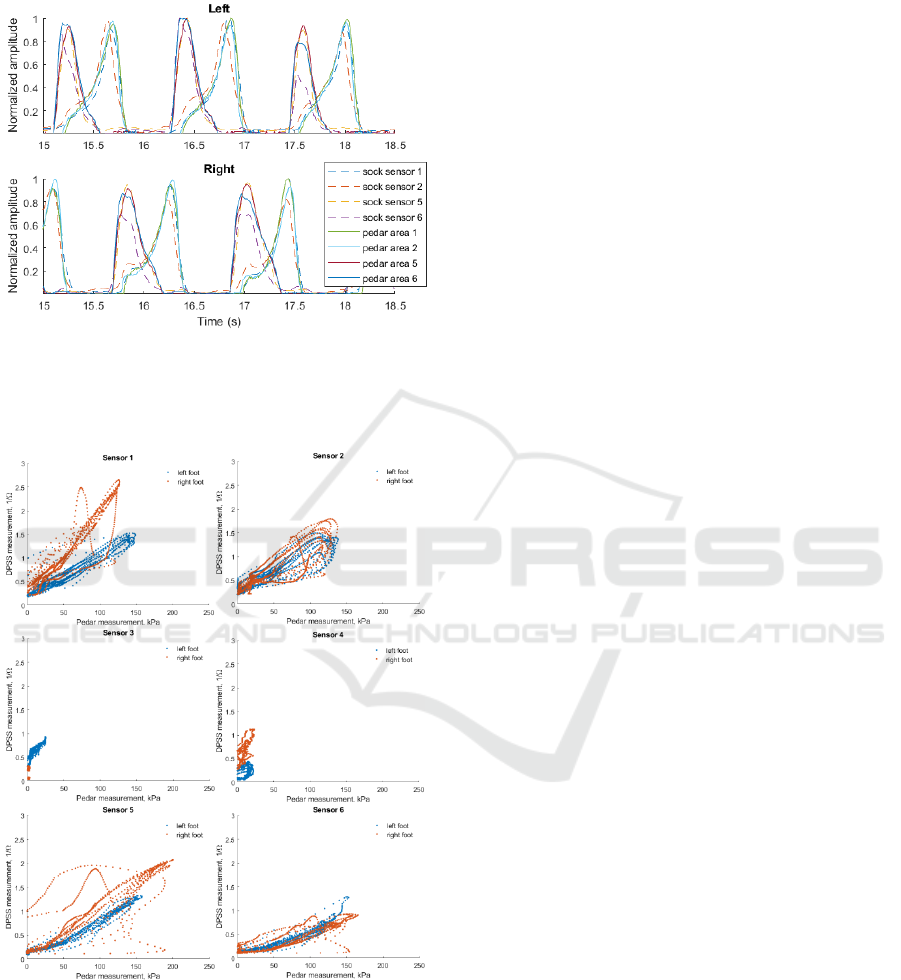
pressure values, and the values after normalization do
not represent the real measurement.
Figure 5: Example of normalized measurement for both
systems, the sensor numbers for the DPSS sensors are
according to Fig. 2 while the Pedar areas for each textile
sensor are given in the Fig. 4.
Figure 6: An example of a measurement comparison of
several consecutive steps for Pedar and smart socks
systems. A linear relationship can be observed between
measurement of both systems.
An example of the raw measurement value
comparison for both systems is provided in Fig. 6. A
linear relationship between the measurement
obtained by DPSS and that of the Pedar system can
be observed for all sensors except those under the
arch of the foot, which are not activated due to the
relatively low pressure in the area under the arch of
the foot. This signifies that a calibration of the smart
socks system could be performed by obtaining the
calibration coefficients from these measurements.
The results obtained from simultaneous
measurements with both the Pedar and the Smart
Socks system confirmed that the developed system
has good temporal accuracy. The step and stride times
calculated from the measurement of the smart socks
system were reasonably close to those obtained from
the measurement of the Pedar system. Moreover, the
measured pressure change over time was in a good
agreement between both systems, as shown in Fig. 5.
It can be concluded from these results that the smart
socks system is a reliable tool for gait temporal
parameter measurement, and the system calibration
for absolute measurements is possible.
4 RUNNING GAIT ANALYSIS
Two experiments were performed for testing the
feasibility of the developed smart socks system and
the dedicated methods for running gait analysis. For
the first experiment, two amateur runners performed
a test run on a treadmill, starting with a 2min warm-
up at 5kmh, proceeded with 8-10min run at 10kmh,
and finishing with 1min cooldown at 5kmh. For the
second experiment, one amateur runner performed a
30min run at 10kmh followed by a 2min cooldown.
The plantar pressure measurement was performed
with the smart socks system. The obtained
measurement from both experiments was analyzed by
gait analysis methods developed exclusively for the
smart socks system – Force Vector and Pressure
Wave methods.
The Force Vector is a graphical gait
characterization method that is comparable to the
center of pressure method typically used for gait
analysis (Eizentals et al., 2018b). For each
measurement, a point is calculated, which is derived
from the measured pressure values of all sensors, and
the positions of each sensor on the sock as a unit
vector. All points calculated for any step together
make a line or trajectory, which describes the
respective step. The Y-axis of the graph represents the
foot in posterior (Y < 0) and anterior (Y > 0)
directions while X-axis represents the medial (X < 0)
and lateral (X > 0) directions (see Fig. 7). The Force
Vector values were calculated according to the
following equations 4 and 5:
icSPORTS 2019 - 7th International Conference on Sport Sciences Research and Technology Support
50
cos
(4)
sin
(5)
where ′ is the normalized measurement value for
each sensor obtained from equation (1),
1,1,cos,cos,1,1 is a weight coefficient
assigned to each sensor and
75°,105°,0°,180°,285°,255°
is the assigned
angle of each sensor. The sensor order is according to
that presented in Fig. 2.
Figure 7: The approximate position of a foot on the Force
Vector axis (not to scale).
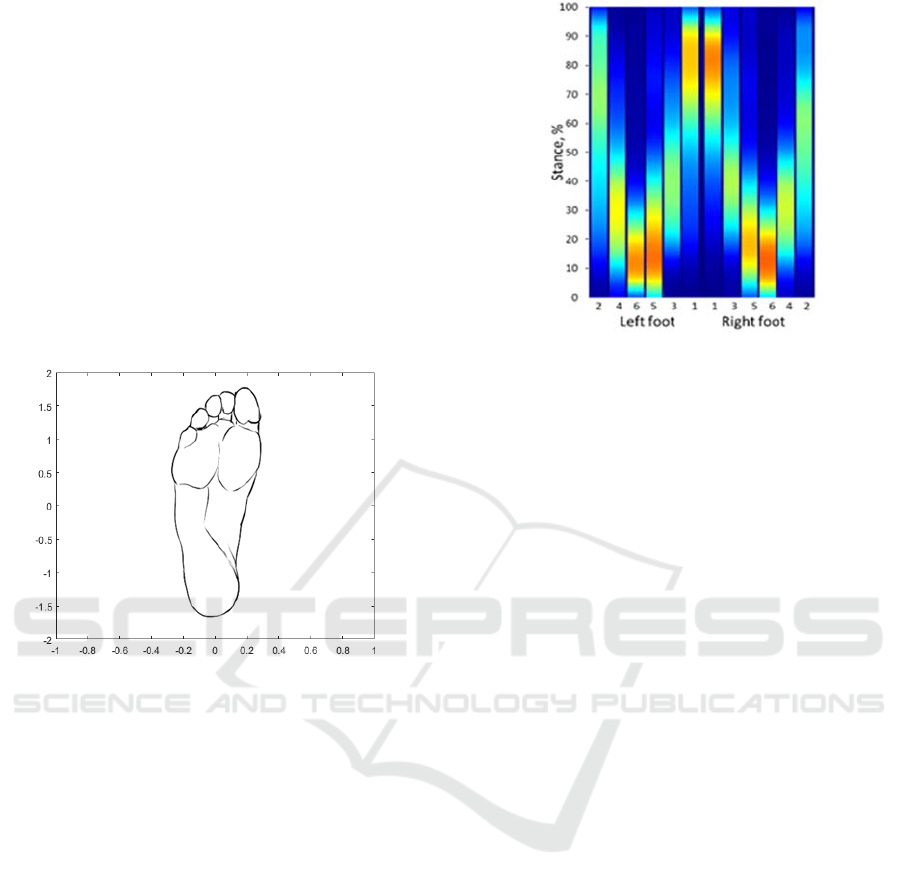
The Pressure Wave diagram is a graphical gait
representation method that attempts to visualize all
sensor values for the whole step duration at each
moment of the step. To achieve this, an image is
created, where each sensor measurement during a
step is displayed as a color bar, the color intensity
representing the normalized value of the sensor (0 –
1), and on Y-axis normalized time of the step (0 –
100%) (see Fig 8). Sensors in the image are
distributed in following order (from left to right): left
lateral metatarsal, left lateral tarsus, left lateral heel,
left medial heel, left medial tarsus, left medial
metatarsal, right medial metatarsal, right medial
tarsus, right medial heel, right lateral heel, right
lateral tarsus, and right lateral metatarsal. Such
distribution allows analyzing the sensor activity
during the whole step in a comprehensible way,
giving information about which parts of the foot were
in contact with the ground at which moment of the
step and what was the relative pressure.
Figure 8: Example of a Pressure Wave diagram. The sensor
measurement during the stance phase is represented as a
color-bar plot with the colors representing the sensor
measurement amplitude at each moment. The sensor
numbering is according to that given in Fig. 2.
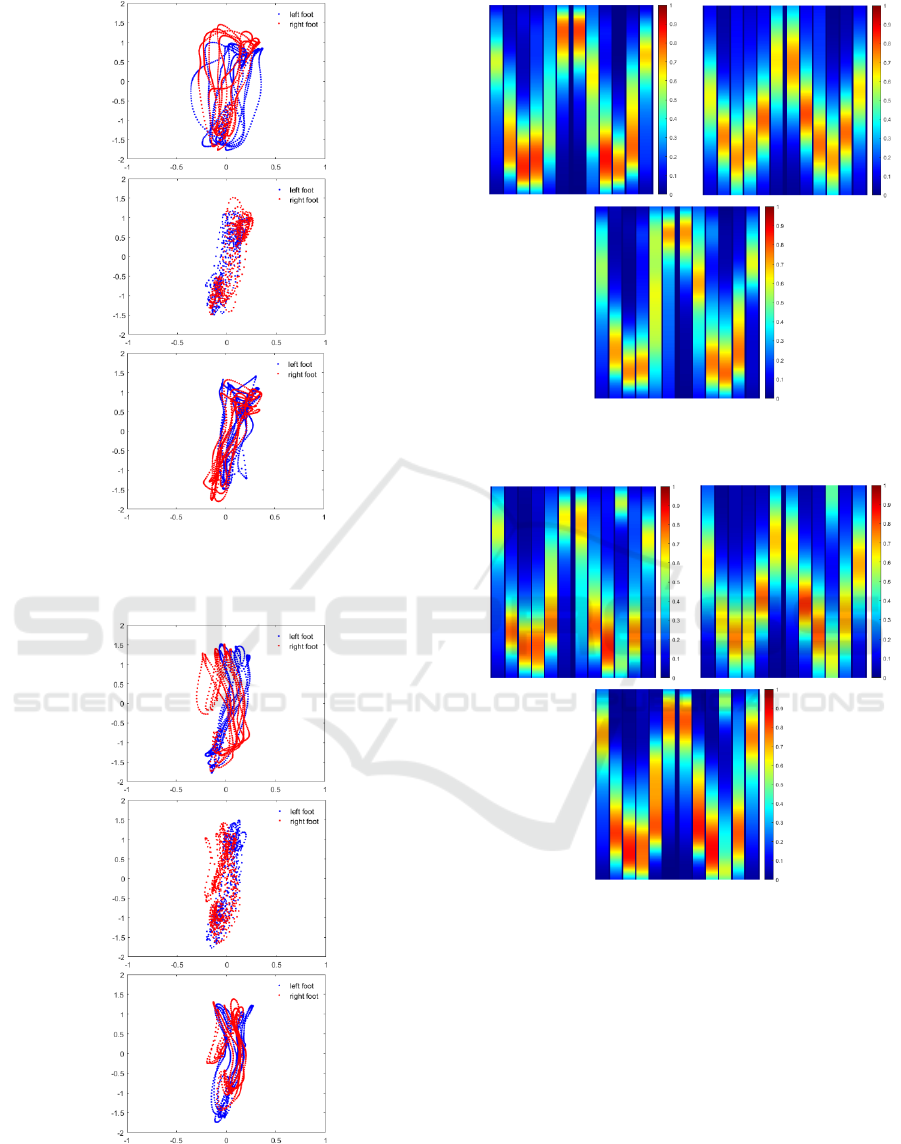
An example of the Force Vector lines for several
steps acquired in the first running measurement is
given in Fig. 9 and 10. Several conclusions can be
drawn from this result. First, both amateur runners are
rearfoot runners, as the vector line goes through the
lower part of the graph. The cooldown phase
measurement also shows less variation between the
steps as the force vector lines in Fig. 9c and Fig. 10c
are noticeably closer to each other compared to those
in Fig. 9a and Fig. 10a. The trajectory of force vector
lines in the cooldown phase is resemble the trajectory
of running phase more than that of the warmup phase.
The conclusion about rearfoot running style is also
supported by the image obtained from the Pressure
Wave diagram (see Fig. 11 and 12). According to
these images, for both participants, the initial contact
during this experiment was on the heel, as both heel
sensors (sensors 5 and 6) activated slightly before the
middle sensors.
In the second experiment, a participant was
requested to run for 30min at 10kmh to analyze both
the performance of the socks in a prolonged
monitoring, and possible effect of fatigue on the
running style. The results of this measurement
indicate that the style of running for the participant
gradually
changed from rearfoot running to midfoot
running. The Force Vector diagram shows that the
center of pressure value during each step shifted from
both heel (X < 0) and toe (X > 0) directions to the
center (see Fig. 13).
A Smart Socks System for Running Gait Analysis
51
a
b
c
Figure 9: Example of the calculated Force Vector result for
few steps of participant #1, (a) warmup, (b) running and (c)
cooldown.
a
b
c
Figure 10: Example of the calculated Force Vector result
for few steps of participant #2, (a) warmup, (b) running and
(c) cooldown.
a b
c
Figure 11: Pressure Wave result for participant #1, (a)
warmup, (b) running and (c) cooldown.
a b
c
Figure 12: Pressure Wave result for participant #2, (a)
warmup, (b) running and (c) cooldown.
The same result can be observed in the Pressure
Wave diagram (Fig. 14), where initially each sensor
reached its peak value at a noticeably different time,
but with time the overlap gradually increased. At the
20min mark the calculated center of pressure is
mostly at the center of the feet, implying the midfoot
running style, which differs from the initial rearfoot
running.
This could signify that the person might
have naturally found the running pattern with the least
energy consumption.
icSPORTS 2019 - 7th International Conference on Sport Sciences Research and Technology Support
52
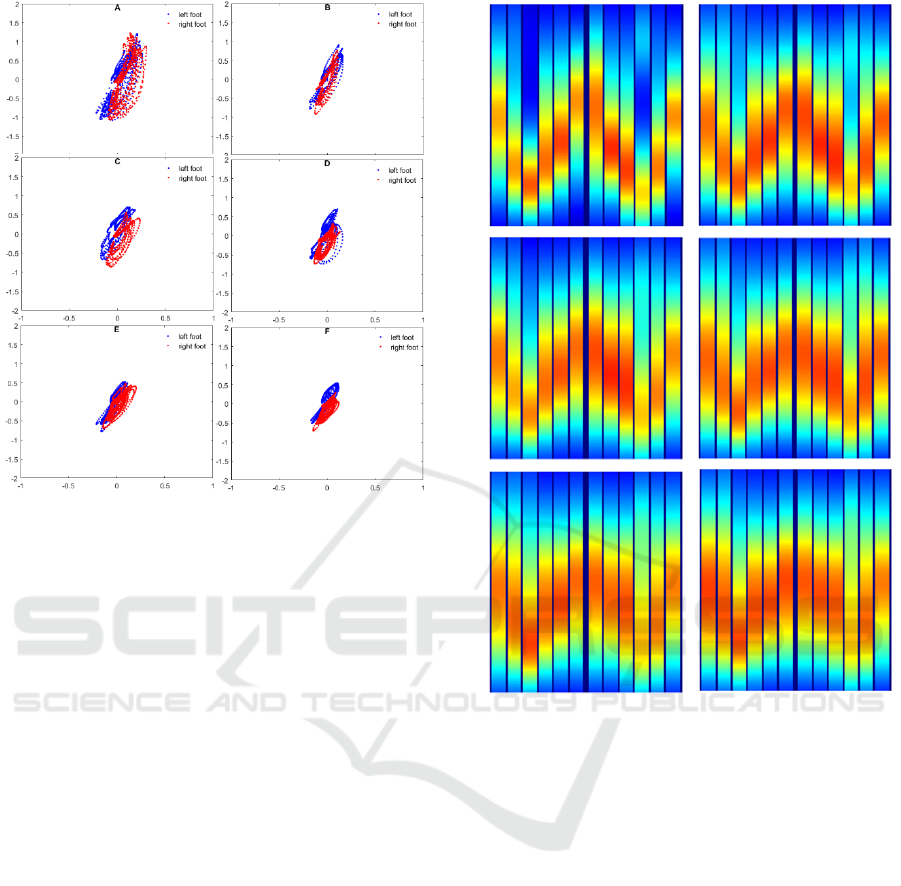
Figure 13: The calculated Force Vector diagrams for the
30min running measured at (a) 5min, (b) 10min, (c) 15min,
(d) 20min, (e) 25min and (f) 30min.
No significant change in the sensitivity of the
textile sensors during the 30min run was observed,
however, no strong conclusions could be drawn as the
participant didn’t sweat too much. It is expected that
wet from the sweat would affect the sensitivity of the
textile sensors.
5 CONCLUSIONS
Feet plantar pressure measurement and running gait
analysis with a smart socks system has been
demonstrated in this paper. The measurement
accuracy of the developed system was evaluated by
comparing it to the measurement obtained by the
Pedar measurement system. The mean differences
between step and stride times obtained by both
systems were 9.8ms and 14.9ms.
Two gait analysis methods were demonstrated in
practice for short (10min) and medium (30min) long
runs. The demonstrated methods were developed for
analysing the plantar pressure measurement obtained
by the SPSS and enable simple running gait
characterization. It was demonstrated how these
methods can be applied to evaluation of the plantar
pressure variation during running.
ab
cd
ef
Figure 14: Pressure Wave diagrams for the 30min running
measured at (a) 5min, (b) 10min, (c) 15min, (d) 20min, (e)
25min and (f) 30min.
ACKNOWLEDGMENTS
This work has been supported by the European
Regional Development Fund within the Activity
1.1.1.2 “Post-doctoral Research Aid” of the Specific
Aid Objective 1.1.1 “To increase the research and
innovative capacity of scientific institutions of Latvia
and the ability to attract external financing, investing
in human resources and infrastructure” of the
Operational Programme “Growth and Employment”
(No. 1.1.1.2/VIAA/1/16/153).
REFERENCES
Barton, C. J., Bonanno, D. R., Carr, J., Neal, B. S.,
Malliaras, P., Franklyn-Miller, A., Menz, H. B., 2016.
Running retraining to treat lower limb injuries: a
A Smart Socks System for Running Gait Analysis
53

mixed-methods study of current evidence synthesised
with expert opinion. Br J Sports Med. 2016;50(9):513-
526.
Bramah, C., Preece, S. J., Gill, N., & Herrington, L. (2018).
Is There a Pathological Gait Associated With Common
Soft Tissue Running Injuries? The American Journal of
Sports Medicine, 036354651879365.
doi:10.1177/0363546518793657
De Araujo, M. K., Baeza, R. M., Zalada, S. R. B., Alves, P.
B. R., & de Mattos, C. A. (2015). Injuries among
amateur runners. Revista Brasileira de Ortopedia
(English Edition), 50(5), 537–540.
doi:10.1016/j.rboe.2015.08.012
Eizentals P., Katashev A., Okss A. (2018a) Gait analysis by
using Smart Socks system. IOP Conf. Ser.: Mater. Sci.
Eng. 459 012037, DOI: 10.1088/1757-
899X/459/1/012037
Eizentals P., Katashev A., Okss A., Pavare Z., Balcuna D.
(2018b) Detection of Excessive Pronation and
Supination for Walking and Running Gait with Smart
Socks. World Congress on Medical Physics and
Biomedical Engineering 2018. IFMBE Proceedings,
vol 68/2. Springer, Singapore
Fields, K. B., Sykes, J. C., Walker, K. M., & Jackson, J. C.
(2010). Prevention of Running Injuries. Current Sports
Medicine Reports, 9(3), 176–182. DOI:
10.1249/jsr.0b013e3181de7ec5
Hamill, J., & Gruber, A. H. (2017). Is changing footstrike
pattern beneficial to runners? Journal of Sport and
Health Science, 6(2), 146–153.
doi:10.1016/j.jshs.2017.02.004
Lopes, A. D., Hespanhol, L. C., Yeung, S. S., & Costa, L.
O. P., 2012. What are the Main Running-Related
Musculoskeletal Injuries? Sports Medicine, 42(10),
891–905. doi:10.1007/bf03262301
Mann R., Malisoux L., Urhausen A., Meijer K., Theisen D.,
2016. Plantar pressure measurements and running-
related injury: A systematic review of methods and
possible associations. Gait Posture. 47:1-9. doi:
10.1016/j.gaitpost.2016.03.016
Toshiyo Tamura, Wenxi Chen, 2018. Seamless Healthcare
Monitoring: Advancements in Wearable, Attachable,
and Invisible Devices. Springer International
Publishing AG, DOI: 10.1007/978-3-319-69362-0
Taborri, J., Palermo, E., Rossi, S., & Cappa, P. (2016). Gait
Partitioning Methods: A Systematic Review. Sensors,
16(1), 66. DOI:10.3390/s16010066
Vincent, H. K., Herman, D. C., Lear-Barnes, L., Barnes, R.,
Chen, C., Greenberg, S., & Vincent, K. R. (2014).
Setting Standards for Medically-Based Running
Analysis. Current Sports Medicine Reports, 13(4),
275–283. doi:10.1249/jsr.0000000000000071
icSPORTS 2019 - 7th International Conference on Sport Sciences Research and Technology Support
54
