
Causal Learning to Discover Supply Chain Vulnerability
Ying Zhao, Jacob Jones and Douglas MacKinnon
Naval Postgraduate School, Monterey, CA, U.S.A.
Keywords:
Causal Learning, Counterfactual Analysis, Cause and Effect, Supply Chain Vulnerability, Associations,
Correlations, Lexical Link Analysis, Data Mining.
Abstract:
This paper illustrates a methodology of causal learning using pair-wise associations discovered from data.
Taking advantage of a U.S. Department of Defense supply chain use case, this causal learning approach was
substantiated and demonstrated in the application of discovering supply chain vulnerabilities. By integrating
lexical link analysis, a data mining tool used to discover relationships in specific vocabularies or lexical terms
with pair-wise causal learning, supply chain vulnerabilities were recognized. Evaluation of results from this
methodology reveals supply chain opportunities, while exposing weaknesses to develop a more responsive and
efficient supply chain system.
1 INTRODUCTION
U.S. Department of Defense (DoD) supply chains are
large, complex, and deal with unpredictable demand
signals from a variety of sources. DoD supply chains
account for over 100,000 suppliers, 2,000 control-
ling systems, 19 maintenance depots, 25 distribution
depots, and over 30,000 customer sites, and manag-
ing an inventory of $92.6 billion in 2015 (Haraburda,
2016). Private sector supply chains focus on profit
margins and growth potential. However, the DoD’s
goal is to ensure that readiness of equipment and per-
sonnel are maintained at a rate sufficient to engage
enemy combatants in both peace and wartime (Wil-
hite et al., 2014). Keeping the warfighters at a high
state of readiness is the main objective and a ma-
jor factor in the design of the supply chains, while
cost is a constraining factor professionals must man-
age and minimize it (Haraburda, 2016; Wilhite et al.,
2014). Therefore, military supply chains measure
themselves using two metrics: response time, which
is how quickly the force can be equipped with the re-
quired item; and effectiveness, ensuring the right sup-
ply asset is given at the right time (Jones, 2018).
2 IMPORTANCE OF CAUSAL
LEARNING
A unique aspect to military supply chains is that they
support complex weapon systems. They involve cut-
ting edge technology throughout the long life cycles
of the weapon systems and must be ready for com-
bat at any given time. To achieve the highest readi-
ness level, DoD supply chain organizations have to
constantly reinvent themselves to improve the sup-
ply chains and logistic processes by utilizing new
technology, process, and concepts, such as big data
mining, machine learning, and artificial intelligence.
While applying the new technologies, decision mak-
ers are interested in discovering and understanding
the reasons and causes from data which can address
the gaps and vulnerabilities of the current systems,
and where and how to make necessary improvements.
This calls for systematic causal learning to discover
supply chain vulnerabilities. For example, lengthy
supply delivery time could be a vulnerability. To
strengthen supply chains, causes for those vulnerabil-
ities must be discovered.
3 DATA DESCRIPTION
This project analyzed MV-22 Osprey supply chain
data, a multi-mission, tiltrotor military aircraft with
both vertical takeoff and landing, and short takeoff
and landing capabilities. It is designed to combine
the functionality of a conventional helicopter with the
long-range, high-speed cruise performance of a tur-
boprop aircraft, necessary to conduct sea basing and
expeditionary operations (V-22, 2018).
To assess the MV-22 Osprey supply chain, this re-
Zhao, Y., Jones, J. and MacKinnon, D.
Causal Learning to Discover Supply Chain Vulnerability.
DOI: 10.5220/0008070503050309
In Proceedings of the 11th International Joint Conference on Knowledge Discovery, Knowledge Engineering and Knowledge Management (IC3K 2019), pages 305-309
ISBN: 978-989-758-382-7
Copyright
c
2019 by SCITEPRESS – Science and Technology Publications, Lda. All rights reserved
305
search used the Aircraft Maintenance/Supply Readi-
ness Report (AMSRR) as the primary document iden-
tifying supply needs. The key data elements are listed
as follows:
• Parts: Discrete high priority components. To as-
sess available parts critical to aircraft readiness
and combat capability, the research delved into
Not Mission Capable Supply (NMCS) and Partial
Mission Capable Supply (PMCS) project codes.
Our intent was to discover which individual parts
most affected readiness while being accessed in
the supply chain.
• Project Code: To measure criticality of a part,
a project code is given to the component based
on the impact that part has to mission capability.
Project codes 706 (NMCS) and 707 (PMCS) were
examples of project codes analyzed.
• Status Code: Supply status codes were evaluated
to understand the condition of the components and
supply chain robustness. A “BA” status code, i.e.
items that were being processed for release and
shipment and an “AS” status code, those parts in
shipping status, were the codes emphasized dur-
ing this research. Initial codes of “BA” and “AS”,
when they first appeared on the AMSRR, were po-
tential indications of availability.
• Response Time: This figure was calculated using
the first date the supply document was published
to the AMSRR and the last known estimated de-
livery date annotated.
• Routing Location: Routing Identification Codes
were analyzed to assess which supply nodes
sourced a part and which locations were used as
a part transited the supply chain.
For example, if the response time for NMCS or
PMCS component was longer than the average, it po-
tentially shows a vulnerability. Causes for such vul-
nerabilities need to be uncovered to bolster the supply
chain and aircraft readiness.
4 LEXICAL LINK ANALYSIS
(LLA)
The data mining tool used for this research was Lex-
ical Link Analysis (LLA) which is unsupervised ma-
chine learning method and describes the characteris-
tics of a complex system using a list of attributes or
features with specific vocabularies or lexical terms.
Because the potentially vast number of lexical terms
from big data, the model can be viewed as a deep
model for big data. For example, we can describe a
system using word pairs or bi-grams as lexical terms
extracted from text data. LLA automatically discov-
ers word pairs, and displays them as word pair net-
works.
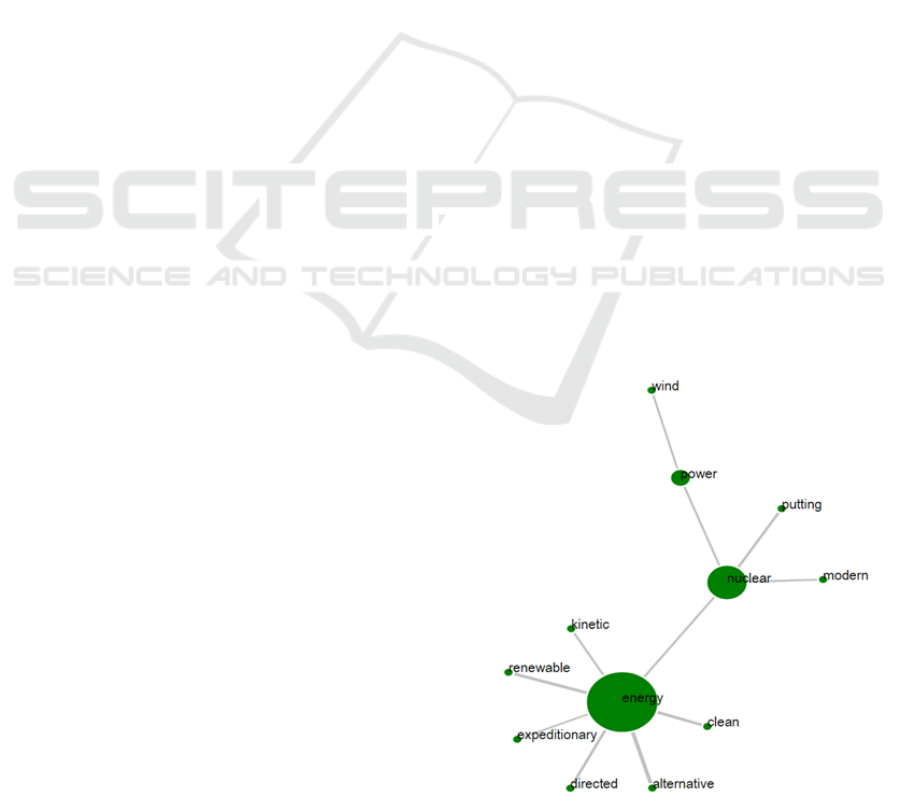
Figure 1 shows an example of such a word net-
work discovered from data. “Clean energy” and “re-
newable energy” are two bi-gram word pairs. For a
text document, words are represented as nodes and
word pairs as the links between nodes. A word center
(e.g., “energy” in Figure 1) is formed around a word
node connected with a list of other words to form
more word pairs with the center word “energy.”
5 PAIR-WISE CAUSAL
LEARNING
Bi-grams allow LLA to be extended to numerical or
categorical data. For example, using structured data,
such as attributes from databases, we discretize nu-
meric attributes and categorize their values to word-
like features. The word pair model can further be
extended to a context-concept-cluster model (Zhao
et al., 2015). A context can represent a location, a
time point, or an object (e.g. file name) shared across
data sources. For example, in “information assur-
ance”, “information” is the context, “assurance” is the
concept.
In this paper, we want to show that the bi-gram
generated by LLA can also be a form of causal learn-
ing. The bi-gram contextual associations relate to the
three layers causal hierarchy (Pearl, 2018; Mackenzie
and Pearl, 2018) of association, intervention, counter-
Figure 1: An example of lexical link analysis.
KDIR 2019 - 11th International Conference on Knowledge Discovery and Information Retrieval
306
factual, as well as a few other key elements of causal
learning as detailed in the following sections.
5.1 Association
The common consensus is that data-driven analysis or
data mining can discover initial statistical correlations
and associations from big data. Human analysts need
to validate the correlations to make them causal. As-
sociations are extracted from historical data and then
cross-validated using validation data sets. The associ-
ations and correlations are further validated by human
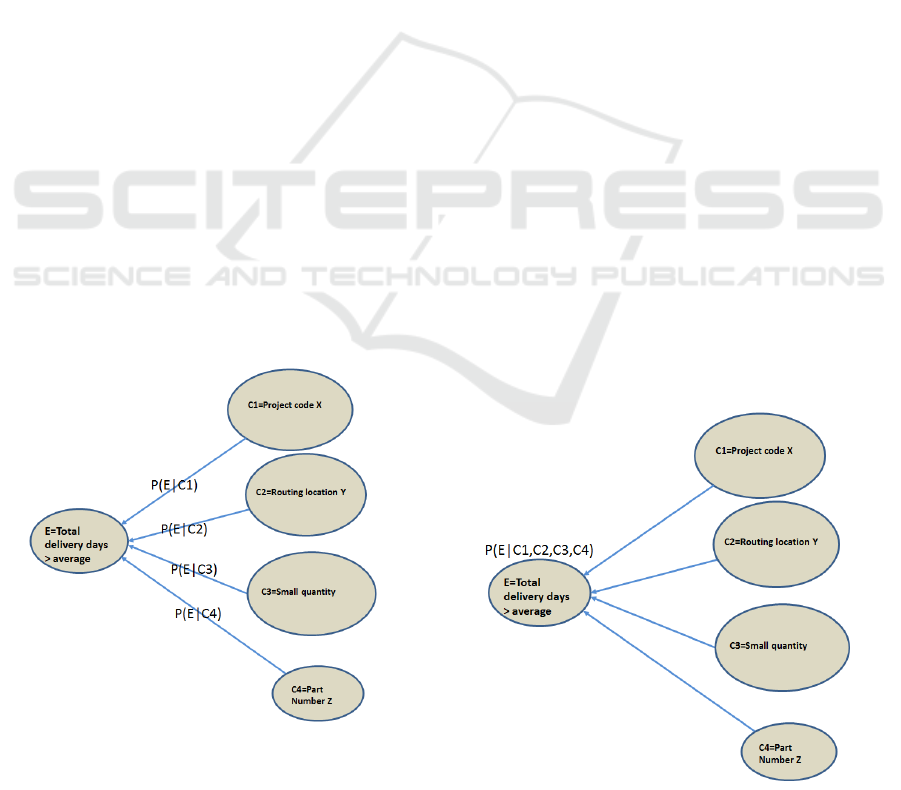
domain experts (Jones, 2018). Figure 2 shows con-
ceptually how the associations and correlations were
discovered by LLA in the use case. For example, we
discretized the total delivery days (response time) into
two categories (e.g. two effects):
1. E= total delivery days > average (e.g. 15 days for
the MV-22 Osprey)
2. Not E=total delivery days <= 15. We found
E is associated with a few possible factors
in terms of conditional probability P(E|C1 :
Pro jectCodeX ), P(E|C2 : RoutingLocationY ),
P(E|C3 : SmallQuantityOrder), and P(E|C4 :
PartNumberZ) as shown in Figure 2. This is
different from a traditional Bayesian network as
shown in Figure 3. A node in a Bayesian net-
work needs to compute the conditional proba-
bility P(E|C1,C2,C3,C4) based on all its parent
nodes. Conversely, LLA only computes the pair-
wise conditional probabilities. This allows us to
reason simply to remove the associations that are
not causal.
Figure 2: Pair-wise associations and correlations discovered
by LLA.
5.2 Intervention
Intervention ranks higher than association in the hi-
erarchy which involves taking actions and generat-
ing new data. A typical question at this level would
be: What will happen if we increase the intensity
of an action? For example, instead of examining
P(X|M), one might further ensure M is actionable or
P(X|do(M)) (Mackenzie and Pearl, 2018) can be ex-
amined. The answers to the question are more than
just mining the existing data. The action needs to
generate new data as an effect of the intervention to
determine if the underlying action causes to the de-
sired effect, or to determine how sensitive the effect
is to the cause. The intervention can be modeled as a
“treatment.” Effect is the potential outcome compared
to the control situation in the causal learning litera-
ture. Sensitivity is the “dosage” concept associated
with a “treatment”.
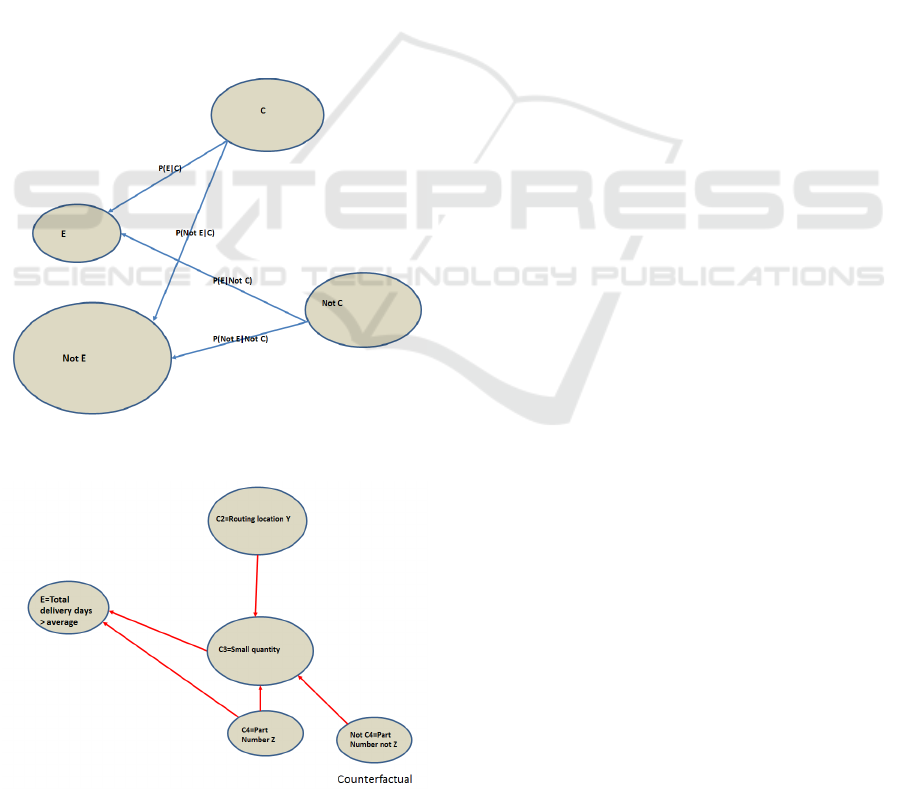
5.3 Counterfactuals
A typical question asked is: “What if I had acted
differently?” or counterfactual reasoning as shown in
Figure 4. P(E|C) and P(E|NotC) are the counterfac-
tuals needed in the reasoning. Traditionally, the effect
is defined as the outcome of a “treatment” for an en-
tity and for the same entity without the treatment, i.e.,
P(E|C) and P(E|NotC). However, since this causal
effect is impossible to directly observe for the same
entity, this is commonly referred to as the fundamen-
tal problem of causal inference (Gelman, 2018). The
potential-outcome or counterfactual-based model of
casual inference explores the idea of an entity-level
treatment effect, although it is unobservable as well,
Figure 3: Bayesian networks consider a conditional proba-
bility based all its parent nodes.
Causal Learning to Discover Supply Chain Vulnerability
307
it can be aggregated in various ways.
For example, the causal effect is typically mea-
sured using two randomized populations, one with
the “treatment” (or with C) and another one without
the “treatment” (Not C or control group). The two
populations are randomized to ensure they are similar
to each other (as if they were the same entity).
This is the Randomized Control Treatment (RCT)
theory, which is a standard practice found in social
sciences, drug development, clinic trials, and other
applications. With recent data-driven approaches
such as data mining and machine learning, people can
robustly estimate a local average treatment effect in
the region of overlap between treatment and control
populations, but inferences for averages, outside this
zone are sensitive to underlying machine learning al-
gorithms (Gelman, 2018). For instance, people have
moved to nonparametric models of machine learning
such as nearest neighbors (i.e., use the outcome of
the nearest neighbor of an entity as the surrogate for
the unobservable outcome of the same entity) and ran-
Figure 4: Comparison the four probability to remove non-
causal associations.
Figure 5: LLA and causal learning to discover supply chain
vulnerability.
dom forests (Wager and Athey, 2018) for better causal
learning since these methods can approximate the lo-
cal treatment and control populations close to an RCT
setting.
6 PUT THEM TOGETHER
Using LLA, we are able to
• First compare P(E|C), P(Not E|C), P(E|Not C),
and P(Not E|Not C). Choose the links that higher
than a predefined threshold shown in Figure 4.
• Choose among P(E|C1) − P(E|Not C1),
P(E|C2) − P(E|Not C2), P(E|C3) −
P(E|Not C3), and P(E|C3) − P(E|Not C3)
that are higher than a predefined threshold.
We can put causal learning elements together to
discover the links that impact the supply chain’s over-
all cost. For example, the cause for “longer than av-
erage total delivery time” might be a “small quan-
tity (C3)” or “part number Z (C4)” from which the
strong links point to E. Other factors are eliminated
because the links are below the thresholds. The com-
mon dilemma of causal learning for the network in
Figure 5 is that one can not decide which confounder
C3 or C4 causes E. However, by using LLA, we also
can discover a link between C3 and C4, i.e. P(C3|C4)
is greater than the threshold, therefore, C4 (part num-
ber Z) not C3 (small quantity) is the cause of E (de-
lay). Although “Not C4” or C2 also point to C3, but
they do not link to E, therefore, are not the causes for
E.
7 CONCLUSION
This research developed a potentially promising
methodology, demonstrating that through the use of
LLA, both weak and strong connections can be iden-
tified among a myriad of variables. This level of
connection can generate associations suggesting the
strength and effect of the counterfacturals as they
are considered toward sensitivity analysis, providing
causal learning in the process using pair-wise asso-
ciations. This study was able to discover supply
chain vulnerabilities from the investigated and ana-
lyzed data.
ACKNOWLEDGEMENTS
Authors would like to thank the Naval Research Pro-
gram at the Naval Postgraduate School. The views
KDIR 2019 - 11th International Conference on Knowledge Discovery and Information Retrieval
308

and conclusions contained in this document are those
of the authors and should not be interpreted as rep-
resenting the official policies, either expressed or im-
plied of the U.S. Government.
REFERENCES
Gelman, A. (2018). Donald rubin. Retrieved
from http://www.stat.columbia.edu/ gel-
man/research/published/rubin.pdf.
Haraburda, S. (2016). Transforming military support
processes from logistics to supply chain manage-
ment. Army Sustainment, 48(2), 1215. Retrieved from
http://search.proquest.com/docview/1785326764/.
Jones, J. P. (2018). Mv-22 supply chain agility: A static sup-
ply chain supporting a dynamic deployment. Naval
Postgraduate School Masters Degree Thesis, Mon-
terey, CA.
Mackenzie, D. and Pearl, J. (2018). The Book of Why: The
New Science of Cause and Effect. Basic Books, New
York, NY.
Pearl, J. (2018). The seven pillars of causal reasoning
with reflections on machine learning. Retrieved from
http://ftp.cs.ucla.edu/pub/stat ser/r481.pdf.
V-22 (2018). Marine aviation headquar-
ters marine corps. Retrieved from
http://www.aviation.marines.mil/About/Aircraft/Tilt-
Rotor/.
Wager, S. and Athey, S. (2018). Estimation and infer-
ence of heterogeneous treatment effects using random
forests. Journal of the American Statistical Associa-
tion, 113(523), 1228-1242.
Wilhite, A., Burns, L., Patnayakuni, R., and Tseng, F.
(2014). Military supply chains and closed-loop sys-
tems: resource allocation and incentives in supply
sourcing and supply chain design. International Jour-
nal of Production Research, 52(7).
Zhao, Y., MacKinnon, D., and Gallup, S. (2015). Big data
and deep learning for understanding dod data. Jour-
nal of Defense Software Engineering, Special Issue:
Data Mining and Metrics, July/August 2015, Page 4-
10. Lumin Publishing ISSN 2160-1577.
Causal Learning to Discover Supply Chain Vulnerability
309
