
Modeling and Analyzing for Human Body Blockage in Millimeter
Wave at 28 GHz in Crowded Indoor Environment
Hongmei Zhao
1
, Huikun Xu
1
, Jielei Zhao
1
, Xuebin Li
1
, Kunfeng Shi
1
1
School of Electric and Information Engineering, Zhengzhou University of Light Industry, Zhengzhou 450002, China
Keywords: Millimeter wave, Crowded indoor environment, Channel parameters, Transmitter height.
Abstract: Millimeter wave (mm-wave) communication is a promising way of wireless communication in the future.
This paper analyses mm-wave propagation characteristics, including path loss, shadow fading and delay
spread at 28GHz in a crowded meeting room scenario. In order to obtain more realistic simulation results,
we consider the electromagnetic parameters of human skin and clothes. At the same time, we set different
transmitter (TX) heights and compare the influence of different TX heights on channel parameters. The
result shows that path loss and delay spread would be increased due to the existence of human body
blockages. With the increase of TX heights, the path loss factor n would be decreased. All routes shadow
fading obey the normal distribution with a mean of 0. This paper provides a theoretical guiding for the
design of wireless communication system in a crowded indoor environment.
1 INTRODUCTION
With the proliferation of smart phones and other
wireless user devices, a heavy increase of
requirement for communication capacity and data
transmission rate are predicted (Islam et al., 2016).
How to provide more sufficient capacity to satisfy
users’ requirement is an urgent problem to solve,
especially in a crowded environment. Now, high-
frequency bands above 6 GHz start to catch people’s
eyes (Nakamura et al., 2017). Mm-wave (30-
300GHz) is regarded as a promising frequency band
to meet the needs of users. Mm-wave can provide
unprecedented bandwidth, however, the main
concern is that propagation paths cannot bypass
obstacles so that there are blockages caused by
human bodies and other objects, which could reduce
signal strength. The propagation paths are mainly
expected to be blocked by human bodies in a very
crowded area like meeting room, stadium and so on.
Clothes of different materials will also have an
influence on channel characteristics, furthermore,
different transmitter (TX) heights will also lead to
different path loss.
The TX usually plays an important role in system
performance during mm-wave propagation.
(Maccartney et al., 2017), (Bai et al., 2018)
compare the mm-wave system performance of
different antenna types. (Bile et al., 2018) has done
some researches to evaluate the influence of
distributed antennas on system performance in an
indoor meeting room, when TX number is from 1 to
4, spatial distribution of signal coverage become
more homogeneous. The line-of-sight path is
expected to last longer as the number of TX
increases, in other words, the adoption of distributed
TX settings can reduce the probability of blockages
occurring. But it does not consider the effect of
changes in TX height. The work in (Gapeyenko et
al., 2016) has shown that blocking probability
increases with human density and separation
between TX and receiver (RX) pairs. In addition, it
analyses the relationship between path loss and
distance between TX and RX. Furthermore, it
demonstrates the existence of the optimal TX height.
However, there are few studies about the influence
of height change of on channel parameters,
especially in such a crowded meeting room where
human occupancy rate is 100%.
Based on the theory of Shooting and Bouncing
Ray(SBR) method, this paper simulates a crowded
meeting room by Wireless InSite software and gets
channel parameters, including path loss, shadow
fading and delay spread at 28GHz. This paper is
organized as follows. Section 2 describes the
simulation environment including simulation
scenario, TX and RX parameters. In Section 3,
78
Zhao, H., Xu, H., Zhao, J., Li, X. and Shi, K.
Modeling and Analyzing for Human Body Blockage in Millimeter Wave at 28 GHz in Crowded Indoor Environment.
DOI: 10.5220/0008097800780083
In Proceedings of the International Conference on Advances in Computer Technology, Information Science and Communications (CTISC 2019), pages 78-83
ISBN: 978-989-758-357-5
Copyright
c
2019 by SCITEPRESS – Science and Technology Publications, Lda. All rights reserved
human body blockage effects are studied at 28GHz
in a crowded meeting room scenario where human
occupancy rate is 100%, the worst case for
communication. We also do some researches on the
influence of different TX heights on channel
parameters. And Section 4 provides concluding
remarks of this paper.
2 SIMULATION ENVIRONMENT
2.1 Scenario Model
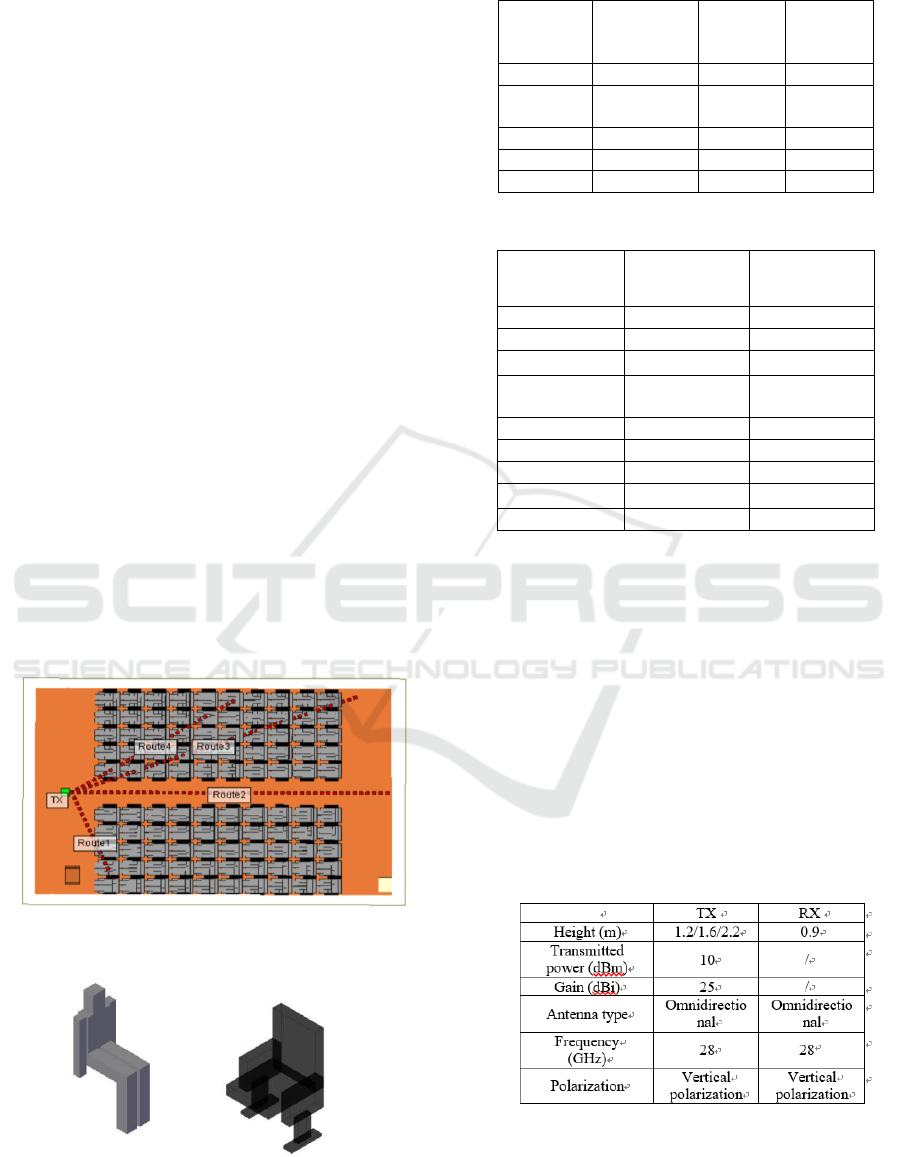
We build a simulation scenario similar to an indoor
meeting room where human occupancy rate is 100%,
as shown in Figure 1(a). This meeting room includes
a platform, an air conditioner, 100 chairs, 100 people,
three glass windows and two metal doors. The study
area is about 7m×11m ×2.8 m. The floor is wooden
floor, wall is gesso brick wall that thickness is 0.3m.
The human body and chair are shown in Figure 1(b).
The human body is consist of several different
rectangle parts, including head, upper body, arms,
thighs and calves, the detail sizes are shown in Table
1. In addition, we also consider properties of clothes
materials. All the human bodies wear randomly the
electromagnetic parameters clothes including cotton,
red leather and yellow leather. The permittivity of
the materials in this simulation at 28GHz is listed in
Table 2 (Chahat et al., 2011), (Harmer et al., 2008).
Figure 1 (a): 3D model for study area.
Figure 1(b): 3D model for human body and chair.
Table 1: The size of human body.
length/heig
ht
(cm)
width(c
m)
Thicknes
s
(cm)
Head
20
15
10
Supper
body
55
45
10
Thigh
52
15
10
Calf
48
15
10
Arm
60
10
10
Table 2: Materials property parameters.
Materials
Relative
permittivity
Conductivity
(S/m)
Dry wall
3.58
0.11
Glass
6.06
0.35
Gesso
2.02
/
Melamine
board
4.7
/
Metal
/
Cotton
1.7
0.038
Red leather
2.15
0.14
Yellow leather
2.3
0.09
Skin
10.05
7.32
2.2 Design on TX/RX
There are 3 TX (3.5m, 1m, 1.2/1.6/2.2m) which are
located in the front of the meeting room. Four
receive routes are shown in Figure 1 (a), Route1,
Route2, Route3, Route4; All RX heights are 0.9 m,
in order to study the spatial distribution of the delay
spread, the RX also distribute in grid throughout the
interior, and spacing is 0.2m. The gain of TX is
25dBi and the transmitted power is 10dBm. The
relevant parameters of TX and RX are shown in
Table 3.
Table 3: Simulation setup of TX and RX.
Modeling and Analyzing for Human Body Blockage in Millimeter Wave at 28 GHz in Crowded Indoor Environment
79
3 RESULTS AND ANALYSIS
3.1 Path Loss
In general, the path loss model formula can be
simply expressed as follows:
(1)
P represents the average envelope power, k is the
scaling factor, d is distance between the transceivers,
n is the path loss factor.
The simplified path loss model formula is also as
follows:
(2)
represents the received power (mw),
represents
the transmitted power (mw),
is the reference
distance, in general,
=1m. K is usually the free
space path gain at
, where:
(3)
Bring (3) into (2):
(4)
Transforming the truth value of path loss to dB,
which is the dB difference between
and
,
where:
(5)
Bring (4) into (5), and express it in logarithmic form
by taking logarithm on both sides,
(6)
Considering the uncertainty of the realistic
wireless communication environment, and various
shades complicate the environment so that received
signal is a superposition of multipath signal
including reflection, diffraction, penetration and so
on; especially in crowded indoor areas, more
multipath components are present. There is always a
mixed model between path loss and shadow fading,
where:
(7)
represents a Gaussian random variable with mean
μ and variance
.
We can obtain path loss data of receive Route1
when the TX height is 1.2m at 28 GHz by Wireless
InSite, for getting
and path loss factor n; let
,
,
. When
considering N pairs of observations (
,
(
,…,(
, the formula (7) should be
changed as follows:
(8)
represents random deviation of the
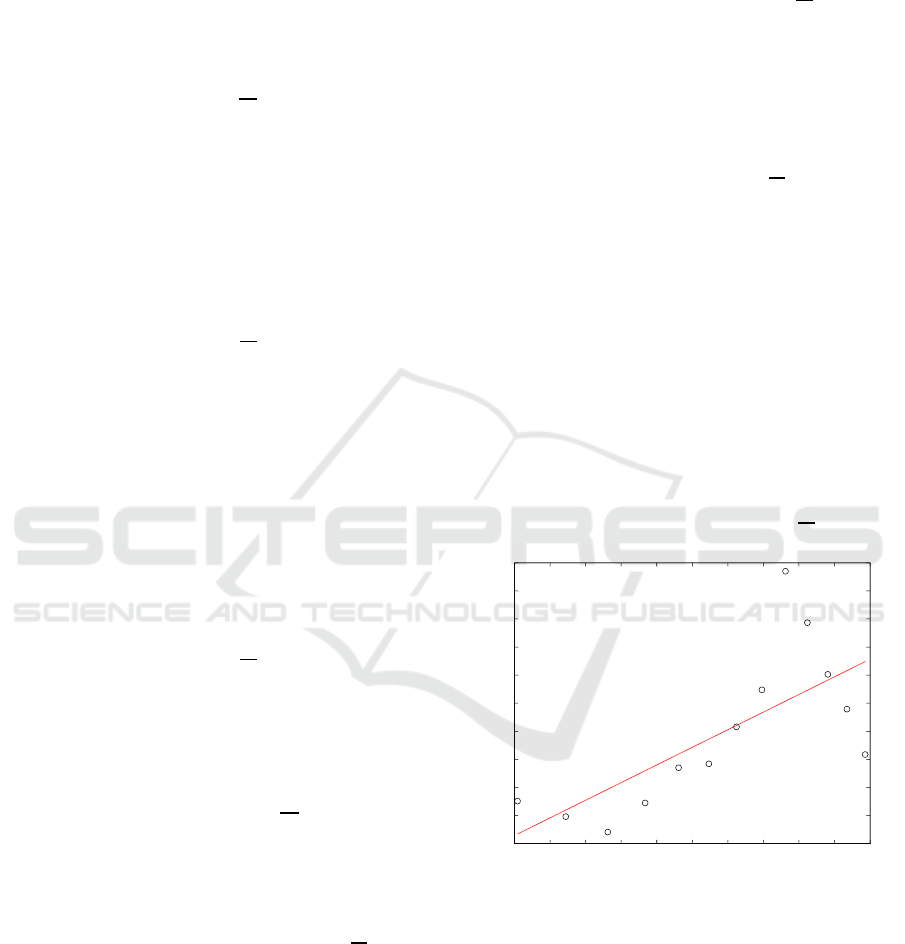
observation. Next, regression analysis is carried
out on the obtained data from Wireless InSite by
using the least square method, a=57.31, n=2.51,
Figure 2 describes the scatter-fitting line of Route1.
Path loss model formula on Route1 for TX1 is:
(9)
Figure 2: Route1 scatter-fitting line at TX1.
In order to evaluate the influence of different TX
heights on channel characteristics, we keep TX two-
dimensional position unchanged and set it into three
different heights. TX1, TX2 and TX3 heights are
1.2m, 1.6m and 2.2m, respectively. The linear
regression analysis of Route1-4 by least square
method find that all 4 paths conform to the formula
(7).
and path loss factor n on Route1-4 at
different TX heights obtained by regression analysis
are shown in Table 4.
0.5 1 1.5 2 2.5 3 3.5 4 4.5 5 5.5
58
60
62
64
66
68
70
72
74
76
78
Linear regression diagram
10log(d/d0)
Path Loss(dB)
CTISC 2019 - International Conference on Advances in Computer Technology, Information Science and Communications
80
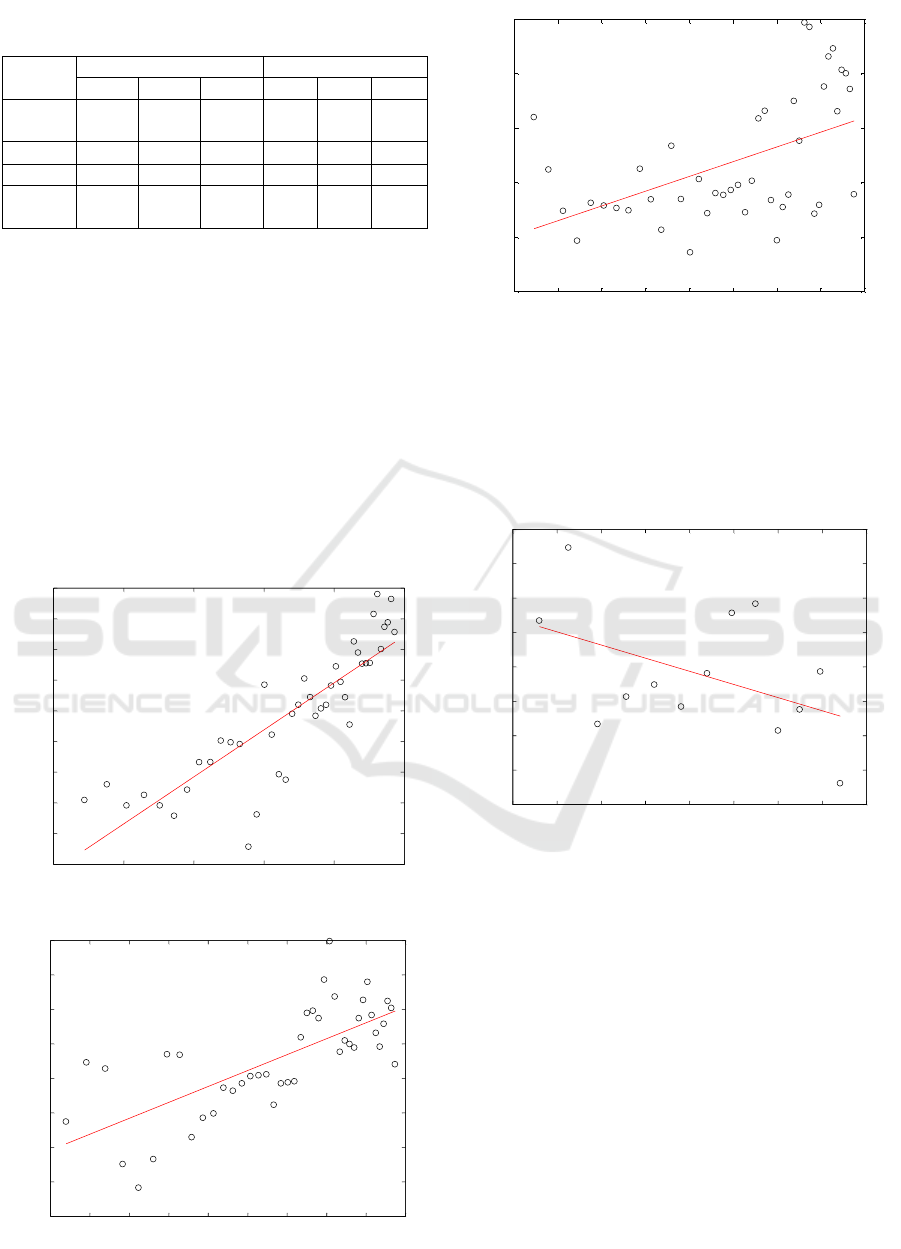
Table 4: Route1-4
and path loss factor n at
dierent TX heights.
Route
n
TX1
TX2
TX3
TX1
TX2
TX3
Route1
57.31
59.99
75.86
2.51
1.50
-
1.53
Route2
59.29
61.75
68.06
1.86
1.48
0.98
Route3
48.89
57.31
62.44
3.84
2.31
1.35
Route4
57.81
65.69
78.04
2.43
0.94
-
1.22
From Table 4, we find that as the increase of TX
height, all Route1-4
are increased. And all
path loss factor n are decreased. When TX height is
1.2m, Route2 path loss factor n is less than freedom
space path loss factor (n=2), however,
Route1,Route3 and Route4 path loss factor n are
greater than 2. The reason for this phenomenon is
that when the height of TX is 1.2m, Route2 is the
line-of-sight path, however, Route1, Route3 and
Route4 are blocked. In addition, Route3 has a more
serious blockage so that its path loss factor n is
greater than other routes whatever the TX height is.
Route3 scatter-fitting lines at different TX heights
are shown in Figure 3.
Figure 3(a): Route3 scatter-fitting line at TX1.
Figure 3(b): Route3 scatter-fitting line at TX2.
Figure 3(c): Route3 scatter-fitting line at TX3.
We can also know that when TX height is 2.2m,
Route1 and Route4 path loss factor n both are
negative by the Table 4. Route1 scatter-fitting lines
are shown Figure 4.
Figure 4: Route1 scatter-fitting line at TX3.
3.2 Shadow Fading
In part 3.1, we get a and n in the formula (8) by
analysing fitting regression of four routes at different
TX heights. However,
is still unknown, and we
will discuss more detail about it in order to verify
the shadow fading distribution characteristics. When
TX height is 1.2m, such as Route1 data, bring a and
n into (8), which could get
,
,,,,
. We
mentioned it in part 3.1 that shadow fading obeys
the normal distribution whose mean is μ and
variance is
, so we have the assumption:
) (10)
2 3 4 5 6 7 8 9 10
60
65
70
75
80
85
Linear regression diagram
10log(d/d0)
Path Loss(dB)
0 2 4 6 8 10
50
55
60
65
70
75
80
85
90
95
Linear regression diagram
10log(d/d0)
Path Loss(dB)
1 2 3 4 5 6 7 8 9 10
50
55
60
65
70
75
80
85
90
Linear regression diagram
10log(d/d0)
Path Loss(dB)
2 2.5 3 3.5 4 4.5 5 5.5 6
62
64
66
68
70
72
74
76
78
Linear regression diagram
10log(d/d0)
Path Loss(dB)
Modeling and Analyzing for Human Body Blockage in Millimeter Wave at 28 GHz in Crowded Indoor Environment
81
In addition, because the parameters are unknown,
the maximum likelihood method is used to estimate
parameters including μ and (Zhao et al., 2016).
(11)
We can find that the shadow fading of these
paths conforms to a normal distribution with a mean
of 0 regardless of the TX height. The shadow fading
distribution of each path at different TX heights is as
follows:
(12)
3.3 Delay Spread
Delay spread is a statistical variable, which is
closely related to the radio wave propagation
environment (time, region and user situation). It is a
statistical description of the delay characteristics of
multipath channels. The maximum and mean square
values of delay spread are used to measure the time
dispersion characteristics of the channel in multipath
fading. The coherent bandwidth of the channel is its
reciprocal, and the root-mean-square delay spread
can be expressed as follows:
(13)
represents average delay, represents the delay,
and
can be expressed as follows:
(14)
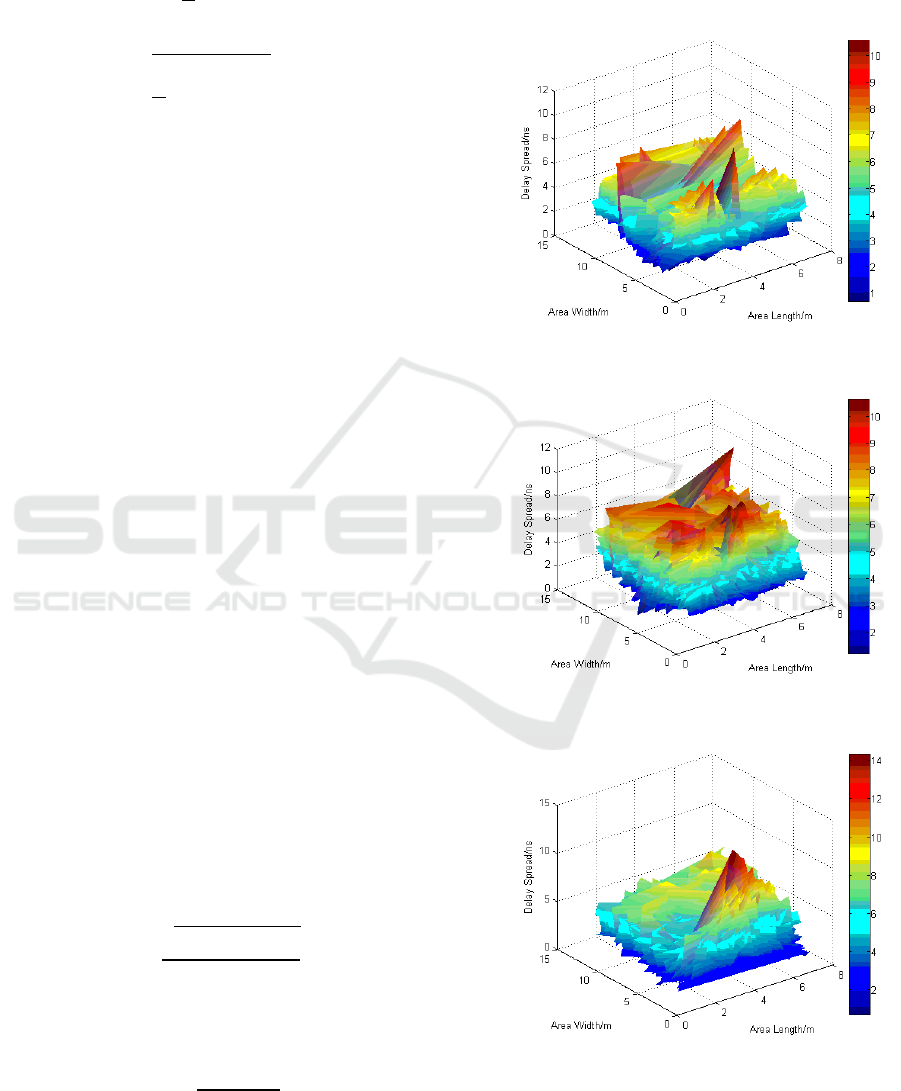
Delay spread plays an important role in
analysing the propagation characteristics of mm-
wave. As shown in Figure 5, it presents the
distribution of delay spread at different TX heights.
Figure 5(a): Distribution of delay spread at TX1.
Figure 5(b): Distribution of delay spread at TX2.
Figure 5(c): Distribution of delay spread at TX3.
CTISC 2019 - International Conference on Advances in Computer Technology, Information Science and Communications
82

By observing Figure 5, we can see that as the TX
height increases, the spatial distribution of delay
spread is not much different. The delay spread value
is the smallest in the position without blockage. On
the contrary, when there are blockages, such as a
human body or a chair, the delay spread will
increase correspondingly. Table 5 shows the
maximum, minimum and mean of the delay spread
in this meeting room at different TX heights. By
analysing the data in the Table 5, we can find that
the mean difference of delay spread at different
height is very small. The maximum delay spread is
basically the same when the TX height is 1.2m and
1.6m. But when the TX height is 2.2m, the
maximum delay spread is 14.30ns, which is nearly
4ns larger than the former. In addition, as the TX
height increases, there will be less blockage in the
process of mm-wave propagation, and the delay
spread value should be less. However, the mean
delay spread increases with the increases of TX
height. The main reason for this phenomenon may
be that the TX height increases, which results in the
increase of the distance between the TX and RX, so
the delay spread value also increases.
Table 5: Delay spread at different height.
Maximum(ns)
Minimum(ns)
Mean(ns)
TX1
10.57
0.71
3.78
TX2
10.61
1.22
4.88
TX3
14.30
0.69
4.81
4 CONCLUSIONS
Mm-wave would play a very important role in the
future wireless communication system. This paper
analyses mm-wave propagation characteristics at
28GHz in a crowded meeting room scenario. We
create the simulation scenario by Wireless InSite and
carry out simulation by SBR method. The result
shows that Route3 path loss factor n is always larger
than other routes regardless of TX height. Route 2
path loss factor n is less than freedom space path
loss factor (n=2) due to line-of-sight path. In
addition, we find that with the increase of TX
heights, all Route1-4
are increased, And
path loss factor n are decreased. All routes shadow
fading obey the normal distribution with a mean of 0.
When there are blockages, such as some human
bodies or chairs, the delay spread will increase
correspondingly. This paper provides a theoretical
guiding for the design of wireless communication
system in a crowded indoor environment.
ACKNOWLEDGMENTS
This paper is supported by the Joint Funds of
National Natural Science Foundation of China
(U1504604).
REFERENCES
Bai, T., Ashwin, S., Ozge, K., Li J., 2018. Modeling
and combating blockage in millimeter wave
systems. IEEE SigPort.
Bile, P., Sebastian, R., Dennis, M., et al., 2018.
Statistical Characteristics Study of Human
Blockage Effect in Future Indoor Millimeter and
Sub-millimeter Wave Wireless Communications.
Chahat, N., Zhadobov, M., Augustine R., et al., 2011.
Human skin permittivity models for millimetre-
wave range. Electronics Letters, 47(7), 427.
Gapeyenko, M., Samuylov, A., Gerasimenko, M.,
Moltchanov, D., et al., 2016. Analysis of human-
body blockage in urban millimeter-wave cellular
communications. IEEE International Conference
on Communications.
Harmer, S. W., Rezgui, N., Bowring, N., Luklinska,
Z., Ren, G., 2008. Determination of the complex
permittivity of textiles and leather in the 14–40
GHz millimetre-wave band using a free-wave
transmittance only method. Iet Microwaves
Antennas & Propagation, 2(6), pp. 606-614.
Islam, M. N., Subramanian, S., Partyka, A., et al.,
2016. Coverage and capacity of 28 GHz band in
indoor stadiums, IEEE Wireless Communications
and Networking Conference, Doha, pp. 1-7.
Maccartney, G. R., Deng, S., Sun, S., Rappaport, T.
S., 2017. Millimeter-Wave Human Blockage at
73 GHz with a Simple Double Knife-Edge
Diffraction Model and Extension for Directional
Antennas. IEEE Vehicular Technology
Conference.
Nakamura, M., Sasaki, M., Kita, N., Takatori, Y.,
2017. Path loss model in crowded areas
considering multiple human blockage at 4.7 and
26.4 GHz. IEEE Conference on Antenna
Measurements & Applications (CAMA). pp. 40-
43.
Zhao, H., Yao, H., Guo, S., 2016. Research on path
loss and shadow fading of ultra wideband
simulation channel. International Journal of
Distributed Sensor Networks. vol. 12, no.12, pp.
1–7.
Modeling and Analyzing for Human Body Blockage in Millimeter Wave at 28 GHz in Crowded Indoor Environment
83
