
Product Identification Based on Unsupervised Detection Keypoint
Alignment and Convolutional Neural Networks
Kang Le
1
1
School of Data and Computer Science, Sun Yat-sen University, No.132 Waihuan East Road, Panyu District, Guangzhou,
China
Keywords: Product identification, Keypoint alignment, Neural network, Data augmentation.
Abstract: Traditional shelf auditing is a manual audit. With the development of computer vision and deep learning
technology, it has become possible to use machine automatic image recognition instead of manual auditing.
Existing product identification is based on the use of two-dimensional code recognition and radio frequency
identification (RFID), which relies on hardware and is relatively expensive. The training data of product
identification is difficult to collect. This paper proposes a product identification method based on
convolutional neural network, and explores how to effectively obtain the product data sets. At the same time,
it introduces the unsupervised keypoint detection alignment method for the product detection part, and
proves that it can improve the correct rate of product identification.
1 INTRODUCTION
The initial product identification is achieved by
manual identification, but this method is labor
intensive(Merler M, 2007). The development of
technology has played an important role in
improving the efficiency of product identification.
Product detection and identification is an important
part of smart shelf auditing(Gül Varol, 2014).
Although the Product identification system has a
high recognition accuracy rate but relies on massive
data, there are many difficulties in collecting and
preparing data sets. Similarly, for product
identification, there is no uniform alignment method
for the goods. Most of the related tasks are not
aligned. The existing alignment methods are also
supervised to mark the keypoints first, but the
artificially labeled keypoints are different. The
merchandise is not robust, and the cost of manual
labeling is high. Face recognition is the recognition
after the alignment of the keypoints on the human
face. For the product identification, in the actual
scene, we need to identify the goods with the
rotation angle, but because of the labeling Such data
is very costly, and there is no alignment. However,
the accuracy of the product identification with the
rotation angle is less than the others. It makes sense
to align the items with stable keypoints and then
identify them. This paper proposes a product
identification method based on convolutional neural
network, explores how to effectively obtain product
datasets, compares the application of several data
augmentation methods in the augmentation of
product identification data, and finds an effective
method for data augmentation. Through experiments,
the application of several kinds of target
classification techniques in the field of product
identification was compared. At the same time, for
the product detection part, the unsupervised keypoint
detection alignment method is introduced to pre-
process, and the unsupervised keypoints obtained by
the inclined commodity utilization are aligned to
demonstrate the feasibility of improving the correct
rate of product identification.
2 RELATED RESEARCH
2.1 R-FCN
R-FCN(Jifeng Dai, 2016) solves the contradiction
between the location insensitivity of the
classification network and the sensitivity of
detecting network location. The RFCN proposes a
position sensitive score map (each position sensitive
score map represents a relative position of an object
class. For example, as long as a cat is detected in the
upper right corner of the image, a score map will be
160
Le, K.
Product Identification Based on Unsupervised Detection Keypoint Alignment and Convolutional Neural Networks.
DOI: 10.5220/0008099201600165
In Proceedings of the International Conference on Advances in Computer Technology, Information Science and Communications (CTISC 2019), pages 160-165
ISBN: 978-989-758-357-5
Copyright
c
2019 by SCITEPRESS – Science and Technology Publications, Lda. All rights reserved
activated. When the system sees a car in the lower
left corner, another score map will be activated. The
target position information is merged into the ROI
pooling layer.
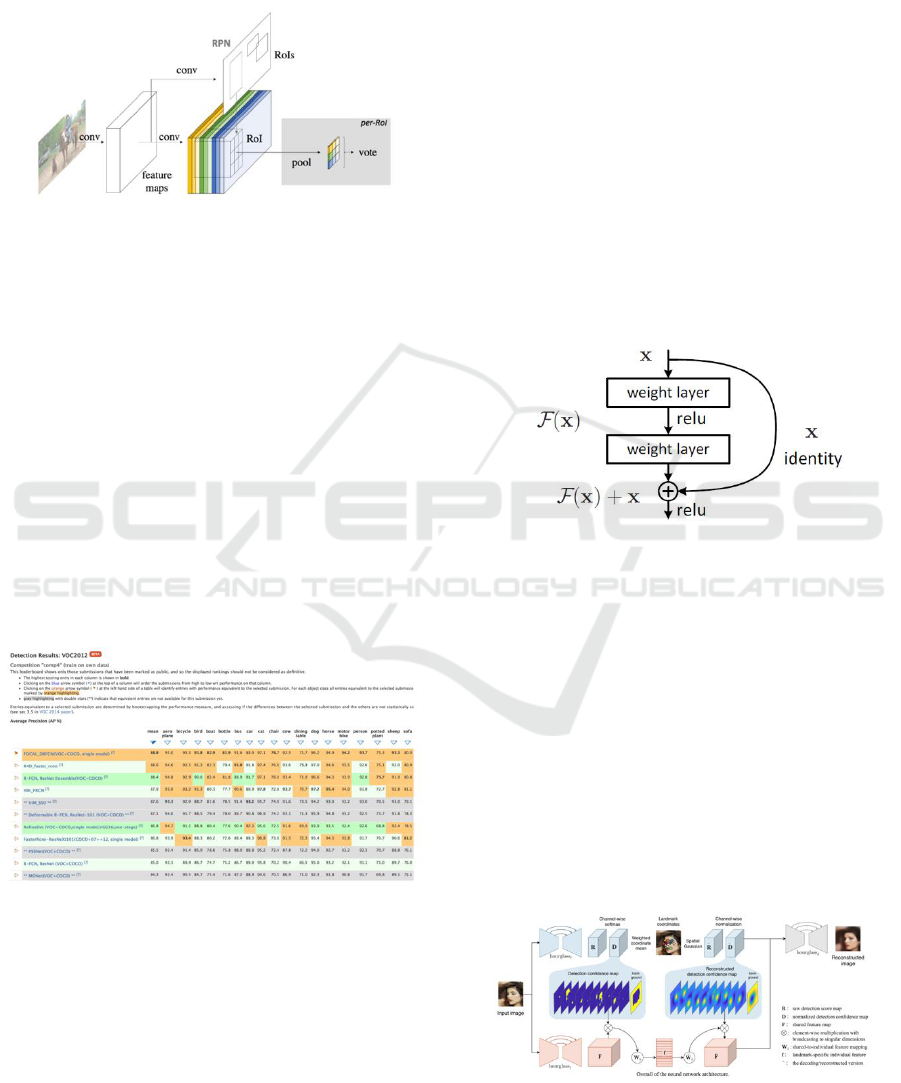
Figure 1: R-FCN network architecture.
Calculate k×k position-sensitive score maps for each
category in the last convolutional layer. Therefore there
are k×k×(C+1) channel output layers (C categories +
background), and k×k spatial grids are used to
describe relative positions. For example, K=3, a total of
9 spatial positions correspond to 9 positions of a category
object. Selective pooling is performed at the position-
sensitive RoIpooling layer, and each small block in the
k×k spatial grid responds to the corresponding position of
the k×k score map, and finally votes on the category score
to generate (c+1)-dimensional Confidence, and softmax to
get the final score for each class, and finally the border
regression. As can be seen from the latest target detection
rankings of PASCAL VOC 2012, the R-FCN accuracy
rate is 88.4%, ranking first. In the following experiments,
we used R-FCN as the detection framework.
Figure 2: Pascal VOC 2012 Target Detection Competition
Leaderboard.
2.2 Residual Network
The problem of gradient disappearance or gradient
explosion can be solved by using batch
normalization. ResNet (Kaiming He, 2015)mainly
solves the degradation problem of deep network.
When the network is deep, the correlation between
the back-graded gradients will get worse and worse,
and finally close to white noise. Images are locally
correlated, and gradients should have similar
correlations so that updated gradients make sense.
Resnet works well in maintaining gradient
correlation. From the perspective of gradient flow,
there is a gradient that is left as it is, and the
correlation is very strong. Equivalent to opening a
near-way at the side, using the congruent map to
directly pass the output of the previous layer to the
back, so that the input can be directly output, and
converted to learn a residual function F(x)= H(x) – x,
H(x) is the original desired output and x is the input.
F(x)=0 constitutes an identity map, and it is easier to
fit the residual. The residual network is a differential
amplifier.F(x) is the network map before summation,
and H(x) is the network map from input to
summation. Mappings that introduce residuals are
more sensitive to changes in output.
Figure 3: Shortcut Connection.
There are other deep network models, such as
VGG(K.Simonyan, 2015), GoogleNet(Christian
Szegedy, 2015), and Densnet(G.Huang, 2017).
Comprehensive speed, accuracy, calculation cost
and other factors, use ResNet as the identification
network.
2.3 Unsupervised Keypoint Detection
This method(Yuting Zhang, 2018) can learn object
structures in an image modeling process without
supervision. Mainly using the hourglass network,
this network is derived from the human posture
estimation in the stacked hourglass network.
Figure 4: Overall of the neural network architecture.
Product Identification Based on Unsupervised Detection Keypoint Alignment and Convolutional Neural Networks
161
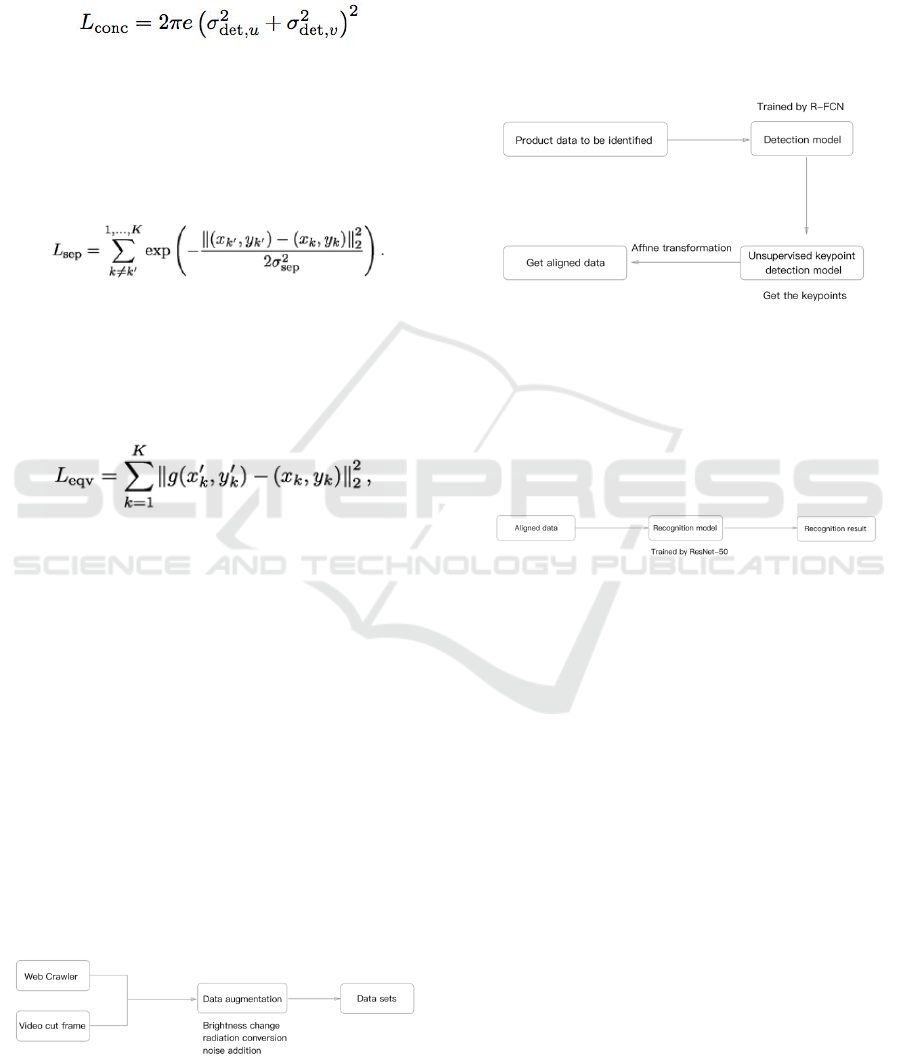
Three soft constraints:
a. concentration constraint
In short, the landmark is highlighted as much as
possible. Calculate the variance of the coordinates
on the two axes, designed as shown in the loss to
make the variance as small as possible.
b. separation constraint
Since the input at the beginning of the training is a
random distribution, it may cause the average
coordinates of the weighted landmark to be gathered
around the center, which may cause the separation to
be bad, so it falls into the local optima. Therefore,
the loss was designed.
c. equivariance constrain
It is that a landmard should still be well
positioned when transforming coordinates in another
image. The visual semantics should still exist in the
transformed image.
The current data set for unsupervised keypoint
detection has no product data, and this method does
not prove robust to rotating products. I did related
research in the later experiments.
3 PRODUCT IDENTIFICATION
RELATED WORK
3.1 Algorithm Framework
This section mainly proposes the algorithm
framework of this paper, which mainly includes
three modules: data collection and augmentation,
data unsupervised key point detection alignment and
product identification.
Figure 5: Data collection and augmentation
algorithm framework.
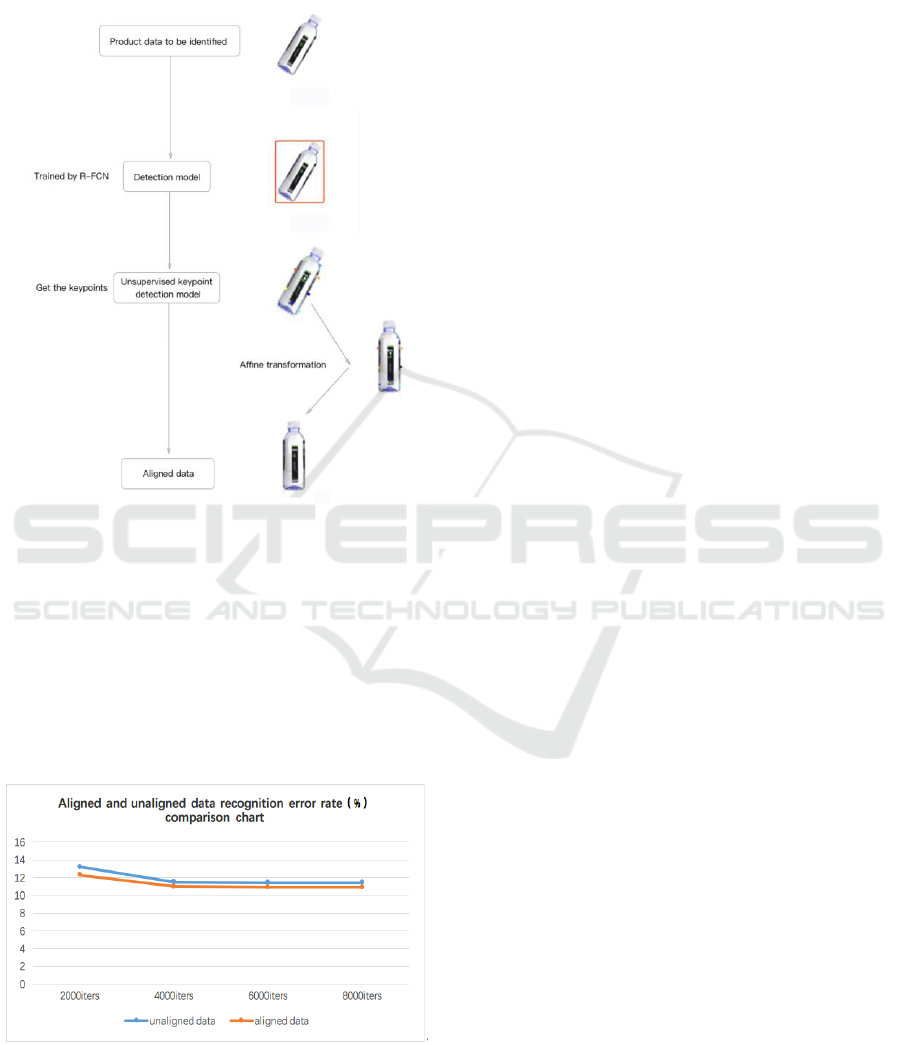
The product data to be identified is first input
into the detection model trained by the R-FCN
framework. After detecting the position of the
product, the part is input to the unsupervised
keypoint detection model to obtain keypoints, and
finally the coordinates of the keypoints are simulated.
The transformation is performed to obtain the
aligned product data.
Figure 6: Unsupervised keypoint detection
alignment algorithm framework.
The previous steps get the data after alignment.
Input the data into the recognition model trained by
resnet50 to obtain the recognition result.
Figure 7: Product identification algorithm
framework.
3.2 Data Collection
At present, there is a lack of public datasets for
product identification. This paper mainly collects
pictures of Jingdong, Taobao, Tmall and other
shopping platform users through the web crawler.
The two data collection methods are briefly
described below.
3.2.1 Crawl Data
In terms of data acquisition, first obtain relevant
product image data from the Internet. It is a good
source of product data. The whole process is
summarized as follows: (1) Crawling data of
products (2) Clean up some non-product images
through clustering (3) Remove the non-product part
of the photo by target detection (4) After manual
CTISC 2019 - International Conference on Advances in Computer Technology, Information Science and Communications
162
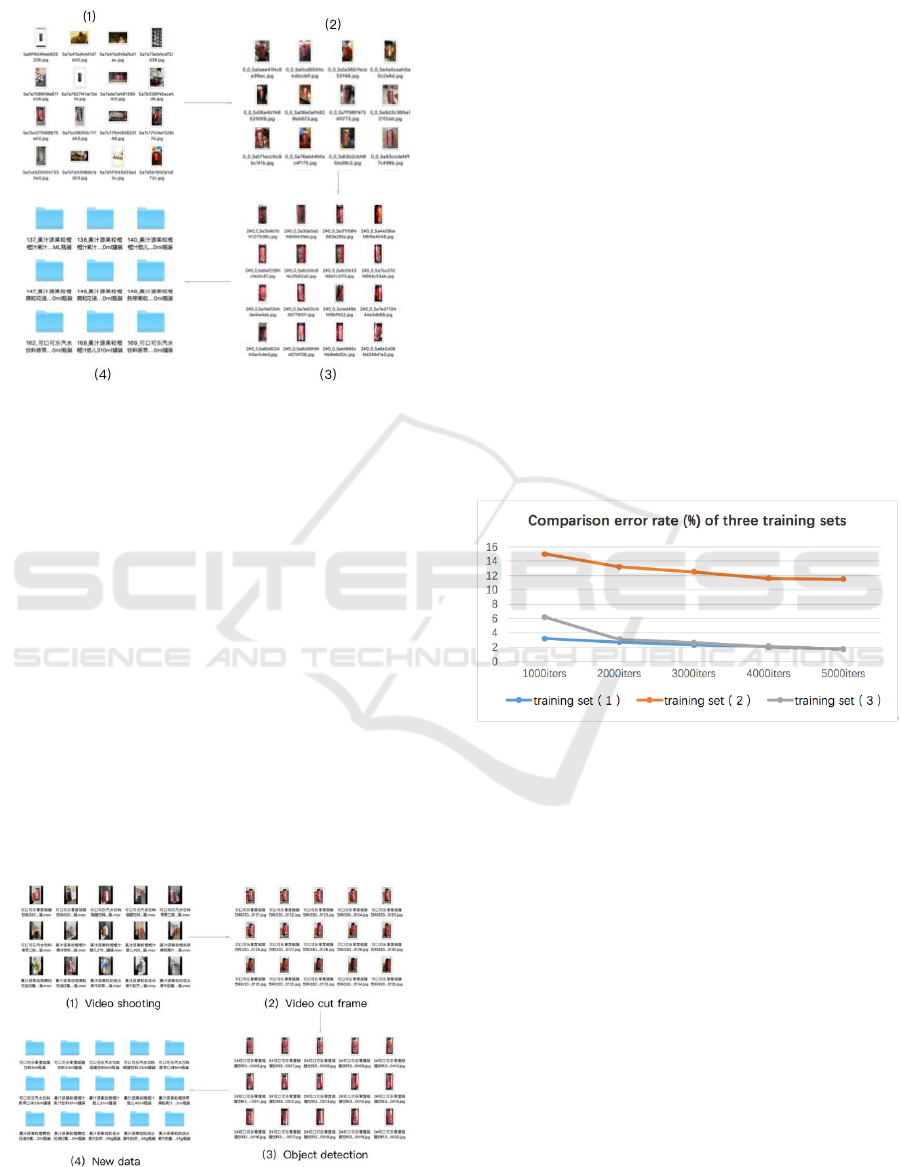
Filter to get the final product data set. The whole
process is shown in Figure 8.
Figure 8: Crawler acquisition data flow chart.
Through the web crawler, a total of 32 categories
were collected, each with about 105 images, for a
total of 3360 images. Among them, the largest class
has 215, and the least class has 46.
3.2.2 Video Cut Frame
The specific method is as follows: (1) Video
shooting of the goods in Section 3.2.1, taking into
account the changes in angle, light, etc., and the
shooting time of each product is about 2 minutes (2)
In the video of 2 minutes of each product, one frame
of image is taken every 20 frames as the source of
the data set of the product. (3) The non-product part
of each figure is cut by the object detection (4). The
product data obtained in this section is obtained. Join
the data set in Section 3.2.1 to form a more complete
data set. The whole process is shown in Figure 9.
Figure 9: video access data flow chart.
In this way, a total of 11565 video frame data is
obtained, plus 3360 pieces of original crawler data,
and a total of 14925 data sets. In order to verify the
experimental results, the author extracted 1000 of
the 3360 reptile data as a test set.
4 EXPERIMENT & ANALYSIS
4.1 Experiment of Data Collection
On the basis of the fixed test set (Section 3.2), this
paper designed a comparative experiment. The
training set of the experiment is: (1) crawler data
2360 (3360-1000) sheets; (2) video cut frame data
11565 sheets; (3) The crawler data video clip frame
data is 13925 sheets (2360+11565) sheets. The
differences in the recognition effects of the training
sets (1), (2), and (3) are compared. The results are
shown in Figure 10. This experiment identifies the
network using ResNet.
Figure 10: Comparison error rate (%) of three
training sets.
After experimental comparison, the following
conclusions: the data obtained by the reptiles is the
commentary photos taken by different users in
different environments. Video clip frame data as a
supplement to the data set can play a certain
optimization role. Therefore, in the experiments
below in this paper, the training set (3) is used as a
training set.
4.2 Experiment of Data Augmentation
In this paper, the original data set is augmented by
three common methods: brightness change, affine
transformation and noise addition. It has been
proved by experiments that the recognition accuracy
of the product dataset in Section 4.2 is increased by
0.3% through data augmentation.
Product Identification Based on Unsupervised Detection Keypoint Alignment and Convolutional Neural Networks
163
In order to further verify the effectiveness of
these three methods, based on the training set (2) in
Section 4.2, the data in this paper is augmented. The
specific method is: Random access to 11565 original
pictures Data amplification is performed in any of
the methods of 4.3.1, 4.3.2 and 4.3.3; the newly
obtained 11565 images are mixed into 11565
original images to form a new training set (4).
Similarly, do the same for the data set (3) to get the
data set (5). This paper compares the performance of
the test set described in Section 3.2.2 with training
set (2) and training set (4), training set (3), and
training set (5). The results are shown in Figure 11.
The experimental classification network uses ResNet.
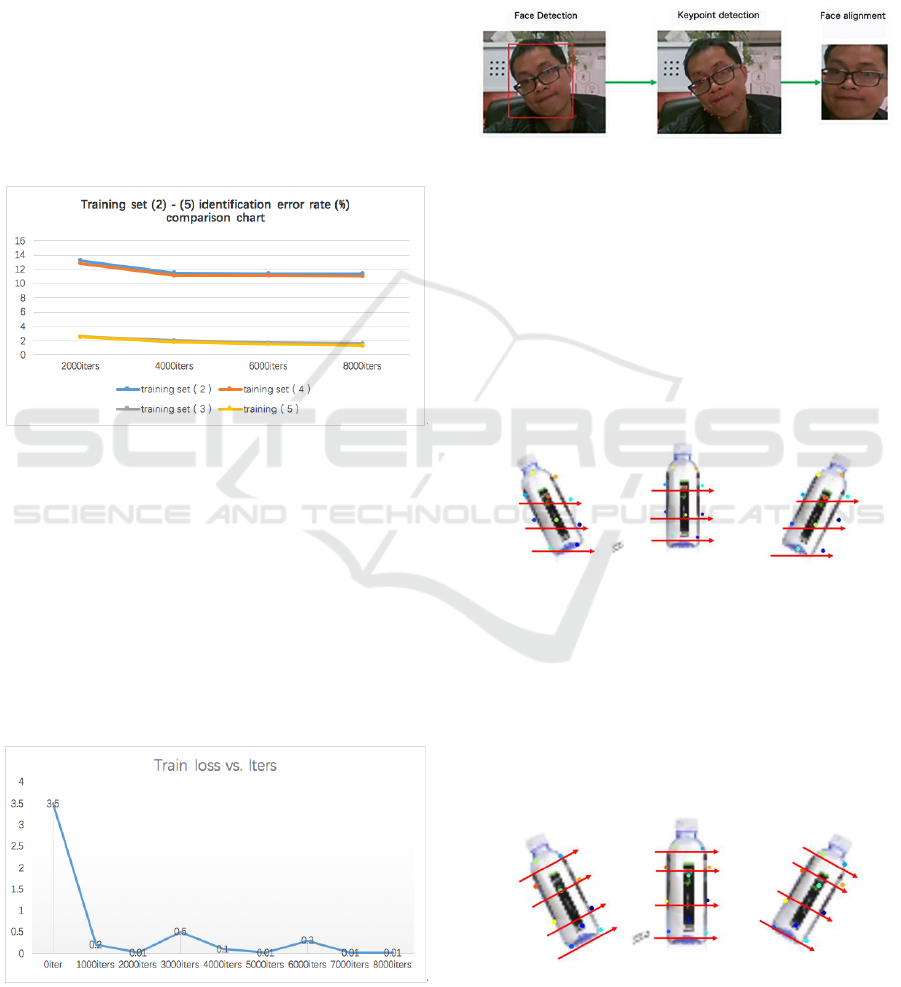
Figure 11: Training set (2) - (5) identification error
rate (%) comparison chart.
We can see that after the data is augmented, the
product recognition error rate of the training set (4)
is reduced by about 0.4% compared with the training
set (2) and the product identification error rate of the
training set (5). It is about 0.3% lower than the
training set (3). Figure 4-3 shows the change of loss
when training with training set (5). It can be seen
that the network has a good fitting effect.
Figure 12: Training set (5) training loss change chart
4.3 Experiment of Unsupervised
Keypoint Detection Alignment
There is no uniform alignment method for the
products. Most of the related tasks are not aligned.
Face recognition is achieved by first detecting the
key points and finally aligning them.
Figure 13: Face detection alignment.
Inspired by face recognition. Try to check the
validity of the unsupervised test in Section 2.3 to
verify its validity on the commodity data. The
experiment lets it generate 10 keypoints. 2700
original pictures compose training set. The
experimental results are shown in the figure 14. The
effect is very poor. The keypoints are not in the
relative position of the product, but in the relative
position of the picture.It cannot fight against rotation.
Figure 14: First model resul.
The first model results are not ideal, I have
augmented the training set. 2700 pictures + 2700
pictures of various angles generated by augmenting
100 different pictures, a total of 5400 pictures
compose training set. The experimental results are
shown in the figure 15. It can fight against rotation.
These key points can be used for data alignment.
Figure 15: Second model result.
CTISC 2019 - International Conference on Advances in Computer Technology, Information Science and Communications
164
Align the data according to the keypoints
obtained. The specific process is shown in the figure
below
Figure 16: Unsupervised keypoint detection
alignment.
The data of the test set is subjected to the
alignment operation as shown above before entering
the identification network. We use the recognition
model trained by the training set (2) to perform the
comparison experiment. Compare test sets to
identify conditions after alignment. The results are
shown in Figure 17.
Figure 17: Aligned and unaligned data recognition
error rate(%) comparison chart.
From Figure 17, we can see that the model
trained by the training set (2) reduces the product
identification error rate by about 0.5% after data
alignment, which proves the effectiveness of product
data alignment for improving recognition accuracy.
5 CONCLUSION
The product detection and recognition technology
realized in this paper can solve some problems in the
traditional manual audit mode to a certain extent. A
set of data collection methods for product
identification was proposed, and an effective data
augmentation method was found. The unsupervised
key point detection alignment method is introduced
to pre-process the data, and the unsupervised
keypoints obtained by the tilted product utilization
are aligned to demonstrate the effectiveness of
improving the correct rate of product identification.
REFERENCES
Yuting Zhang, Yijie Guo, Yixin Jin, Yijun Luo,
Zhiyuan He, Honglak Lee. Unsupervised
Discovery of Object Landmarks as Structural
Representations. In CVPR,2018
Jifeng Dai, Yi Li, Kaiming He, Jian Sun. R-FCN:
Object Detection via Region-based Fully
Convolutional Networks. In CVPR,2016
Kaiming He, Xiangyu Zhang, Shaoqing Ren, Jian
Sun. Deep Residual Learning for Image
Recognition. In CVPR,2015
Gül Varol,Rıdvan S. Kuzu. Toward Retail Product
Recognition on Grocery Shelves.In ICIVC,2014
Merler M,Galleguillos C,Belongie S.
Recognizing groceries in situ using in vitro
training data[C]//Proc of IEEE Conference on
Com- puter Vision & Pattern Recognition.[S. l. ]:
IEEE Press,2007: 1-8.
G. Huang, Z. Liu, K. Q. Weinberger, and L. van der
Maaten. Densely connected convolutional
networks[C]. In CVPR, 2017.
K. Simonyan and A. Zisserman. Very deep
convolutional networks for large-scale image
recognition[C]. In ICLR, 2015.
Christian Szegedy, Wei Liu, Yangqing Jia, et al.
Going Deeper with Convolutions[C]//Computer
Vison and Pattern Recognition.IEEE,2015:1-9.
Product Identification Based on Unsupervised Detection Keypoint Alignment and Convolutional Neural Networks
165
