
The Vehicle Data Value Chain as a Lightweight Model to Describe
Digital Vehicle Services
Christian Kaiser
1 a
, Andreas Festl
1
, Gernot Pucher
2
,
Michael Fellmann
3 b
and Alexander Stocker
1 c
1
Virtual Vehicle Research Center, Inffeldgasse 21a, Graz, Austria
2
TraffiCon – Traffic Consultants GmbH, Strubergasse 26, Salzburg, Austria
3
Department of Business Information Systems, University of Rostock, Albert-Einstein-Straße 22, Rostock, Germany
Keywords: Big Data, Big Data Value Chain, Vehicle Data Value Chain, Digital Vehicle Services, Connected Services,
Crowdsourcing of Data.
Abstract: Digitalization has become an important driver of innovation in the automotive industry. For instance, the
Quantified Self-movement has recently started spreading to the automotive domain, resulting in the provision
of novel digital vehicle services for various stakeholders such as individual drivers and insurance companies.
In this direction, a growing number of ICT start-ups from outside Europe have entered the market. Their
digital vehicle services are grounded on the availability of vehicle Big Data. Hence, to better understand and
capture this ongoing digital transformation, we introduce the Vehicle Data Value Chain (VDVC) as a
lightweight model to describe and examine digital vehicle services. Furthermore, we classify current digital
vehicle services offered by four start-ups and five car manufacturers by applying the VDVC, thereby
identifying commonalities and differences within three crucial steps: data generation, acquisition, and usage.
Additionally, we apply the VDVC to describe a digital mobility service provided by a European industry
consortium. This exemplary application serves to evaluate the VDVC and show its general applicability in a
practical context. We end our paper with a brief conclusion and an outlook on various current activities of
standardization organizations, the European Commission and car manufacturers related to the future of
vehicle services.
1 INTRODUCTION
Digitalization is an important driver of innovation
within all industries, including the automotive
industry (Accenture, 2016). While many
digitalization challenges in the automotive industry
are currently focused on bringing highly automated
driving into practice (McKinsey and Company,
2016), it is also a crucial topic of research to explore
how and which digital vehicle services can improve
the current practice of manual driving or even enable
novel applications for other stakeholders and other
markets outside the automotive domain.
The ongoing digitalization of passenger cars
could even rearrange stakeholder power relations in
the automotive industry. In the last decade, numerous
IT start-ups from outside Europe have created several
a
https://orcid.org/0000-0002-5738-766X
b
https://orcid.org/0000-0003-0593-4956
c
https://orcid.org/0000-0002-3758-1617
interesting digital services, exploiting data gained
from the vehicle on-board diagnostic (OBD)
interface, from additional sensors built into a
connected OBD plug-in device and/or from the
driver’s smartphone. This could lead to new business
models emerging in the automotive domain, some of
which have already attracted the attention of car
manufacturers. One prominent example is BMW i
Ventures and its recent investments in start-ups such
as Zendrive (2017) and Nauto (2017).
Two current key drivers of digitalization in the
automotive domain are the ever-increasing amount of
vehicle data generated and the capability of modern
information and communication technologies (ICT)
to transform these data into business value for various
stakeholder groups. These may include individual
stakeholders (e.g. vehicle drivers) as well as
68
Kaiser, C., Festl, A., Pucher, G., Fellmann, M. and Stocker, A.
The Vehicle Data Value Chain as a Lightweight Model to Describe Digital Vehicle Services.
DOI: 10.5220/0008113200680079
In Proceedings of the 15th International Conference on Web Information Systems and Technologies (WEBIST 2019), pages 68-79
ISBN: 978-989-758-386-5
Copyright
c
2019 by SCITEPRESS – Science and Technology Publications, Lda. All rights reserved

organizational stakeholders (e.g. insurance
companies, infrastructure operators, or traffic
operators). “Modern vehicles have up to one hundred
on board control units that constantly communicate
with each other to ensure the correct driving and
customer functionality” (VDA, 2016). Hence,
vehicles are already generating vast amounts of data
using in-vehicle sensors. Certain parts of these data
are safety-critical and will therefore not be allowed to
leave the passenger car, while the remainder can and
will be utilized to establish novel digital vehicle
services (as indicated by the European Parliament in
Directive 2010/40/EU (EU 2013)), which can go far
beyond merely assuring driving functionality and
safety.
Digital Vehicle Services are data processing
services operating inter alia on vehicle data, which
can provide added value to those consuming them. In
this context, the term ‘service’ can be considered
from two different points of view: On the one hand, a
‘service’ is understood as a piece of software
applying approaches from computer science to
transform and merge different sources of data (be it
raw or pre-processed) into new, enriched forms of
aggregated data. If done correctly, the value of these
enriched data is inherently higher than the sum of
values of the single datasets which were combined in
the process. On the other hand, a ‘service’ is
understood as something of economic relevance,
providing an added value to one or more stakeholder
groups as a service offering.
While the enormous amount of data available
today enables the creation of valuable digital services
in the first place, it also poses a great challenge with
regard to data processing. To create value, data must
be acquired, transformed, anonymized, annotated,
cleaned, normalized, aggregated, analyzed,
appropriately stored and finally presented to the end
user in a meaningful way. This implies that an entire
data value chain needs to be created, implemented
and monitored. With this in mind, we analyze,
summarize and provide insights into how existing
initiatives on the market tackle this challenge. Hence,
we aim to answer the following research question
from the emerging field of digital vehicle services
research: What is the underlying data value chain
enabling digital vehicle services and how can it be
applied to describe existing services?
To answer this research question, we first review the
literature on relevant concepts for digital vehicle
services, including Quantified Self, Big Data, and the
Internet of Things. Based on the Big Data Value
Chain as described by Curry (2016), we derive a
Vehicle Data Value Chain (VDVC) that is intended to
provide a structure and a frame of reference allowing
to systematically describe the transformation of data
into valuable services, to compare digital vehicle
services and to understand and explain the data-
related challenges associated with them in a second
step. In a third step, we apply the developed VDVC
and use it to finally classify current digital vehicle
services offered by four selected start-ups and five car
manufacturers.
After this introduction and a description of our
motivation in Section 1, we continue with the
relevance of (big) data from both a general point of
view and a vehicle-specific perspective in Section 2.
In Section 3, we describe how vehicle data are turned
into digital vehicle services, introducing the vehicle
data value chain as the underlying process of value
generation. We then apply this vehicle data value
chain to visualize and compare the digital product
innovations by selected start-ups (Automatic, Dash,
Vinli, Zendrive) and car manufacturers (BMW,
Honda, Mercedes, Porsche, Opel) in Subsection 3.3,
before we use the VDVC to analyze the digital
mobility service MoveBW in detail in Subsection 3.4.
Finally, in Section 4, we conclude the paper and
provide an outlook on various current activities
including standardization and other activities of the
European Commission and car manufacturers and the
ongoing research project AEGIS, which aims to ease
data fusion and the linking of data artifacts from
multiple data sources.
2 FROM DATA TO BIG VEHICLE
DATA
2.1 Data: One Aspect of Digitalization
More than a decade ago, Tim O’Reilly formulated his
extensively cited principles of the Web 2.0 (O’Reilly,
2005) including one principle about the emerging
value of data according to which “data is the next intel
inside”. Since then, the hype on how to generate
added value from all kinds of available data has been
building. Data is the new buzzword. A book by
Mayer-Schoenberger and Cukier (2013) on how Big
Data is changing our world has become an
international bestseller and been cited by researchers
more than 2964 times according to Google Scholar.
Big Data has received considerable attention from
multiple disciplines, including information systems
research (Abbasi et al., 2016) and database
management (Batini et al., 2015), to mention two of
them.
The Vehicle Data Value Chain as a Lightweight Model to Describe Digital Vehicle Services
69

The volume of data is growing exponentially. It is
expected that there will be more than 16 zettabytes
(16 Trillion GB) of useful data by 2020 (Turner et al.,
2014). It is just a logical consequence that data
generation, data analysis, data usage –
and related new business models – have found their
way into all areas of life. Homes are increasingly
equipped with smart meters, a replacement for
mechanic measurement of electricity usage, enabling
the emergence of digital services to assist home
monitoring and to optimize electricity usage.
Smartwatches can track the wearer’s behavioral data
and calculate periodic statistics such as daily, weekly,
or monthly walking distances including burned
calories per day, week, or month. Many people use
their smartphones when exercising to gather
information on their workout.
Smartphone apps such as Runtastic (2017a) and
Strava (2017) help to monitor how and where people
run or cycle, automatically calculating route, pace and
periodic statistics including mean speed, time per
kilometer, and calories burned. These apps even
allow sharing the aggregated data via social networks,
thus enabling benchmarking with peers and
increasing the joy of exercise. The pattern of
collecting, analyzing, and sharing data constitutes the
baseline for individual improvements. Instantly
calculated and visualized behavioral statistics are
easy to compare or share with peers on social media.
The collected information per se is not new to these
communities. For instance, experienced runners
started comparing their real and average time per
kilometer using stopwatches a long time ago.
However, the simplicity of digital services and the
fact that many friends on social media regularly post
about their exercising routine has motivated a whole
digital generation to track themselves, as 210 million
Runtastic app downloads demonstrate (Runtastic,
2017b). 30 million app sessions per month in Europe
produce a reasonable amount of big movement data,
which is sufficient for performing representative data
analyses and attracts various stakeholders including
Adidas.
To summarize, digitalization has greatly
simplified data collection and analysis methods
which used to be too complex and/or only available
to experts. Hence, more and more people are joining
the self-tracking movement and, in turn, produce
more and more data which can be exploited using
novel digital services.
2.2 The Big Data Value Chain
The internet age has spawned far more data on
anything than any other technical or organizational
innovation. Big Data refers to the current
conglomerate of newly developed methods and
information technologies to capture, store and
analyze large and expandable volumes of differently
structured data. In a definition by Demchenko et al.
(2013), the defining properties of Big Data are
Volume, Velocity, Variety, Value and Veracity, as
shown in Figure 1. Exploiting the new flows of data
can even improve the performance of companies, if
the decision-making culture is appropriate (McAfee
and Brynolfsson, 2012).
Big Data and intelligent things seem to have an
intimate relationship. While in the Web 2.0 era data
was mainly generated by humans sharing user-
generated content on portals including YouTube,
Wikipedia, or Facebook, the Internet of Things has
led to new patterns of data generation driven by
machines. Smart, connected objects equipped with all
kinds of sensors have now taken over this task (Porter
and Heppelmann, 2014 and 2015). The Quantified
Self phenomenon is making use of these data
generated by things (Swan, 2009 and 2015).
Quantified Self refers to the intention to collect any
data about the self that can be tracked, including
biological, physical, behavioral, and environmental
information. Making use of these data to establish
applications and services has become a major creator
of value. This value is created through
Figure 1: The 5 Vs of Big Data (Demchenko et al., 2013).
• Terabytes
• Records/Arch
• Transactions
• Tables, Files
• Batch
• Real/near-time
• Processes
• Streams
• Structured
• Unstructured
• Multi-factor
• Probabilistic
• Trustworthiness
• Authenticity
• Origin, Reputation
• Availability
• Accountability
• Statistical
• Events
• Correlations
• Hypothetical
5 Vs of
Big Data
Volume Velocity
ValueVariety
Veracity
WEBIST 2019 - 15th International Conference on Web Information Systems and Technologies
70

Figure 2: The Big Data Value Chain of Curry et al. (2014) / Curry (2016).
multiple activities which are chained together, while
the value of the output is steadily increasing.
The concept of a value chain was originally
introduced by Porter to describe a series of activities
of a company to create and build value (Porter and
Millar, 1985). This value chain concept can also be
applied to the data domain to describe activities
ranging from data generation to the usage of data in
data-driven services for the customer. Data value
chains are a model to describe data flows as a series
of steps, each of them transforming the value of data.
The concept of data value chains has already been
used to describe the value of Linked Data (Latif et al.,
2009) as well as of Big Data by Curry et al. (2014) as
illustrated in Figure 2. The Big Data Value Chain
mentions several steps of Big Data transformation in
the process of generating the data-driven result with
the maximum business value.
2.3 Big Data in the Context of Vehicles
Decades ago, vehicles were merely equipped with
mechanical components such as mechanic
handbrakes. However, electrification and comfort
requirements continuously led to an electrically
operated handbrake. The handbrake status (applied or
released) and its process status (handbrake is
applying/releasing) can be captured and used as input
for vehicle safety checks and other features. An
applied handbrake will automatically be released if
the driver starts driving to prevent damage. The data
generated through all these vehicle functions can be
captured and used within other scenarios, e.g. to
create statistics on how often a window is
opened/closed or how often somebody is wedged in.
Many vehicle sensors are currently only used to
offer functionality and/or to increase comfort and
safety. As sensors and car features may widely differ
from manufacturer to manufacturer and even per car
variant, there is not only one single truth about how
much data is effectively generated by a modern
vehicle today. For instance, the participants from the
EU project Automat (2017 and 2018) state that about
4000 CAN bus signals (one signal could be one
measurement value) per second create up to 1 GB of
data per CAN bus (without mentioning a sample rate).
According to Pillmann et al. (2017), there are
“usually 4-12 CAN busses in one car” (with varying
amounts of input signals).
Considering the current hype around bringing
highly automated driving into practice, several
camera, radar and LiDAR (light detection and
ranging) systems are additionally implemented
within vehicles to capture each angle of the vehicle’s
environment. Autonomous vehicles are forced to
exchange information with other vehicles (V2V) and
with the infrastructure (V2I), which will boost the
amount of available vehicle data enormously in the
future. Considering different countries and different
patterns of individual driving and mobility behavior,
bringing highly automated driving into practice can
be seen as a grand digitalization challenge.
However, while only some of these data can be
exploited for digital vehicle services (e.g. because the
sampling rate is too high or because some values are
simply not relevant) and while only a portion of these
data will be made accessible due to safety reasons
(EU, 2013), the remainder of accessible sensor data
from modern vehicles will most likely be sufficient to
design and develop a reasonable number of novel
digital vehicle services for various stakeholder
groups, including individual drivers, various
organizational customers, government authorities,
and the automotive industry (Kaiser et al., 2017). To
sum up, modern vehicles already constitute big
vehicle data generators.
Data Acquisition
• Structured data
• Unstructured data
• Event processing
• Sensor networks
• Protocols
• Real-time
• Data streams
• Multimodality
Data Analysis
• Stream mining
• Semantic analysis
• Machine learning
• Information
extraction
• Linked Data
• Data discovery
• ‘Whole world’
semantics
• Ecosystems
• Community data
analysis
• Cross-sectorial data
analysis
Data Curation
• Data quality
• Trust / provenance
• Annotation
• Data validation
• Human-Data
Interaction
• Top-down/bottom-
up
• Community / crowd
• Human computation
• Curation at scale
• Incentivization
• Automation
• Interoperability
Data Storage
• In-memory DBs
• NoSQL DBs
• NewSQL DBs
• Cloud storage
• Query interfaces
• Scalability and
performance
• Data models
• Consistency,
availability,
partition-tolerance
• Security and privacy
• Standardization
Data Usage
• Decision support
• Prediction
• In-use analytics
• Simulation
• Exploration
• Visualization
• Modeling
• Control
• Domain-specific
usage
The Vehicle Data Value Chain as a Lightweight Model to Describe Digital Vehicle Services
71

3 GENERATING BUSINESS
VALUE: FROM VEHICLE
DATA TO DIGITAL VEHICLE
SERVICES
3.1 Generating Business Value by
Leveraging the Self-tracking Trend
Many digital natives enjoy generating data anytime
and anywhere using mobile devices including
smartphones and smart watches. Increasing the
knowledge about oneself and eventually enabling
new discoveries while performing physical activities
including running or cycling has turned into a
business-relevant phenomenon. The behavior of
turning collected data about oneself into actionable
knowledge and insight which is valuable for other
stakeholders, too, has been termed Quantified Self.
Interestingly, the quantified self phenomenon has
recently been successfully transferred to the
automotive industry by US-based start-ups. In this
sense and quite analogously, Quantified Vehicles
(Stocker et al., 2017) imply a successful
transformation of data from different kinds of sensors
related to the vehicle (in-vehicle sensors, smartphone
and wearable sensors used by the driver) into
actionable knowledge, e.g. on the behavior of the
vehicle. This way, they generate value for different
kinds of stakeholders that are part of digital vehicle
data service ecosystems such as insurance or fleet
management providers, finally resulting in novel
digital vehicle services in various domains (Kaiser et
al., 2018b; Kaiser et al., 2019).
The pattern of self-tracking using consumer
devices, as portrayed by the Runtastic example, can
be easily transferred to vehicles: By default, vehicles
gather a plethora of vehicle operation data through
sensors and control units safeguarding a vehicle’s
functionality. However, these vehicle Big Data could
be used to enable a series of apps and services. In the
case of Runtastic, the combination of the company
and the high volume of generated data, i.e. knowledge
on where, how and how often users engage in
physical activity such as running, was considered
worth €220 million by the Adidas Group, which
acquired Runtastic in 2015 (Runtastic, 2015).
The market value for vehicle data is considered to
be even higher due to the importance of vehicles in
first world countries. A number of US-based ICT
start-ups seized this opportunity, now offering
smartphone and web applications providing insights
into vehicle-generated data, after they received up to
€25 million of funding from investors (Stocker et al.,
2017). Interestingly, while some car manufacturers
and suppliers (e.g. Magna International, Continental
ITS, and BMW i Ventures) are among the investors,
forming strategic partnerships with start-ups, others
participate in research projects and try to keep data-
related business in their own area of influence. This
holds for Volkswagen, for example, which
coordinates the EU project Automat to develop a
marketplace for vehicle lifecycle data (Stocker and
Kaiser, 2016). Furthermore, recent reports from the
German automotive industry association (VDA)
suggest that car manufacturers “have to hold a
stronger position in the future and may limit the
capabilities of third parties to freely access car data.”
To summarize, the potential of vehicle data seems to
be such that it has become a battle worth fighting
(Kaiser et al., 2017). But how can vehicle data
actually generate value?
3.2 The Vehicle Data Value Chain
In order to provide a structure and a frame of
reference allowing to systematically describe the
transformation of data into valuable services, to
compare digital vehicle services and to understand
and explain the data-related challenges associated
with them, a value chain for vehicle data can be used.
In this regard, we propose the Vehicle Data Value
Chain (VDVC) as a lightweight model. We derived
the VDVC from the Big Data Value Chain (Curry et
al., 2016, illustrated in Figure 2). We adapted Curry’s
value chain regarding the name, number and order of
stages to reflect our experiences from research
projects in the automotive domain. The stage of
(Vehicle) Data Generation was added as a separate
stage to explicitly reflect the origin of the data (e.g.
in-vehicle or related sensors). The stage (Vehicle)
Data Acquisition corresponds to Curry’s Data
Acquisition. Moreover, we have changed the order of
Curry’s stages of analysis and curation since we
interpret the terminology differently. For example,
Curry seems to include normalization procedures
implicitly within machine learning in the stage of
Data Analysis, whereas we consider this as an
important separate pre-processing step which
correlates with Curry’s stage of Data Curation.
Hence, we have re-named Curry’s stage of Data
Curation (Vehicle) Data Pre-processing, which is
followed by the stages (Vehicle) Data Analysis,
(Vehicle) Data Storage, and (Vehicle) Data Usage
(see Figure 3).
(Vehicle) Data Generation summarizes any sensors
which can capture data directly (throttle pedal
position) or indirectly (road surface condition). In the
WEBIST 2019 - 15th International Conference on Web Information Systems and Technologies
72

Figure 3: The Vehicle Data Value Chain derived from Curry (2016) and based on Kaiser et al. (2018).
case of direct influence, we mainly see three data
sources: In-vehicle sensors, smartphone sensors and
individual user device sensors (e.g. a pulse transmitter
belt). An indirectly influencing data source can be
literally any relevant data source, for instance a road
operator camera to indicate traffic flow. This process
step is not included in the Big Data process described
in Section 2.3, however, it is essential for the vehicle
data value chain, as the data origin indicates the
reliability and the influence type (direct, indirect).
(Vehicle) Data Acquisition is the process of
gathering the generated data. In-vehicle sensor data
per se is not directly accessible, as it is captured with
the purpose of safeguarding a vehicle’s functionality
and therefore only shared between the various
electronic control units via one of the vehicle’s CAN
buses. However, a filtered amount of these sensor
data is already accessible via the On-board diagnostic
(OBD) interface (Turker and Kutlu, 2015), which is
intended to be used by service staff to read generated
error messages. It is however possible to develop
plug-in devices with internet connection, to
effectively use the OBD-port as a sensor data source.
There are already some professional solutions with
data acquisition devices installed in the vehicle,
which directly read signals from the CAN bus in an
unfiltered way. To meet the requirements of the EU
Directive 2010/40/EU inter alia on the costless
provision of universal, road safety-related minimum
traffic information (EU, 2013), a standardized
interface would be feasible sooner or later. Data from
smartphones is acquired by using specific
applications, which are capable of gathering and
transmitting data. In the case of external data sources
restricted to sources accessible via the Internet, the
main issue are the different availability and quality
levels of the data. For example, APIs commonly limit
the number of requests allowed per time interval,
meaning that the acquisition process must be adapted
to respect these thresholds. Gathered data is stored for
(Vehicle) Data
Generation
• In-vehicle sensory: E.g. RPM and speed value
• Smartphone sensory: E.g. GPS signal, acceleration and gyroscope measurements
• User device sensory: E.g. pulse value, eye movement
(Vehicle) Data
Acquisition
• A plug or device reading signals from the vehicles’ on-board diagnostic (OBD) interface
• Device or standardized interface directly installed at the vehicles’ CAN bus to read CAN messages
• Smartphone applications collecting smartphone sensory data
• External data sources: E.g. traffic updates, online news, weather, social media, user added sources
(Vehicle) Data
Pre-processing
• Anonymization: E.g. respecting the privacy of the data generator, e.g. driver
• Annotation: E.g. adding semantics to the data
• Cleansing and normalization
(Vehicle) Data
Analysis
• Linked Data to model relations between data from different data sources
• Statistical approaches: E.g. using machine learning to detect and annotate events
• Information extraction
(Vehicle) Data
Storage
• Databases (both relational and non-relational)
• Big Data filesystems (e.g. Hadoop)
• Big Data file formats (e.g. Parquet, Avro)
(Vehicle) Data
Usage
• Digital vehicle services for different stakeholder groups (e.g. individual drivers, organizational
customers, government authorities and for the automotive industry): E.g. Visualization of safety
critical events on a map presented to a city planner
The Vehicle Data Value Chain as a Lightweight Model to Describe Digital Vehicle Services
73

further processing; the chosen storage and format
heavily depend on the following processing steps.
(Vehicle) Data Pre-processing describes any
anonymization, annotation, cleansing and
normalization activities before any data analysis is
conducted. Sensor values may include private user
information or may be erroneous, different sensors
may have their own sampling frequency and so on.
Data quality highly influences service quality. For
instance, if the GNSS signal accuracy is low, a trip
may not be linked to the correct road and may lead to
false conclusions.
(Vehicle) Data Analysis with the purpose of
extracting useful hidden information involves linking
data from different data sources, exploring data,
performing statistical analyses, using machine
learning algorithms, and, if needed, detecting events,
etc. For instance, weather data can be linked with the
vehicle speed on a certain road to detect if the driver
drives differently when the road is wet or icy.
(Vehicle) Data Storage “is the persistence and
management of data in a scalable way that satisfies
the needs of applications that require fast access to the
data” (Curry, 2016). In the case of vehicle sensor
data, persistent storage is usually achieved by using a
combination of classic relational databases (for meta-
data), Big Data file systems (for raw input data) and
so called “time series databases”, which allow fast
analyses on the stored contents.
(Vehicle) Data Usage covers all ways of user or
software interaction with the collected data and any
conclusions derived from it in the above-mentioned
process. The accessed data could either be regarded
as the end result of the process, in which case it will
be presented more or less directly to end users, or it
could serve as input for further processing steps,
forming a circular path in the processing chain.
3.3 Applying the VDVC to Describe
Digital Vehicle Services Offered by
US Start-ups and Prominent Car
Manufacturers
The Vehicle Data Value Chain (VDVC) introduced in
the previous section describes a set of activities to
create value out of vehicle data. Consequently, a
“vehicle data to service”-process can be derived from
the above mentioned VDVC. In this section, we aim
to apply the VDVC as a lightweight model to
characterize selected public digital vehicle services
offered by four start-ups and five car manufacturers.
The stages of (Vehicle) Data Curation to (Vehicle)
Data Storage of the value chain are part of the
respective digital vehicle service providers’ business
asset and are therefore not publicly available. In
addition, not all digital vehicle service providers can
be expected to publish a full list of third-party
stakeholders which have access to the vehicle data
acquired. However, in a second step we add a detailed
description of a single service called MoveBW,
which was co-developed by one of the authors, so that
we can give insights into the value chain of this
service.
Digital vehicle service providers we chose are
presented in Table 1. This table focuses on services
for individual drivers and explicitly observes the
following three process steps: (i) (vehicle) data
generation, (ii) (vehicle) data acquisition and (iii)
(vehicle) data usage. (Vehicle) data usage is
structured using four categories: (a)
Recommendation specifies all digital vehicle services
that give recommendations to the user, e.g. how to
improve fuel efficiency; (b) Vehicle status & trip
statistics lists services which represent the status of
the vehicle (e.g. remaining fuel) and statistics from
recent trips (e.g. a score representing the driver’s
cautiousness); (c) Access to vehicle features gives a
list of services which enable vehicle features to be
accessed using a smartphone application (e.g.
controlling the air conditioning); (d) Other contains
all services which go beyond the aforementioned
categories.
The resulting table shows that the various digital
vehicle services provided by start-ups and car
manufacturers (termed OEM for Original Equipment
Manufacturer) vary in terms of data generation, data
acquisition and data usage. For instance, start-ups
access in-vehicle data mainly by exploiting the OBD
interface, except for Zendrive, which relies on
smartphone sensors only. The OBD plug-in devices
used by the start-ups differ, as they have additional
sensors built in to capture additional data and
hardware to establish UMTS/WIFI connections for
transmitting data to the storage. The only exception is
Honda, which also uses the OBD plug solution. Car
manufacturers use the advantage they have as the
vehicle developer and rely on an integrated CAN bus
device that can capture vehicle data from far more
sensors than OBD-based devices. It is surprising that
the offered digital vehicle services somehow
resemble one another.
Due to limited information access, the
applicability of the VDVC for US tech start-ups and
prominent car manufacturers has been shown using
the steps Data Generation, Acquisition, and Usage
only. However, in the following section, we analyze
one mobility service where we have insights into the
full process using each step of the VDVC.
WEBIST 2019 - 15th International Conference on Web Information Systems and Technologies
74

Table 1: A digital vehicle service overview focusing on (Vehicle) Data Generation, Acquisition and Usage.
Table 1: A digital vehicle service overview focusing on (Vehicle) Data Generation, Acquisition and Usage
Service
Provider
Service
Purpose
Data Ge-
neration
Data Ac-
quisition
Data Usage for drivers including business customers
Automatic
(Start-up)
Driving
statistics
to infer
behavior
In-vehicle
sensors &
device
sensors
OBD
device
Vehicle status & trip statistics (driving behavior insights using a
score; event detection e.g. hard brakes or speeding; location & trip
tracking; business tagging; fill up logging; vehicle error messages;
crash alert)
Other: IFTTT (IF This Then That)
dash
(Start-up)
Driving
statistics
to infer
behavior;
Gamificati
on
In-vehicle
sensors &
device
sensors
OBD
device
Recommendation (improve fuel efficiency; ranked refueling places)
Vehicle status & trip statistics (driving behavior insights using a
score; location & trip tracking; fuel quantity; live speed, rpm,
engine load, etc.; vehicle error messages)
Other: gamification (rewards, leaderboard)
Vinli
(Start-up)
Ecosystem
with 40
Apps:
individual
purposes
In-vehicle
sensors &
device
sensors
OBD
device
Some known services: Amazon ‘Alexa’: trip statistic integration
when asked for (“Where is my car?”); IFTTT (IF This Then That)
programmable functionality; ‘Home Connect’: e.g. close garage
door when leaving with passenger car; etc.
Zendrive
(Start-up)
Gamificati
on, fleet
mgmt.
Smart-
phone
sensors
Smart-
phone
app
Recommendation (coach safe driving)
Vehicle status & trip statistics (driving behavior insights using
scores, e.g. Caution Score; location & trip tracking)
BMW (i)
Connected
Drive
(OEM)
Personal
mobility
assistant
In-vehicle
sensors &
external
sources
CAN bus
device
Recommendation (Navigation based on traffic status; parking place
recommend.)
Vehicle status & trip statistics (location & trip tracking; emergency
call; fuel quantity)
Remote access to vehicle features (unlocking; honking; air
conditioning)
Honda
(OEM)
Driving
statistics
to infer
behavior
In-vehicle
sensors &
device
sensors
OBD
device
Vehicle status & trip statistics (location & trip tracking even in car
parks; emergency call; fuel quantity; vehicle error messages)
Other: geo-fence alarms (leaves area)
Mercedes
me
(OEM)
Personal
mobility
assistant
In-vehicle
sensors &
external
sources
CAN bus
device
Recommendation (Navigation based on traffic status; fleet mgmt.)
Vehicle status & trip statistics (location & trip tracking; emergency
call; trip logging; fleet mgmt.)
Remote access to vehicle features (remote parking; unlocking; air
conditioning)
Opel
OnStar
(OEM)
Personal
mobility
assistant
In-vehicle
sensors &
external
sources
CAN bus
device
Vehicle status & trip statistics (location & trip tracking; emergency
call; fuel quantity, tire pressure, etc.; vehicle error messages)
Remote access to vehicle features (unlocking; honking)
Other: Privacy options
Porsche
Connect
(OEM)
Personal
mobility
assistant
In-vehicle
sensors &
external
sources
CAN bus
device
Recommendation (Navigation based on traffic status, including
hints for frequently used routes if navigation is turned off; parking
place recommend.)
Vehicle status & trip statistics (location & trip tracking; emergency
call; fuel quantity)
Remote access to vehicle features (Smartphone and vehicle
navigation are connected; unlocking; honking)
Other: smart home features (close garage door when leaving with
passenger car)
The Vehicle Data Value Chain as a Lightweight Model to Describe Digital Vehicle Services
75

3.4 Applying the VDVC to Describe
MoveBW, a Digital Vehicle Service
MoveBW is a regional, intermodal mobility service
offered by a European industry consortium and which
is currently being developed to increase the
compliance rate of transport users (e.g. the percentage
of people using a park and ride option) with regard to
the current transport strategy of the region. The
strategy mainly aims at meeting air quality targets and
reducing traffic jams all over the federal province of
Baden-Württemberg (Germany), including its
provincial capital Stuttgart.
Stuttgart is geographically located in a valley
basin, which has a negative effect on air pollution
with particulate matter. Thus, the city of Stuttgart
continuously develops transport strategies to better
comply with air quality regulations. In the past, these
strategies were communicated to the public using
radio traffic messages or electric traffic signs only.
However, the compliance rate and thus success were
comparably low. The new MoveBW mobility service
smartphone application aims to increase the
compliance rate, especially that of visitors new to the
region. It does so by including easy-to-use routing
functionalities which are connected to rewards:
Bonus points are granted if a user follows the
recommended route. Collected bonus points can later
be exchanged for immaterial or monetary values.
Users of the MoveBW smartphone application
can plan their trips in advance using the intermodal
journey planner. They can pick their preferred
combination of transport modes from different
options suggested to them. Additional information is
displayed, not only showing travel time, but also eco-
friendliness, travel costs and incentives gained (e.g.
public transport vouchers and CO2 savings).
Moreover, it is possible to directly book tickets for the
different modes of transport included in their
preferred journey and yet to receive only one bill. In
this way, transport services such as public
transportation, car sharing, bike sharing, and parking
space management are integrated conveniently,
encouraging users to make efficient use of all modes
Table 2: A digital vehicle service overview focusing on (Vehicle) Data Generation, Acquisition and Usage.
Table 2: A digital vehicle service overview focusing on (Vehicle) Data Generation, Acquisition and Usage
VDVC step
Description of MoveBW-Service
Data Generation
Various sensor data and basic reference data is considered, e.g.
- floating car data: average mean travel time per road segment based on
anonymized GNSS data of vehicles,
- stationary traffic measurement: rate of flow for single measurement locations,
- public transport: schedule and sometimes occupancy rate,
- car park interfaces: occupancy rate,
- park & ride interfaces: occupancy rate,
- air quality measurement units: air quality measurements and forecast (includes
weather forecast);
Data Acquisition
Querying the web APIs from the various data sources. Additionally, the smartphone App
which is used in Data Usage provides GNSS information, as this is used for on-trip routing
and to detect which means of transport the user actually uses to be able to reward if the
recommended option is used.
Data Pre-processing
Annotation, normalization and semantic extraction of data. Transformation of data to meet
a common reference basis (in this case a public transport grid, no typical geo-coordinates).
Furthermore, GNSS data from the smartphone App is anonymized (start- and end-
trajectories are truncated). In this step the data is hosted in a distributed database system
(e.g. PostgreSQL cluster)
Data Analysis
A dynamic routing algorithm which also takes the provided intermodal transport strategy,
CO2 savings, and personal preferences into account. A self-developed algorithm which
utilizes pgRouting (an open source project to extend PostGIS/PostgreSQL to provide
geospatial routing functionality) and the popular Dijkstra algorithm (to find the shortest
path between nodes)
Thus, the algorithm provides routing recommendations (weightings for routes)
Data Storage
A distributed database system, e.g. a PostgreSQL cluster
Data Usage
The MoveBW App currently being developed should help the commuter to choose a mode
of transport and guides the commuter to the selected destination in compliance with
environmentally-oriented traffic management strategies.
WEBIST 2019 - 15th International Conference on Web Information Systems and Technologies
76
of transport. The application also provides on-trip
navigation and information on traffic obstructions
such as construction works or accidents.
The MoveBW services are currently monitored
and evaluated in an extensive trial phase. Based on
the findings, both the digital service and traffic
control strategies will be revised, aiming to maximize
favored effects on the individual mobility behaviors
of traffic participants, for example by applying
different strategies for daily commuters and visitors.
The smartphone application is planned to be released
in the first quarter of 2019. Mock-ups of the current
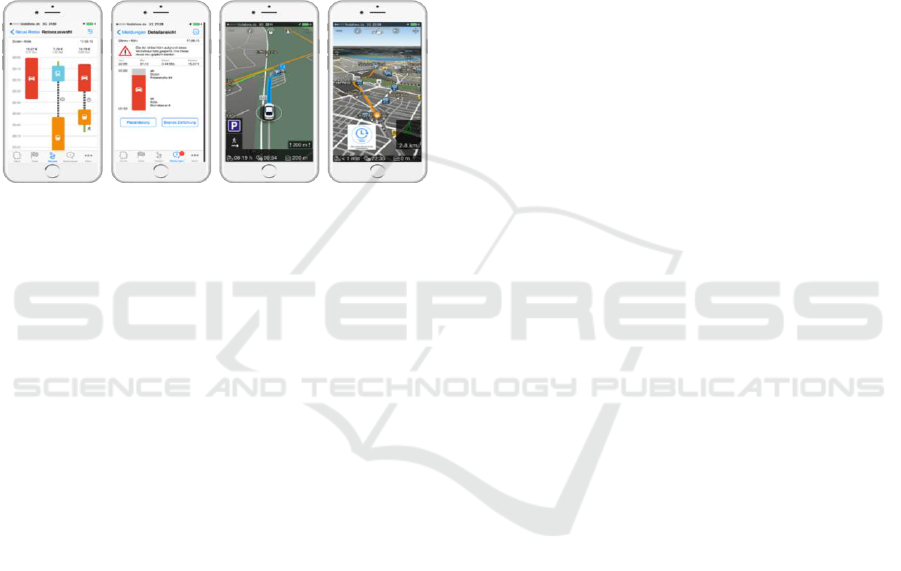
design are shown in Figure 4.
Figure 4: The MoveBW smartphone application provides
functions for intermodal journey planning, traffic
information, ticketing and on-trip navigation. (Source:
https://www.altoros.com/blog/mobile-devices-are-
propelling-industrial-iot-scenarios/).
Taking a wide range of data sources into account
for the intermodal routing algorithms in the MoveBW
App, data management becomes a challenge. The
Vehicle Data Value Chain introduced in Section 3
helps to provide a clearer view. Its application to the
underlying data transformation process, from Data
Generation to Data Usage, is shown in Table 2.
4 CONCLUSION AND OUTLOOK
Digitalization has become an important driver of
innovation in the automotive industry, enabling a
plethora of digital vehicle services. We have
presented a review of available digital vehicle
services offered by startups and car manufacturers
and described them applying the Vehicle Data Value
Chain (VDVC). Many of them were originally
motivated by the self-tracking phenomenon, which
has been transferred to the vehicle domain,
constituting quantified vehicles.
As an outlook, it should be mentioned that digital
vehicle services and the required technological
infrastructure to facilitate data acquisition, pre-
processing, analysis and storage, are currently a hot
topic in the automotive domain. There are already
initial ideas using blockchain technology and brokers
to make data sharing transparent and secure, as
described in Kaiser et. al (2018a). Yet, while some car
manufacturers invest in start-ups, others limit access
to data via the OBD interface, arguing that they are
not suitable for digital vehicle services (VDA, 2017;
ACEA, 2016). In contrast, the European Automobile
Manufacturers Association ACEA promotes car data
sharing (ACEA, 2017).
One reason for activities in this area is the
Commission Delegated Regulation (EU) No
886/2013 (regarding Directive 2010/40/EU on
Intelligent Transport Systems ITS) published by the
European Commission. It regulates the costless
provision of universal, road safety-related minimum
traffic information to users and requests car
manufacturers to provide safety-relevant data to the
public by making it accessible through national
contact points (EU, 2013).
Furthermore, the International Organisation for
Standardisation (ISO, 2017) has set up a
standardization work group titled ISO/TC 22/SC
31/WG 6 Extended Vehicle/Remote diagnostics (ISO
2018) to inter alia define access, content, control and
security mechanisms for the provision of vehicle data
for web services (VDA, 2017).
In parallel, a joint initiative of 17 EU Member
States and road operators is launching a solution for
C-ITS services in order to transmit information from
infrastructure (e.g. road side units) to the vehicle
cockpit, e.g. to inform about slow or stationary
vehicle(s), traffic jams ahead, weather conditions,
speed limits, etc. (C-ROADS, 2017).
Additionally, current EU-funded projects such as
the AEGIS Big Data project or EVOLVE are
developing solutions to ease the integration and
fusion of multiple data sources for the purpose of
service and business development using Linked Data
(AEGIS, 2017; EVOLVE, 2019; Latif et al., 2009).
“Linked data is a lightweight practice for exposing
and connecting pieces of data, information, or
knowledge using basic web standards. It promises to
open up siloed data ownership and is already an
enabler of open data and data sharing” (Rusitschka
and Curry, 2016).
To conclude, we expect the market of digital
vehicle services to grow tremendously in the future,
as the combination of vehicle data with data from
external sources (e.g. weather data, traffic data, open
data) will enable new scenarios for digital vehicle
services.
The Vehicle Data Value Chain as a Lightweight Model to Describe Digital Vehicle Services
77

ACKNOWLEDGEMENT
The EVOLVE project
(www.evolve-h2020.eu) has
received funding from the
European Union’s Horizon 2020
research and innovation program under grant
agreement No 825061. The document reflects only
the author’s views and the Commission is not
responsible for any use that may be made of
information contained therein.
REFERENCES
Abbasi, A., Sarker, S., Chiang, R.H., 2016. Big Data
Research in Information Systems: Toward an Inclusive
Research Agenda. Journal of the Association for
Information Systems, 17(2).
Accenture, 2016. Digital Transformation of Industries:
Automotive Industry. https://www.accenture.com/
t20170116T084448__w__/us-en/_acnmedia/Accenture
/Conversion-Assets/WEF/PDF/Accenture-Automotive
-Industry.pdf [last accessed May 2019]
ACEA (European Automobile Manufacturers Association),
2016. ACEA Position Paper: Access to vehicle data for
third-party services https://www.acea.be/publications/
article/position-paper-access-to-vehicle-data-for-third-
party-services [last accessed May 2019]
ACEA (European Automobile Manufacturers Association),
2017. http://cardatafacts.eu/ [last accessed May 2019]
AEGIS, 2017. https://www.aegis-bigdata.eu [last accessed
July 2019]
Automat, 2017. http://automat-project.eu/ [last accessed
May 2019]
Automat, 2018. http://automat-project.eu/sites/default/
files/automat/public/content-files/articles/AutoMat%
20D5%203_Full%20Prototype%20of%20Cross-Secto
rial%20Vehicle%20Data%20Services_final.pdf [last
accessed May 2019]
Automatic Homepage, 2017. https://www.automatic.com/
[last accessed May 2019]
Batini, C., Rula, A., Scannapieco, M., Viscusi, G., 2015.
From data quality to big data quality. Journal of
Database Management, 26(1), 60-82.
BMW (i) ConnectedDrive Homepage, 2017.
https://www.bmw-
connecteddrive.at/app/at/index.html#/portal/store [last
accessed May 2019]
Curry, E., Ngonga, A., Domingue, J., Freitas, A.,
Strohbach, M., Becker, T., 2014. D2.2.2. Final version
of the technical white paper. Public deliverable of the
EU-Project BIG (318062; ICT-2011.4.4).
Curry, E., 2016. The Big Data Value Chain: Definitions,
Concepts, and Theoretical Approaches. In New
Horizons for a Data-Driven Economy (pp. 29-37).
Springer International Publishing.
C-ROADS, 2017. https://www.c-roads.eu/fileadmin/
user_upload/media/Dokumente/Detailed_pilot_overvie
w_report_v1.0.pdf [last accessed May 2019]
Dash Homepage, 2017. https://dash.by/ [last accessed May
2019]
Demchenko, Y., Grosso, P., de Laat, C., Membrey P., 2013.
Addressing big data issues in Scientific Data
Infrastructure. 2013 International Conference on
Collaboration Technologies and Systems (CTS), San
Diego, CA, pp. 48-55. doi: 10.1109/CTS.2013.6567203
EVOLVE, 2019. https://www.evolve-h2020.eu/ [last
accessed July 2019]
EU, 2013. https://eur-lex.europa.eu/legal-content/
EN/TXT/?uri=CELEX:32013R0886 [last accessed
May 2019]
Honda myHonda Homepage, 2017. http://www.
honda.de/cars/services/my-honda/my-honda.html [last
accessed 07.09.2017]
Immonen, A., Ovaska, E., Paaso, T., 2017. Software Qual
J. https://doi.org/10.1007/s11219-017-9378-2
ISO, 2017. https://www.iso.org/committee/5383568.html
[last accessed May 2019]
Kaiser, C., Stocker, A., Viscusi, G., Festl, A., Moertl, P.,
Glitzner, M., 2017. Quantified cars: an exploration of
the position of ICT start-ups vs. car manufacturers
towards digital car services and sustainable business
models. In Proceedings of 2nd international conference
on new business models (pp. 336-350).
Kaiser, C., Steger, M., Dorri, A., Festl, A., Stocker, A.,
Fellmann, M., Kanhere, S., 2018a. Towards a Privacy-
Preserving Way of Vehicle Data Sharing–A Case for
Blockchain Technology?. In International Forum on
Advanced Microsystems for Automotive Applications
(pp. 111-122). Springer, Cham.
Kaiser, C., Stocker, A., Festl, A., Lechner, G., Fellmann,
M., 2018b. A Research Agenda for Vehicle Information
Systems. In Proceedings of European Conference on
Information Systems (ECIS) 2018.
Kaiser, C., Stocker, A., Fellmann, M., 2019. Understanding
Data-driven Service Ecosystems in the Automotive
Domain. In Proceedings of Americas Conference on
Information Systems (AMCIS) 2019.
Latif, A., Saeed, A. U., Hoefler, P., Stocker, A., Wagner,
C., 2009. The Linked Data Value Chain: A Lightweight
Model for Business Engineers. In A. Paschke, H.
Weigand, W. Behrendt, K. Tochtermann, T. Pellegrini
(eds.), Proceedings of I-Semantics 2009. 5th
International Conference on Semantic Systems (p./pp.
568--577), Journal of Universal Computer Science.
Mayer-Schoenberger, V., Cukier, K., 2013. Big Data: A
Revolution That Will Transform How We Live, Work,
and Think. Boston: Houghton Mifflin Harcourt. ISBN:
0544002695 9780544002692
McAfee, A., Brynjolfsson, E., 2012. Big Data: The
Management Revolution. Harvard Business Review,
90, 60--68.
McKinsey and Company, 2016. Automotive revolution –
perspective towards 2030: How the convergence of
disruptive technology-driven trends could transform the
auto industry.
WEBIST 2019 - 15th International Conference on Web Information Systems and Technologies
78

Mercedes me Homepage, 2017. https://www.mercedes-
benz.com/de/mercedes-me/ [last accessed May 2019]
Nauto, 2017. Nauto | Safe driving made simple.
https://www.nauto.com/ [last accessed May 2019]
O’Reilly, T. 2005. What is web 2.0. O'Reilly Media
Opel OnStar Homepage, 2017. http://www.opel.at/
onstar/onstar.html [last accessed May 2019]
Pillmann, J., Sliwa, B., Schmutzler, J., Ide, C., Wietfeld, C.,
2017. Car-To-Cloud Communication Traffic Analysis
Based on the Common Vehicle Information Model. In
IEEE Vehicular Technology Conference (VTC-Spring)
Workshop on Wireless Access Technologies and
Architectures for Internet of Things (IoT) Applications.
Presentation slides: http://automat-project.eu/sites/
default/files/automat/public/content-files/articles/VTC
_Presentation.pdf [last accessed May 2019]
Porsche Connect Homepage, 2017. https://www.
porsche.com/germany/connect/ [last accessed May
2019]
Porter, M.E., Millar, V.E., 1985. How information gives
you competitive advantage.
Porter M., Heppelmann J.E., 2014. How Smart, Connected
Products Are Transforming Competition, Harvard
Business Review, November 2014.
Porter M., Heppelmann J.E., 2015. How Smart, Connected
Products Are Transforming Companies, Harvard
Business Review, October, 2015.
Runtastic, 2015. Adidas Group acquires Runtastic:
www.adidas-group.com/en/media/news-archive/press-
releases/2015/adidas-group-acquires-runtastic [last
accessed May 2019]
Runtastic, 2017a. https://www.runtastic.com/en [last
accessed May 2019]
Runtastic, 2017b. https://www.runtastic.com/en/
mediacenter/press-releases/20170503_de_office-
opening-runtastic [last accessed May 2019]
Rusitschka, S., Curry, E., 2016. Big Data in the Energy and
Transport Sectors. In New Horizons for a Data-Driven
Economy (pp. 225-244). Springer International
Publishing.
Stocker, A., Kaiser, C., 2016. Quantified car: potentials,
business models and digital ecosystems. E & i
Elektrotechnik und Informationstechnik, 133(7), 334-
340.
Stocker, A., Kaiser, C., Fellmann, M., 2017. Quantified
vehicles. Business & information systems engineering,
1-6.
Strava, 2017. https://www.strava.com/?hl=en [last accessed
May 2019]
Swan M., 2009. Emerging Patient-Driven Health Care
Models: An Examination of Health Social Networks,
Consumer Personalized Medicine and Quantified Self-
Tracking, Int. J. Environ. Res. Public Health 2009, 6(2),
pp 492-525; doi:10.3390/ijerph6020492
Swan M., 2015. Connected Car: Quantified Self becomes
Quantified Car, Journal of Sensor and Actuator
Networks, 4(1) pp2-29.
Turker, G.F., Kutlu, A., 2015. Methods of monitoring
Vehicle’s CAN data with mobile devices. Global
Journal of Computer Sciences. 5(1), 36-42. doi:
http://dx.doi.org/10.18844/gjcs.v5i1.31
Turner, V., Gantz, J. F., Reinsel, D., Minton, S., 2014. The
digital universe of opportunities: rich data and the
increasing value of the internet of things. Rep. from
IDC EMC.
VDA, 2016. Access to the vehicle (and vehicle generated
data). https://www.vda.de/en/topics/innovation-and-
technology/network/access-to-the-vehicle.html [last
accessed 03.05.2017]
VDA, 2017. Normung. https://www.vda.de/de/
themen/sicherheit-und-standards/normung/normung.
html [last accessed May 2019]
Vinli Homepage, 2017. https://www.vin.li/ [last accessed
May 2019]
Zendrive Homepage, 2017. Zendrive | Making Roads Safe
Using Data and Analytics. https://www.zendrive.com/
[last accessed May 2019]
The Vehicle Data Value Chain as a Lightweight Model to Describe Digital Vehicle Services
79
