
Data Analytics for Smart Manufacturing: A Case Study
Nadeem Iftikhar
1
, Thorkil Baattrup-Andersen
2
, Finn Ebertsen Nordbjerg
1
, Eugen Bobolea
1
and Paul-Bogdan Radu
1
1
University College of Northern Denmark, Aalborg 9200, Denmark
2
Dolle A/S, Frøstrup 7741, Denmark
Keywords:
Industry 4.0, Data Analytics, Smart Manufacturing, Logistic Regression.
Abstract:
Due to the emergence of the fourth industrial revolution, manufacturing business all over the world is chang-
ing dramatically; it needs enhanced efficiency, competency and productivity. More and more manufacturing
machines are equipped with sensors and the sensors produce huge volume of data. Most of the companies do
neither realize the value of data nor how to capitalize the data. The companies lack techniques and tools to
collect, store, process and analyze the data. The objective of this paper is to propose data analytic techniques
to analyze manufacturing data. The analytic techniques will provide both descriptive and predictive analysis.
In addition, data from the company’s ERP system is integrated in the analysis. The proposed techniques will
help the companies to improve operational efficiency and achieve competitive benefits.
1 INTRODUCTION
Industry 4.0 is a name given to the current trend of
automation and data exchange in manufacturing tech-
nologies (Wiki), where new technologies merge the
physical, digital and biological spheres. Industry 4.0
requires no human involvement in manufacturing and
depends on artificial intelligence, machine learning
and big data technologies. Dolle
1
is a market leader
in Europe for wooden loft ladders. In order to retain
the prospective and competitive position in the inter-
national market and to optimize productivity, Dolle
relies on business analytics. Business analytics can
be used to explore large volumes of data, expose un-
detected patterns, correlations and other new key pro-
duction parameters.
Industry proven Cross-industry Standard Process
for Data Mining (Chapman et al., 1999) is used in
Dolle’s business analytics. It consists of following
phases: business understanding, data understanding,
data preparation, modeling, evaluation and deploy-
ment. This paper presents data analytic techniques
capable of performing both descriptive and predic-
tive analysis. In order to demonstrate the techniques,
a real-world case study from manufacturing indus-
try is selected. The sensor, alarm and enterprise re-
source planning (ERP) system data provided by the
1
www.dolle.eu
case study is first consolidated at a central repository.
Then, an exploratory analysis is performed in order to
gain insight into the real business problems. Further,
a predictive analysis using machine learning is per-
formed. To summarize, the main contributions in this
paper are as follow: (1) Proposing a data pipeline to
handle ingestion, processing and analysis; (2) Provid-
ing an in-depth exploratory analysis of the data; (3)
Presenting a statistical-based model to predict costly
production line disruptions; and (4) Comprehensive
evaluation of the equipment effectiveness and the per-
formance of the proposed model.
The paper is structured as follows. Section 2 de-
scribes the objectives and requirements from a busi-
ness perspective. Section 3 provides initial data un-
derstanding. Section 4 provides data pipeline and
exploratory analysis. Section 5 presents the model.
Section 6 evaluates the equipment effectiveness and
model performance. Section 7 presents the related
work. Section 8 concludes the paper and points out
the future research directions.
2 BUSINESS UNDERSTANDING
The focus of this section is to understand the basic
concepts of smart manufacturing in consultation with
domain experts. Project objectives are derived from
the viewpoint of Dolle requirements and later con-
392
Iftikhar, N., Baattrup-Andersen, T., Nordbjerg, F., Bobolea, E. and Radu, P.
Data Analytics for Smart Manufacturing: A Case Study.
DOI: 10.5220/0008116203920399
In Proceedings of the 8th International Conference on Data Science, Technology and Applications (DATA 2019), pages 392-399
ISBN: 978-989-758-377-3
Copyright
c
2019 by SCITEPRESS – Science and Technology Publications, Lda. All rights reserved

verted into data science problem definitions. Some
of Dolle’s primary objectives, from a business per-
spective are described as follow. When machines are
started, Dolle would like to know how long it takes
before the right output pace with regards to the prod-
uct manufactured is achieved. Output pace is the av-
erage time between the start of production of one unit
and the start of production of the next unit. How fast
are items moving through the machines? What is op-
timal rate? In addition, what are the causes of pro-
duction disruption? Dolle would also like to know
how much time is spent on changeovers. A business
goal states objectives in business terms, whereas, a
data mining goal states objectives in technical terms.
A non-exhaustive list of data mining goals is as fol-
low. What is the frequency of machine stops and total
down time due to faulty strings/screw errors? How
fast are items moving through the machine? What is
the maximum pace and are there any delays in the
pace? Based on historical patterns, predict machine
stops and how to prevent them? What is the overall
downtime of a machine and what are the costs?
In general, production with 80-85 % efficiency is
considered very efficient. It is of interest to look into
every predicted and unpredicted issue/challenge dur-
ing production. Why did it happen? Can it be pre-
dicted and if so can it be prevented or prepared for?
How can production be optimised? Some challenges
during production are known, such as, breakdowns,
changeovers, minor stoppage, reduced speed, defects
and setup scrap. As a result, the success of the manu-
facturing process can be measured by calculating the
Overall Equipment Effectiveness (OEE)
2
. OEE is one
of the most widely used standards for measuring man-
ufacturing productivity.
3 DATA UNDERSTANDING
This section starts with initial data collection and pro-
ceeds with activities that targets understanding the
data. These activities include first insight into the
data, identifying data for analytic purposes, discov-
ering data quality issues and/or detecting interesting
subsets to form hypothesis regarding previously un-
detected patterns. Machine data (sensors and alarms)
and ERP system data (product, job execution and
work calendar) are provided by Dolle. The machine
data is provided in the form of binary values of 0’s
and 1’s. The number of attributes depends on the ma-
chine in question. The product dataset consists of 85
attributes, the job execution dataset consists of 69 at-
2
www.oee.com
tributes and the work calendar dataset contains 10 at-
tributes. Each job represents a specific business task
that is carried out for a certain time interval to produce
particular type of ladders. The structure of the data
does not conform to any standard and additionally no
assumptions can be made that two identical machines
display identical structures. Dolle’s case study clearly
illustrate the challenges faced in data analysis in the
smart manufacturing industry.
In this case study machine data (from the pro-
duction facility) has to be logged in order to regis-
ter the states of the machines. The logged data is
initially kept in detailed format in different database
tables (a separate table for each machine). As men-
tioned above, each machine has a different set of sen-
sors/attributes, for that reason only one of the ma-
chine is considered for demonstration purposes. The
selected machine consists of the following attributes:
(DateTime, MachineOn, PaceIn, PaceOut, FaultyS-
tring, ScrewError, Alarm). The DateTime is a record-
ing of a date and time event at one second granular-
ity. The MachineOn sensor indicates the machine is
running for a given job. The PaceIn of a string/beam
sensor represents an incoming string. The PaceOut
of a ladder sensor represents an outgoing ladder. The
FaultyString sensor signifies the quality of the string,
the bended or twisted strings are regarded as faulty
strings. The ScrewError sensor corresponds to the
screw machine that screw strings into place. Finally,
the Alarm stands in for abnormality in the machine.
To provide a snapshot of data, a real machine
dataset provided by Dolle is used. The snapshot con-
tains 7 attributes for job no. 307810 to produce Click-
Fix type ladder. In Table 1, the granularity of the de-
tailed data is at second by job by machine. For in-
stance, row number 1 reads as follows: DateTime=19-
02-2019 09:53:07 (represents: second granularity. It
is important to note that if the next row has same
values as the previous row in that case the next row
will not be logged to the database, for that reason the
holes at the second granularity are visible), Machi-
neOn=1 (represents: machine is running), PaceIn=0
(represents: no string is entering), PaceOut=1 (repre-
sents: exiting of the ladder), FaultyString=0 (repre-
sents: the quality is OK), ScrewError=0 (represents:
no error) and Alarm=0 (represents: no abnormality).
Whereas, Id is used only for row identification pur-
poses. Further, initial look into the data in Table 1
reveals some interesting facts, such as, the ladder is
produced (row 5) in 09:54:04-09:53:07=57 seconds,
where as, the next ladder is produced (row 10) in
09:56:29- 09:54:04=145 seconds. The delay in the
production of the next ladder is due to the fact that a
screw machine error has caused the delay (row 8).
Data Analytics for Smart Manufacturing: A Case Study
393

Table 1: Snapshot of sensor and alarm data.
Id DateTime MachineOn PaceIn PaceOut FaultyString ScrewError Alarm
1 19-02-2019 09:53:07 1 0 1 0 0 0
2 19-02-2019 09:53:09 1 1 1 0 0 0
. . . . . . . .
3 19-02-2019 09:53:56 1 1 0 0 0 0
4 19-02-2019 09:53:58 1 0 0 0 0 0
5 19-02-2019 09:54:04 1 0 1 0 0 0
6 19-02-2019 09:54:09 1 0 0 0 0 0
7 19-02-2019 09:54:14 1 1 0 0 0 0
. . . . . . . .
8 19-02-2019 09:56:14 1 0 0 0 1 0
9 19-02-2019 09:56:16 1 0 0 0 0 0
10 19-02-2019 09:56:29 1 0 1 0 0 0
11 19-02-2019 09:56:31 1 1 1 0 0 0
12 19-02-2019 09:56:33 1 0 0 0 0 0
After having a first insight into the data, it is ob-
served that data requires thorough cleansing. Data
show a number of issues such as, duplicates, incor-
rect, incomplete and missing values, however, the
most critical issue is the presence of partial dupli-
cates. Partial duplicates means that more than one
row is connected with the same observation, however,
the values in the rows are not exactly the same. Fur-
ther, several interesting subsets are also identified to
form hypothesis regarding initial data patterns. For
example, whether screw machine errors causes more
machine stops than faulty strings.
4 DATA PREPARATION
This section provides insight into the business prob-
lems before performing data modeling. The data
preparation phase include activities, such as data se-
lection, data transformation, data cleaning and data
validation. Data preparation tasks may be performed
several times and not in any given order. During this
phase important issues are addressed like selecting the
relevant data, cleaning of data, discarding unaccept-
able data and how the ERP system data can be inte-
grated into the final data sets. Some of the cleaning
techniques discussed in (Iftikhar et al., 2015) may be
applicable here as well.
Metadata originating from discussions between
data scientists and domain experts has shown great
importance in the process of data validation. Some
meta issues can not be inferred from the sensor data
but require domain expertise like: is the machine out-
put reliable, especially when the alarm is ON, can this
be verified? Logically the answer is YES, as during
production of certain types of ladders the alarm is dis-
regarded. Another anomaly is that the output showed
double the numbers of ladders produced that actually
produced. The reason is that the pace out sensor was
triggered twice in the process of folding the ladder,
this was subsequently corrected in the logging pro-
cess. The other aspect of data validity is adequacy,
is there sufficient amount of data to make valid pre-
dictions? By examining data from one of the ladder
machines where no output was generated the ques-
tion “why”, arises. In this case, the machine in ques-
tion was jammed and the ladder machine could not
deliver it’s output and hence stood still. An addi-
tional sensor would have enabled the predictive abil-
ity to identify why no output was produced. Deci-
sions about the format of the final data sets and gran-
ularity are also made at this phase. When address-
ing the data granularity, the maximum data sample
rate is “1 second”, however, the data set shows that
more than one sensor status changed within the lim-
ited time (see row 11 and 12 in Table 1). It can seen
in row 11 that the PaceIn and PaceOut sensors both
have values “1” at 09:56:31, as there is no change in
the status of the sensors at 09:56:32 for that reason
no row has been recorded. Similarly, row 12 shows
that PaceIn and PaceOut sensors both have values “0”
at 09:56:33, which means that multiple sensors status
changes within 1 second. Based on this observation,
when trying to establish a relation it is important to
know if A follows B or B follows A, hence the used
method of recording sensors status at a granularity of
1 second may not be a good option, it should be at a
finer granularity, such as 500 milliseconds or better.
Another aspect of data preparation phase is to con-
struct data pipelines and perform EDA. The focus of
this paper is on data pipeline and EDA rather than data
cleansing/validation for that reason only data pipeline
and exploratory analysis are further discussed.
DATA 2019 - 8th International Conference on Data Science, Technology and Applications
394
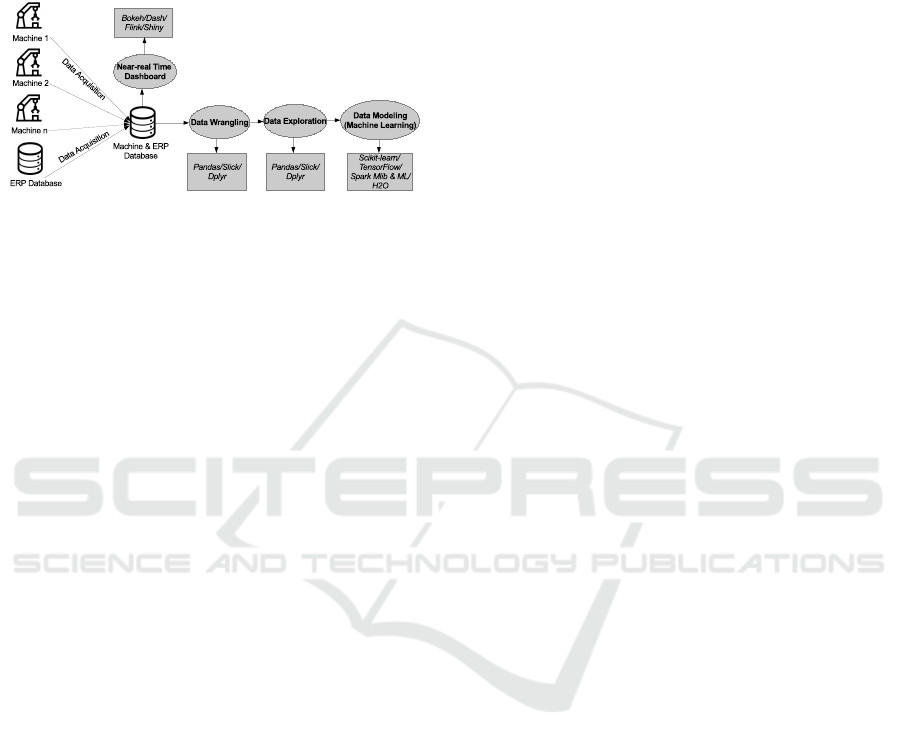
4.1 Data Pipeline
The proposed data pipeline consists of digesting or
processing raw data, extracting meaningful features
and applying machine learning model.
Figure 1: Proposed data pipeline.
Fig. 1 presents the data pipeline along with the
proposed technologies. This pipeline is not specific to
Dolle and may easily be adapted to other situations.
At data acquisition step, raw data is collected from
multiple data sources and stored at a central reposi-
tory. Data acquisition can be performed with Python,
R or Scala. Next, a data wrangling step transforms
the data into a canonical data format. Data clean-
ing, reduction and integration also takes place at this
stage. Further, data exploration step performs initial
descriptive analysis and visualization. For data wran-
gling and exploration, Python’s pandas, Scala’s slick
and R’s dplyr are recommended technologies, where
as, for visualization Python’s matplotlib and seaborn,
Scala’s vegas and R’s ggplot2 are powerful technolo-
gies. Furthermore, data modeling step is the general
concept of building a model that is capable of mak-
ing predictions. For predictive modeling, Python’s
tensorflow and scikit-learn, Scala’s spark mllib & ml
and R’s h2o are well known technologies. In addition,
the dashboard may displays the intput/output pace and
OEE in near real-time. For dashboard, Python’s dash
and bokeh, Scala’s flink and R’s shiny are typical tech-
nologies.
4.2 Exploratory Analysis
Exploratory data analysis (EDA) is primarily a
graphic approach that provides a first insight into the
data. There are no formal set of rules that can be used
in EDA, however, common approaches are: summary
statistics, correlation, visualization and aggregation.
Summary statistics or univariate analysis is the first
step that helps us to understand data. Univariate anal-
ysis is the simplest form of data analysis where the
data being analyzed contains only one variable. Fur-
ther, data correlation or multivariate analysis helps us
to find relationships between two or more variables.
Finding connections between variables also has a cru-
cial impact on choosing and building the predictive
model(s). Data visualization helps us to gain perspec-
tive into the data, such as to find anomalies and to
detect outliers. Finally, data aggregation helps us to
group data from coarser to finer granularities in order
to improve understanding.
The most interesting findings in the univariate
EDA are skewness and kurtosis. Skewness is a mea-
sure of symmetry and kurtosis is a measure of tailed-
ness. The MachineOn (-6.59) variable is extremely
skewed towards right side (98% of the rows shows
that machine is on). FaultyString (6.18) and Screw-
Error (3.08) variables are also extremely skewed to-
wards left. Similarly, MachineOn (41.50) and Fault-
yString (36.24) variables have very high positive Kur-
tosis values that means that MachineOn is substan-
tially peaked towards 1 and FaultyString is peaked to-
wards 0. As, for perfectly symmetrical data the skew-
ness is 0 and kurtosis is 3 for that reason it can be
concluded that at least half of the variables of the ma-
chine data are highly skewed towards either 1 or 0.
In addition, correlation matrices are constructed to
carry out multivariate EDA. The correlation matrix of
the sensor and the alarm variables at second granular-
ity shows no interdependence. For that reason, data is
being aggregated at daily granularity by job. Fig. 2,
shows some interesting positive and negative correla-
tions. The correlations with respect to pace in, pace
out, screw error, faulty string, machine off, number
of unplanned stops and downtime are of particular in-
terest. Due to the fact that one of the main aims of
this analysis is to figure out which factors slow down
the production and eventually triggers the machine to
stop. The coefficient values (-0.35 and +0.37) be-
tween pace in/out duration and faulty string/machine
stops indicate both weak negative and positive cor-
relations. Further, the coefficient values (+0.37 and
+0.38) between screw error/faulty string duration and
machine stops indicate weak positive correlations.
Moreover, the coefficient values (+0.54 and +0.96)
between downtime and job duration/machine off du-
ration indicate moderate to strong positive correla-
tions. Hence, it can be concluded that screw error and
faulty string both have weak to moderate effect on the
number of unplanned machine stops, however, the du-
ration of these stops have a strong positive correlation
with down time.
Furthermore, Fig. 3 (a-d) provide an overview of
the sensor and alarm data at hourly and daily granu-
larities, respectively. It is seen in Fig. 3 (a) that the
machine is on almost all the time. The pace of the in-
coming strings is also fine with very few stops, how-
ever, the pace of outgoing ladders has some stops.
Data Analytics for Smart Manufacturing: A Case Study
395
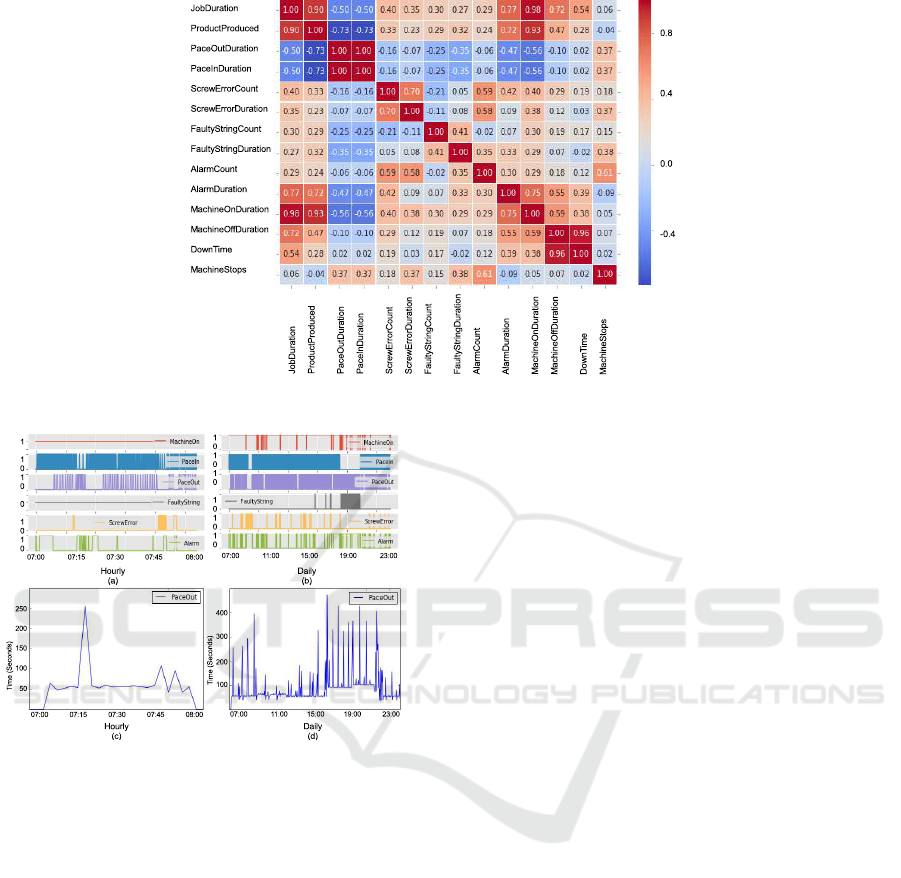
Figure 2: Sensor and alarm (aggregated at daily granularity) correlation heat map.
Figure 3: Sensor and alarm data overview.
The outgoing pace slows down (Fig. 3 (c)) between
07:15 and 07:20 as well as between 07:45 and 07:55.
These slow downs are partly caused by errors in the
screw machine, also both these slow downs trigger
the alarm. Fig. 3 (b) demonstrates that the machine is
on most of the time, incoming pace slows down be-
tween 16:00 and 21:00 mainly due to faulty strings
that also slow down the outgoing pace (Fig. 3 (d)).
Moreover, the results of the detailed analysis at daily
granularity are illustrated in Fig. 4 (a-b). Fig. 4 (a),
shows that there are opportunities both for undertak-
ing more jobs as well as for increasing the “machine
on” duration. Likewise, “machine off” duration and
downtime are also quite significant. Screw machine
errors are little more frequent than faulty strings and
definitely alarm duration is also quite high. Fig. 4 (b)
presents the frequency of products produced, screw
machines errors, faulty strings, alarms and stops. The
frequency of the screw machine errors, the alarms and
the machine stops are noticeable. The average pace
of incoming strings and outgoing ladders is also cal-
culated. The optimal incoming pace is 9.5 seconds
and outgoing pace is 60 seconds, however, the actual
incoming pace is 15.5 seconds and outgoing pace is
93.5 seconds.
To summarize, the EDA discloses that data is not
uniformly distributed and almost half of the variables
are highly skewed and/or peaked. Further, due to
the binary nature of data, correlation matrices only
reveal weak interdependence between the variables.
In addition, visualisation and aggregations confirm
that screw machines errors are causing more machine
stops than faulty strings and machine downtime needs
to be reduced. In addition, to give these findings a
commercial value a learning loop must be introduced
where the finding are followed by actions and new
data is compared to “old” data to check if actions have
the anticipated effect.
5 MODELING
This section introduces the basic concepts of ma-
chine learning based models and explains some of
the key issues such as model sampling. One of the
main goals of this case study is to predict the ma-
chine’s unplanned stops based on historical conse-
quences/patterns. Based on the kind of data available
and the research question/goal, supervised machine
learning can be used to predict when the machine is
going to stop. Supervised learning algorithms train
from historical data, such as Machine is on “1” or off
“0”. The algorithm determines which label should
be given to new data based on historical patterns.
Most commonly used classification algorithms in ma-
DATA 2019 - 8th International Conference on Data Science, Technology and Applications
396
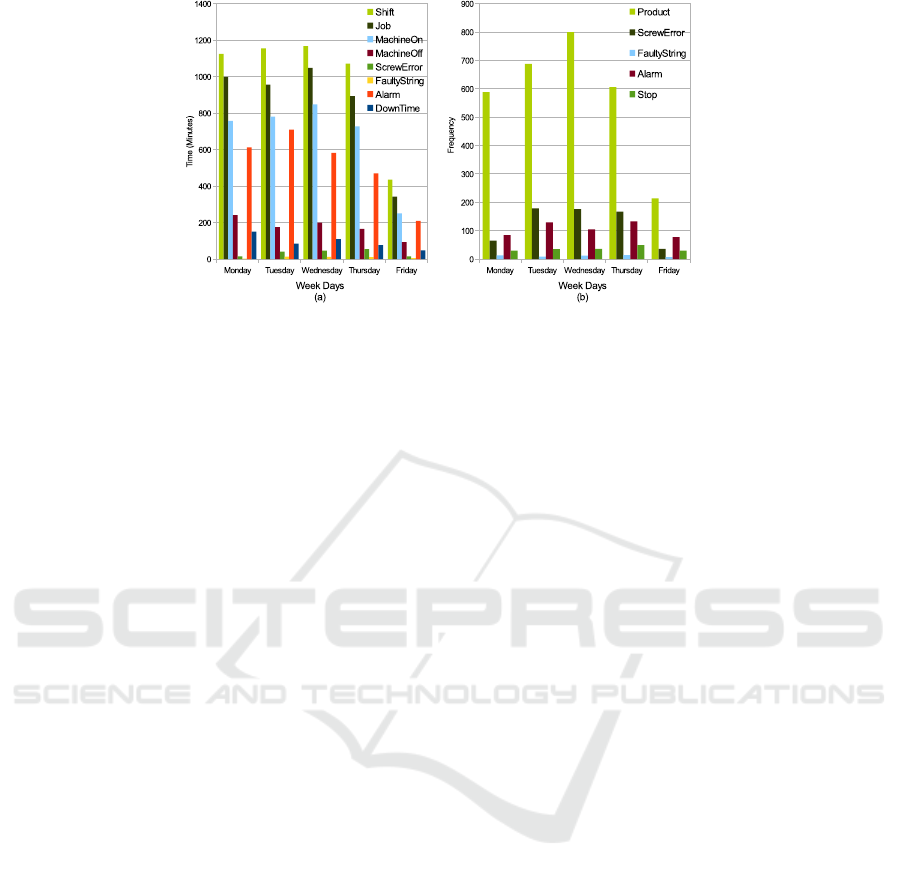
Figure 4: Detailed data analysis at daily granularity.
chine learning are logistic regression, naive bayes,
support vector machines, decision trees, neural net-
works, ARIMA and so on (Gooijer and Hyndman,
2006). In this paper, logistic regression is used for
the reason that it is one of the frequently used ma-
chine learning approaches for two-class binary clas-
sification. It is called regression, however, it per-
forms classification based on regression by classify-
ing the binary dependent variable into either zero or
one. Out of 1.2 million instances only in 25000 in-
stances the machine is off. Even though the duration
of these stops (downtime) is considerable (Fig. 4 (a)),
still their frequency is only 2%. Meanwhile, major-
ity of the machine learning algorithms presume that
the data set is balanced for that reason the predictions
for minority target class can be poor. As, the minor-
ity target class “MachineOn = 0” (means machine is
off) is the main focus of prediction, thus the data set
has to be re-sampled. Two common approaches are
over-sampling that is to add instances of “MachineOn
= 0” and under-sampling that is to delete instances of
“MachineOn = 1” (Gonzalez et al., 2019). In this pa-
per, under-sampling is used by dividing the machine
on/off frequency into a 50/50 ratio. This means that
randomly selecting 25000 instances where machine
is on and 25000 instances where the machine is off.
The sample size has dramatically reduced, however,
the prediction will not be biased. The following set of
equations present the logistic model for binary data:
y = β
0
+ β
1
X
1
+ β
2
X
2
+ ..... + β
n
X
n
(1)
Equation 1, is a linear regression equation, where
y is dependent variable and X
1
, X
2
... and X
n
are ex-
planatory variables. β
0
is the intercept and β
1
, β
2
...
and β
n
represent the slope of the regression line.
p = 1/(1 + e
−y
) (2)
The logistic function presented in Equation 2 is
the sigmoid function. The sigmoid function is a math-
ematical function having an “S” shaped curve (sig-
moid curve). The logistic function applies a sigmoid
function in order to restrict the y value between zero
and one.
p = 1/(1 +e
−(β
0
+β
1
X
1
+β
2
X
2
+.....+β
n
X
n
)
) (3)
Finally, Equation 3 is applying Sigmoid function
on the linear regression.
6 EVALUATION
6.1 Equipment Effectiveness
This section evaluates OEE of Dolle’s manufactur-
ing process. OEE calculates the percentage of man-
ufacturing time that is actually productive. It can be
used as a benchmark as well as a baseline. In gen-
eral, OEE consists of three factors, which are avail-
ability, performance and quality. Availability consid-
ers all the incidents that stop the planned production.
Performance considers those events that causes the
manufacturing process to run at less optimal speed.
Where as, quality takes into consideration the man-
ufactured products that do not meet the quality stan-
dards. An OEE score of 100% means that the man-
ufacturing is going along at an optimal pace, without
any unplanned stops and producing only good qual-
ity products. In order to provide a clear picture of the
productivity and the areas for further improvements
the OEE calculation of Dolle’s manufacturing process
is performed based on the following items and data:
Morning Shift Length = 510 min, Breaks = 60 min,
Stop/Down Time = 80 min, Ideal Production Time =
60 sec, Total Count = 260 ladders and Reject Count
= 2 ladders. In order to calculate OEE, these steps
are followed. First, Planned Production Time (PPT)
and Run Time (RT) are calculated. The Planned Pro-
duction Time is the standard shift time excluding the
Data Analytics for Smart Manufacturing: A Case Study
397

planned breaks, such as lunch/coffee breaks as well
as shift change over time. The Run Time is the ac-
tual time of production excluding both the planned
and unplanned stops, such as job/product switch over
stops, stops caused by faulty string or by screw ma-
chine error and so on. Afterwards, Good Count (GC)
is calculated by rejecting the defected ladders.
PPT = Shift Length - Breaks =
510 minutes - 60 minutes = 450 minutes
RT = PPT - Stop Time =
450 minutes - 80 minutes = 370 minutes
GC = Total Count - Reject Count =
260 ladders - 2 ladder = 258 ladders
Next, Availability (A), Performance (P) and Qual-
ity (Q) are calculated. Availability, calculates the time
when the manufacturing process is not running or ma-
chine is “OFF” for some reasons. It takes into account
machine failure (unplanned stops) and setup for next
job and/or adjustments (planned stops). Performance,
estimates that whether the process is running at its op-
timal pace and quality concerns with quality standards
of the products being produced.
A = RT / PPT = 370 minutes / 450 minutes =
0.8222 = 82.22%
P = (Ideal Production Time * Total Count) / RT
= (60 seconds * 260 ladders) /
(370 * 60 seconds) = 0.7027 = 70.27%
Q = Good Count / Total count = 258 ladders /
260 ladders = 0.9923 = 99.23%
Finally, OEE score is computed.
OEE = A * P * Q = 0.8222 * 0.7027 * 0.9923 =
0.5733 = 57.33%
OEE score of 57.33% is fairly typical for automate
manufacturing industry, however, it indicates there
is significant opportunity for improvement in perfor-
mance. The performance score can be improved by
reducing the switch over time between the jobs, by
identifying the reasons for machine stops and finally
by tackling the major cause(s) of downtime and so on.
6.2 Model Performance
This section measures the performance of the chosen
classification technique (logistic regression).
Fig. 5, presents a confusion matrix using heat
map. The matrix shows that out of 7660 actual in-
stances (first row) of “MachineOn = 0” (true nega-
tive), the classifier predicted correctly 7400 (96%) of
them. Similarly, out of 8030 instances (second row)
of “MachineOn = 1” (true positive), the classifier pre-
dicted correctly 5140 (64%) of them. The area under
the curve (AUC) score of the proposed classifier is
0.87, which means that the classifier is quite reason-
able. If the AUC score is close to 0.5, the classifier
Figure 5: Confusion matrix.
is just doing the random predictions, however, it pre-
dicts better as the score approaches close to 1.
7 RELATED WORK
This section mainly concentrates on the previous
work done in relation to data analytics for smart man-
ufacturing. According to (Lee et al., 2014), smart
manufacturing still lacks smart analytical techniques
and tools. In order to improve productivity, per-
formance of the manufacturing machinery should be
measured and optimized with the help of data ana-
lytics technologies. A state-of-the-art review of deep
learning techniques for machinery fault diagnosis,
predictive analytics and defect prognosis is presented
by (Wang et al., 2018). Similarly, big data analytics
in semiconductor manufacturing industry was stud-
ied by (Moyne and Iskandar, 2017). Further, (Muller
et al., 2018) described that big data analytical assets
are associated with an average of 3-7 % improvement
in firm productivity. (Tao et al., 2018) mentioned that
data analytics provides an opportunity in the manu-
facturing industry to adopt data-driven strategies in
order to become more competitive. Further, a survey
by (Kamble et al., 2018) highlighted that the manu-
facturing industry has realized that the data analytics
capabilities are must for future growth. These pre-
vious works focus on various aspects and recent ad-
vancements of data analytics in smart manufacturing.
The work presented in this paper is build on top of
the ideas presented in those previous works. Most of
them focus on theoretical issues in relation to storage,
management and data processing. Hence, the focus
of this paper is to provide practical application of data
analytics technologies.
There are also works that focus on predictive an-
alytics for smart manufacturing. (Auschitzky et al.,
2014) proposed the use of advanced analytics such
as, data visualization, correlation analysis and artifi-
cial neural networks to take a deep dive into historical
data, in order to identify initial patterns. Further, pre-
dicting the bottlenecks in a production system based
DATA 2019 - 8th International Conference on Data Science, Technology and Applications
398

on the active periods of the machines using ARIMA
method was proposed by (Subramaniyan et al., 2018).
Similarly, a big data analytical architecture for prod-
uct life cycle management was presented by (Zhang
et al., 2017). Furthermore, (Shin et al., 2017) pre-
sented an analytic model for predicting energy con-
sumption of manufacturing machinery.
In the best of our knowledge, this paper is the first
to deal with in-depth analysis of sensor binary data
in order to enhance operational efficiency for smart
manufacturing based on the real world case study.
8 CONCLUSIONS AND FUTURE
WORK
This paper presents the fundamental concepts of data
analytics based on a real world case study. These
concepts include data understanding, data prepara-
tion, data pipeline and data analytics technologies. To
enhance the operational efficiency in-depth descrip-
tive and predictive analysis were performed. Super-
vised machine learning technique was used to create
the classification model to predicts machine stops. In
addition, Overall Equipment Effectiveness (OEE) and
the performance of the prediction method were com-
prehensively evaluated. The results have drawn atten-
tion towards improving the production performance
by reducing the machine downtime. Whereas, the
predictions made by the model are quite acceptable in
terms of predicting the unplanned stops, as unplanned
stops are one of the main reasons of reduced produc-
tion performance.
For the future work, several prediction based ma-
chine learning models will be used and compared. In
addition, a near real-time dashboard will be developed
to display the input/output pace along with the OEE
information. Finally, it will be investigated that how
descriptive analysis, predictive analysis and near real-
time dashboard help the smart manufacturing compa-
nies in general, to enhance their operational efficiency
and productivity.
REFERENCES
Auschitzky, E., Markus, H., and Agesan, R. (2014).
How big data can improve manufacturing.
Available online at: https://www.mckinsey.
com/business-functions/operations/our-insights/
how-big-data-can-improve-manufacturing.
Chapman, P., Clinton, J., Kerber, R., Khabaza, T., Reinartz,
T., Shearer, C., and Wirth, R. (1999). Crisp-dm 1.0
step-by-step data mining guide. In 4th CRISP-DM
SIG Workshop in Brussels in March (Vol. 1999). SPSS
Inc.
Gonzalez, S., Garcia, S., Li, S. T., and Herrera, F. (2019).
Chain based sampling for monotonic imbalanced clas-
sification. Information Sciences, 474:187–204.
Gooijer, J. G. D. and Hyndman, R. J. (2006). 25 years of
time series forecasting. International Journal of Fore-
casting, 22(3):443–473.
Iftikhar, N., Liu, X., and Nordbjerg, F. E. (2015).
Relational-based sensor data cleansing. In ADBIS’15,
East European Conference on Advances in Databases
and Information Systems, pages 108–118. Springer,
Cham.
Kamble, S. S., Gunasekaran, A., and Gawankar, S. A.
(2018). Sustainable industry 4.0 framework: A sys-
tematic literature review identifying the current trends
and future perspectives. Process Safety and Environ-
mental Protection, 117:408–425.
Lee, J., Kao, H. A., and Yang, S. (2014). Service innova-
tion and smart analytics for industry 4.0 and big data
environment. Procedia CIR, 16:3–8.
Moyne, J. and Iskandar, J. (2017). Big data analytics for
smart manufacturing: Case studies in semiconductor
manufacturing. Processes, 5(3):39–58.
Muller, O., Fay, M., and vom Brocke, J. (2018). The ef-
fect of big data and analytics on firm performance: An
econometric analysis considering industry character-
istics. Journal of Management Information Systems,
35(2):488–509.
Shin, S. J., Woo, J., and Rachuri, S. (2017). Predictive ana-
lytics model for power consumption in manufacturing.
Procedia CIRP, 15:153–158.
Subramaniyan, M., Skoogh, A., Salomonsson, H., Banga-
lore, P., and Bokrantz, J. (2018). A data-driven algo-
rithm to predict throughput bottlenecks in a produc-
tion system based on active periods of the machines.
Computers & Industrial Engineering, 125:533–544.
Tao, F., Qi, Q., Liu, A., and Kusiak, A. (2018). Data-driven
smart manufacturing. Journal of Manufacturing Sys-
tems, 48:157–169.
Wang, J., Ma, Y., Zhang, L., Gao, R. X., and Wu, D. (2018).
Deep learning for smart manufacturing. Journal of
Manufacturing Systems, 48:144–156.
Zhang, Y., Ren, S., Liu, Y., and Si, S. (2017). A big data
analytics architecture for cleaner manufacturing and
maintenance processes of complex products. Comput-
ers & Industrial Engineering, 142:626–641.
Data Analytics for Smart Manufacturing: A Case Study
399
